HAL Id: hal-01789168
https://hal.archives-ouvertes.fr/hal-01789168
Submitted on 9 May 2018HAL is a multi-disciplinary open access
archive for the deposit and dissemination of sci-entific research documents, whether they are pub-lished or not. The documents may come from teaching and research institutions in France or abroad, or from public or private research centers.
L’archive ouverte pluridisciplinaire HAL, est destinée au dépôt et à la diffusion de documents scientifiques de niveau recherche, publiés ou non, émanant des établissements d’enseignement et de recherche français ou étrangers, des laboratoires publics ou privés.
Galaxy growth in a massive halo in the first billion years
of cosmic history
D. P. Marrone, J. S. Spilker, C. C. Hayward, J. D. Vieira, M. Aravena, M. L.
N. Ashby, M. B. Bayliss, M. Bethermin, M. Brodwin, M. S. Bothwell, et al.
To cite this version:
D. P. Marrone, J. S. Spilker, C. C. Hayward, J. D. Vieira, M. Aravena, et al.. Galaxy growth in a massive halo in the first billion years of cosmic history. Nature, Nature Publishing Group, 2018, 553 (7686), pp.51 - 54. �10.1038/nature24629�. �hal-01789168�
Galaxy growth in a massive halo in the first billion years
of cosmic history
D. P. Marrone1, J. S. Spilker1, C. C. Hayward2,3, J. D. Vieira4, M. Aravena5, M. L. N. Ashby3,
M. B. Bayliss6, M. B´ethermin7, M. Brodwin8, M. S. Bothwell9,10, J. E. Carlstrom11,12,13,14, S. C.
Chapman15, Chian-Chou Chen16, T. M. Crawford11,14, D. J. M. Cunningham15,17, C. De Breuck16,
C. D. Fassnacht18, A. H. Gonzalez19, T. R. Greve20, Y. D. Hezaveh21,28, K. Lacaille22, K. C. Litke1,
S. Lower4, J. Ma19, M. Malkan23, T. B. Miller15, W. R. Morningstar21, E. J. Murphy24, D. Narayanan19,
K. A. Phadke4, K. M. Rotermund15, J. Sreevani4, B. Stalder25, A. A. Stark3, M. L. Strandet26,27,
M. Tang1, & A. Weiß26
1Steward Observatory, University of Arizona, 933 North Cherry Avenue, Tucson, AZ 85721, USA
2Center for Computational Astrophysics, Flatiron Institute, 162 Fifth Avenue, New York, NY
10010, USA
3Harvard-Smithsonian Center for Astrophysics, 60 Garden Street, Cambridge, MA 02138, USA
4Department of Astronomy, University of Illinois, 1002 West Green St., Urbana, IL 61801
5N´ucleo de Astronom´ıa, Facultad de Ingenier´ıa, Universidad Diego Portales, Avenida Ej´ercito 441,
Santiago, Chile
6Kavli Institute for Astrophysics & Space Research, Massachusetts Institute of Technology, 77
Massachusetts Avenue, Cambridge, MA 02139, USA
7Aix Marseille Universit´e, CNRS, LAM, Laboratoire d’Astrophysique de Marseille, Marseille,
France
8Department of Physics and Astronomy, University of Missouri, 5110 Rockhill Road, Kansas City,
MO 64110, USA
9Cavendish Laboratory, University of Cambridge, 19 J.J. Thomson Avenue, Cambridge, CB3 0HE,
UK
10Kavli Institute for Cosmology, University of Cambridge, Madingley Road, Cambridge CB3
0HA, UK
11Kavli Institute for Cosmological Physics, University of Chicago, 5640 South Ellis Avenue,
Chicago, IL 60637, USA
12Department of Physics, University of Chicago, 5640 South Ellis Avenue, Chicago, IL 60637,
USA
13Enrico Fermi Institute, University of Chicago, 5640 South Ellis Avenue, Chicago, IL 60637,
USA
14Department of Astronomy and Astrophysics, University of Chicago, 5640 South Ellis Avenue,
Chicago, IL 60637, USA
15Dalhousie University, Halifax, Nova Scotia, Canada
16European Southern Observatory, Karl Schwarzschild Straße 2, 85748 Garching, Germany
17Department of Astronomy and Physics, Saint Mary’s University, Halifax, Nova Scotia, Canada
18Department of Physics, University of California, One Shields Avenue, Davis, CA 95616, USA
19Department of Astronomy, University of Florida, Bryant Space Sciences Center, Gainesville, FL
32611 USA
20Department of Physics and Astronomy, University College London, Gower Street, London
WC1E 6BT, UK
21Kavli Institute for Particle Astrophysics and Cosmology, Stanford University, Stanford, CA
94305, USA
22Department of Physics and Astronomy, McMaster University, Hamilton, ON L8S 4M1 Canada
23Department of Physics and Astronomy, University of California, Los Angeles, CA 90095-1547,
USA
24National Radio Astronomy Observatory, 520 Edgemont Road, Charlottesville, VA 22903, USA
25Large Synoptic Survey Telescope, 950 North Cherry Avenue, Tucson, AZ 85719, USA
26Max-Planck-Institut f¨ur Radioastronomie, Auf dem H¨ugel 69 D-53121 Bonn, Germany
27International Max Planck Research School (IMPRS) for Astronomy and Astrophysics,
Universi-ties of Bonn and Cologne
28Hubble Fellow
According to the current understanding of cosmic structure formation, the precursors of the most massive structures in the Universe began to form shortly after the Big Bang, in regions
corresponding to the largest fluctuations in the cosmic density field1–3. Observing these
struc-tures during their period of active growth and assembly—the first few hundred million years of the Universe—is challenging because it requires surveys that are sensitive enough to detect the distant galaxies that act as signposts for these structures and wide enough to capture the
rarest objects. As a result, very few such objects have been detected so far4, 5. Here we report
observations of a far-infrared-luminous object at redshift 6.900 (less than 800 Myr after the
Big Bang) that was discovered in a wide-field survey6. High-resolution imaging reveals this
source to be a pair of extremely massive star-forming galaxies. The larger of these galaxies is forming stars at a rate of 2900 solar masses per year, contains 270 billion solar masses of gas and 2.5 billion solar masses of dust, and is more massive than any other known object at a redshift of more than 6. Its rapid star formation is probably triggered by its compan-ion galaxy at a projected separatcompan-ion of just 8 kiloparsecs. This merging compancompan-ion hosts 35
billion solar masses of stars and has a star-formation rate of 540 solar masses per year, but has an order of magnitude less gas and dust than its neighbor and physical conditions akin
to those observed in lower-metallicity galaxies in the nearby Universe7. These objects suggest
the presence of a dark-matter halo with a mass of more than 400 billion solar masses, making it among the rarest dark-matter haloes that should exist in the Universe at this epoch.
SPT0311–58 (SPT-S J031132-5823.4) was originally identified in the 2500 deg2 South Pole
Telescope (SPT) survey8, 9 as a luminous source (flux densities of 7.5 and 19.0 mJy at wavelengths
of 2.0 mm and 1.4 mm) with a steeply rising spectrum, indicative of thermal dust emission. Obser-vations with the Atacama Large Millimeter/submillimeter Array (ALMA) provide the redshift of the source. The J = 6 − 5 and 7 − 6 rotational transitions of the carbon monoxide molecule, along
with the3P2−3P1fine structure transition of atomic carbon, were found redshifted to 87-103 GHz
in a wide spectral scan6. The frequencies and spacings of these lines unambiguously place the
galaxy at z = 6.900(2), corresponding to a cosmic age of 780 Myr (using recent cosmological
parameters10 of Hubble constant H0 = 67.7 km/s/Mpc, matter density Ωm = 0.309, and vacuum
energy density ΩΛ = 0.691). An elongated faint object is seen at optical and near-infrared
wave-lengths, consistent with a nearly edge-on spiral galaxy at z = 1.4 ± 0.4 acting as a gravitational lens for the background source (see Methods section ‘Modelling the SED’; here and elsewhere the error range quoted corresponds to a 1σ uncertainty). Together these observations indicate that SPT0311–58 is the most distant known member of the population of massive, infrared-bright but
optically dim dusty galaxies identified with ground- and space-based wide-field surveys11.
The far-infrared emission from SPT0311–58 provides an opportunity to study its structure
with little confusion from the foreground galaxy. We conducted ALMA observations at ∼0.300
resolution at three different frequencies (see Methods), 240, 350, and 420 GHz, corresponding to rest-frame 160, 110, and 90 µm. The observations at 240 GHz include the 158 µm fine-structure
line of ionized carbon ([CII]) and those at 420 GHz the 88 µm fine-structure line of doubly ionized
oxygen ([OIII]). The 160 µm continuum and [CII] and [OIII] line emission maps of the source are
shown in Fig 1. Two emissive structures are visible in the map, SPT0311–58E and SPT0311–
58W, which are separated by less than 200on the sky, before correction for gravitational deflection.
While the morphology of the eastern and western sources is reminiscent of a lensing arc (W) and
counter-image (E), the [CII] line clarifies the physical situation. SPT0311–58E is separated from
the brighter W source by 700 km s−1and is therefore a distinct galaxy.
Lens modeling of the 160, 110, and 90 µm continuum emission from this source was
Section ‘Gravitational lens modelling’). The source structure and lensing geometry is consistent between the observations, and indicates that the two galaxies are separated by a projected (proper) distance of 8 kpc in the source plane. SPT0311–58E has an effective radius of 1.1 kpc, while SPT0311–58W shows a clumpy, elongated structure 7.5 kpc across. The (flux-weighted)
source-averaged magnifications of each galaxy and of the system as a whole are quite low (µE = 1.3,
µW = 2.2, µtot = 2.0) because the W source is extended relative to the lensing caustic and the
E source is far from the region of high magnification. The same lensing model applied to the
channelized [CII] data reveals a clear velocity gradient across SPT0311–58W which may be due to
either rotational motions or a more complicated source structure coalescing at the end of a merger.
With the lensing geometry characterized, it is clear that the two galaxies that comprise SPT0311–58 are extremely luminous. Their intrinsic infrared (8-1000 µm) luminosities have been determined from observations of rest-frame ultraviolet to submillimeter emission (see Methods,
Section 7), and are LIR = (4.6 ± 1.2) × 1012 and (33 ± 7) × 1012 L for E and W,
respec-tively. Assuming that these sources are powered by star formation, as suggested by their extended far-infrared emission, these luminosities are unprecedented at z > 6. The implied
(magnification-corrected) star formation rates are correspondingly enormous, 540±175 and 2900±1800 M yr−1,
likely due to the increased instability associated with the tidal forces experienced by merging
galaxies13. The components of SPT0311–58 have luminosities and star formation rates similar to
the other massive z > 6 galaxies identified by their dust emission, including HFLS3 (z = 6.34),
which has a star formation rate of 1300 M yr−1 after correcting for a magnification factor14 of
2.2, and a close quasar-galaxy pair resolved recently with ALMA15at z = 6.59, which are forming
stars at rates of 1900 and 800 M yr−1. Unlike the latter case, however, there is no evidence of a
black hole in either source in SPT0311–58.
Unlike any other massive dusty source at z > 6, the rest-frame ultraviolet emission of SPT0311–58E is clearly detectable with modest integration by the Hubble Space Telescope. The
detected ultraviolet luminosity (LUV = 7.4 ± 0.7 × 10¹⁰ L ) suggests a star formation rate of
just 13 M yr−1, 2% of the rate derived from the far-infrared emission, which is consistent with
SPT0311–58E forming most of its stars behind an obscuring veil of dust. The inferred stellar mass
for this galaxy (see Methods Sec. 7) is (3.5 ± 1.5) × 1010 M . While no stellar light is
convinc-ingly seen from SPT0311–58W, the absence of rest-frame ultraviolet emission is likely explained
by heavy dust obscuration and is not unusual16. Although SPT0311–58E is the less massive of
the two components, even this galaxy is rare among ultraviolet-detected galaxies at z ∼ 7. Such
The far-infrared continuum and line emission of SPT0311–58E and W seen in Fig. 1(d-f) imply substantial differences in the physical conditions in these objects. Compared to the western
source, SPT0311–58E has a higher ratio of [CII] line to 160 µm continuum and a much larger
luminosity ratio between [OIII] and [CII]. The [OIII] emission is dramatically more luminous in the
eastern source, with most of the western source (excluding the southern end) showing no emission
at all. Because the formation of O++ ions requires photons with energies of more than 35.1 eV,
this line arises only in ionized regions around the hottest stars or near active galactic nuclei18. It is
unlikely that active galactic nuclei are the origin for the [OIII] line in SPT0311–58E, because both
the continuum and line emission extend across most of the galaxy rather than being concentrated in
a putative nuclear region. Observations of [OIII] 88 µm emission in actively star forming galaxies
at low7, 19 and high20 redshift have found that the line luminosity ratio between [OIII] and [CII]
rises as gas metallicity decreases. The ultraviolet photons capable of forming O++ have a longer
mean free path in a lower-metallicity interstellar medium than in a higher-metallicity one, and the
electron temperature remains higher for the same ionizing flux, both of which favor increased [OIII]
emission21. The difference in the [CII] line-to-continuum ratio may result from multiple effects:
the known suppression22–24 of the [CII]to-LIR ratio in regions of increased star formation surface
density (higher in SPT0311–58W), and the increased [CII]to-LIR ratio in star-forming galaxies
of lower metallicity7. Whether SPT0311–58E (or the southern edge of SPT0311–58W, which
is similar to E in these properties) has a more primordial interstellar medium than the bulk of SPT0311–58W can be tested in future observations.
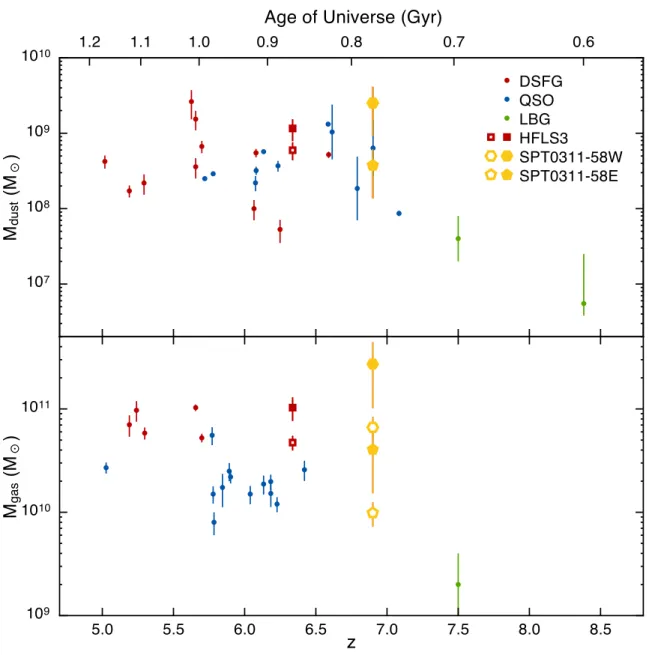
The masses of the components of SPT0311–58 are remarkable for a point just 780 Myr after the Big Bang. Fig. 2 compares SPT0311–58 to objects at z > 5 for which we have estimates of dust
mass (Mdust) and/or total gas mass (Mgas). For SPT0311–58 the best constraints on both of these
quantities come from the joint analysis6of its far-infrared continuum and line emission, specifically
the rotational transitions of carbon monoxide and neutral carbon. Here we have divided these masses among the two galaxies according to the lensing-corrected ratio of dust continuum emission (6.7) observed in our three high-resolution ALMA continuum observations, as the dust continuum luminosity is roughly proportional to the dust mass. The corresponding dust and gas masses are
Mgas = (2.7 ± 1.7) × 1011(W) and (0.4 ± 0.2) × 1011M (E), and Mdust = (2.5 ± 1.6) × 109
(W) and (0.4 ± 0.2) × 109 M (E). The gas mass can also be estimated using the CO luminosity,
though the conversion between luminosity and gas mass in this optically thick line is well-known to
vary substantially depending on many factors, including star formation intensity and metallicity25.
Taking the observed6 luminosity in the J = 3 − 2 line of CO, converting to J = 1 − 0 under
standard value of αCO = 1.0 M (K km s−1pc2) −1
, we derive Mgas = (6.6 ± 1.7) × 1010(W) and
Mgas = (1.0 ± 0.3) × 1010M (E). SPT0311–58W stands out above all of the known galaxies at
z > 6, that is, during the first ∼900 Myr of cosmic history.
SPT0311–58 highlights an early and extreme peak in the cosmic density field and presents an opportunity to test the predictions for the growth of structure in the current cosmological model. The mass of the dark matter halo that hosts this system is uncertain, but it can be estimated in several ways. Considering the gas masses of the two galaxies, which, for most massive star forming
galaxies26, 27, represent the dominant component of baryons that have cooled and assembled at the
center of the dark matter halo, the cosmic baryon fraction10fb = 0.19 places a hard lower bound on
the total halo mass of 4×10¹¹M for the lower (αCO-based) gas mass estimate. A less conservative
assumption incorporates the knowledge, based on observations across a wide range of redshifts,
that only a fraction of the baryons in a dark-matter halo (less than one-quarter, Mb/Mhalo = 0.05;
see figure 15 of Ref. 3) are destined to accrue to the stellar mass of the central galaxy3. In this case,
a total halo mass of (1.4 − 7.0) × 1012 M is implied, depending on which estimate of gas mass
is adopted. To understand the rareness of the dark matter halo hosting SPT0311–58, we calculate
curves describing the rarest halos that should exist in the universe at any redshift28. In Fig. 3 we
show the halo masses inferred for many high-redshift galaxies, using the same path of gas mass to halo mass described above, finding that SPT0311–58 is indeed closest to the exclusion curves and therefore marks an exceptional peak in the cosmic density field at this time.
We have found a system of massive, rapidly star forming, dusty galaxies at z = 6.900, the most distant galaxies of this type yet discovered. Two compact and infrared-luminous galaxies are
seen separated by less than 8 kpc in projection, and 700 km s−1in velocity, probably in the process
of forming one of the most massive galaxies of the era. Even before coalescence, the larger galaxy in the pair is more massive than any other galaxy known at z > 6. Although the discovery of such a system at this high redshift and in a survey that covered less than 10% of the sky is unprecedented, its existence is not precluded by the current cosmological paradigm.
33.0s 33.2s 03h11m33.4s Right Ascension 35.0" 34.0" 33.0" -58°23'32.0" Declination
(a) Total [CII]
E W 1" 0.0 0.5 1.0 1.5Intensity (Jy km/s / beam)
−1000 −500 0 500 1000 1500 Velocity (km/s) 0 5 10 0 5 10 15 20 25
Flux Density (mJy)
[CII] (Apparent) [OIII] (Apparent) W E (b) [CII] (Intrinsic)
(c) Source Plane Reconstruction [CII] Velocity 5 kpc −400 −200 0 200 400 600 800 Mean Velocity (km/s)
(d) Normalized [CII] / Continuum
1" 0.1 0.2 0.3 0.4 0.5 0.6 0.7 0.8
0.9 (e) Total [OIII]
1" 0.2 0.4 0.6 0.8 1.0 1.2 1.4 1.6
Intensity (Jy km/s / beam)
(f) [OIII] / [CII] 1" 0.0 0.5 1.0 1.5 2.0 Luminosity Ratio
Figure 1 | Continuum, [CII], and [OIII] emission from SPT0311–58 and the inferred source-plane
structure. (a) Emission in the 157.74 µm fine structure line of ionized carbon ([CII]) as measured at 240.57 GHz with ALMA, integrated across 1500 km s−1of velocity, is shown with the color scale. The range in flux per synthesized beam (the 0.25×0.3000beam is shown in the lower left), is provided at right. The rest-frame 160 µm continuum emission, measured simultaneously, is overlaid with contours at 8, 16, 32, 64 times the noise level of 34 µJy beam−1. SPT0311–58E and W are labeled. (b) The continuum-subtracted, source-integrated [CII] and [OIII] spectra. The upper spectra are as observed (“apparent”) with no correction for lensing, while the lensing-corrected (“intrinsic”) [CII] spectrum is shown at bottom. The E and W sources separate almost completely at a velocity of 500 km s−1. (c) The source-plane structure after removing the effect of gravitational lensing. The image is colored by the flux-weighted mean velocity, showing clearly that the two objects are physically associated but separated by roughly 700 km s−1 in velocity and 8 kpc (projected) in space. The reconstructed 160 µm continuum emission is shown in contours. A scale bar in the lower right represents the angular size of 5 kpc in the source plane. (d) The line-to-continuum ratio at the 158 µm wavelength of [CII], normalized to the map peak. The [CII] emission from SPT0311–58E is significantly brighter relative to its continuum than for W. The sky coordinates and rest-frame 160 µm continuum contours of Fig. 1(d), (e), and (f) are the same as in panel (a). (e) Velocity-integrated emission in the 88.36 µm fine structure line of doubly-ionized oxygen ([OIII]) as measured at 429.49 GHz with ALMA. The data have an intrinsic angular resolution of 0.2×0.300but have been tapered to 0.500owing to the lower signal-to-noise in these data. (f) The luminosity ratio between the [OIII] and [CII] lines. As in the case of the [CII] line-to-continuum ratio, a significant disparity is seen between the E and W galaxies of SPT0311–58.
5.0 5.5 6.0 6.5 7.0 7.5 8.0 8.5 107 108 109 1010 Md u st ( M⊙ ) DSFG QSO LBG HFLS3 SPT0311-58W SPT0311-58E 1.2 1.1 1.0 0.9 0.8 0.7 0.6
Age of Universe (Gyr)
5.0 5.5 6.0 6.5 7.0 7.5 8.0 8.5 z 109 1010 1011 Mg a s ( M⊙ )
Figure 2 | Mass measurements for high-redshift galaxies. Dust masses are taken from the literature,
as described in the Methods. Gas masses are primarily derived from observations of various CO rotational transitions, with the literature line luminosities converted to molecular gas masses under standardized as-sumptions (see Methods). The comparison sample is divided among three object classes: DSFGs, quasars (QSO), and Lyman-break galaxies (LBG). These objects are typically selected by FIR emission (DSFGs) or optical/infrared emission (QSOs, LBGs). Three additional DSFGs, SPT0311–58E (yellow pentagons), SPT0311–58W (yellow hexagons) and HFLS3 (red squares), have extensive photometry and line measure-ments, which enable more sophisticated estimates of their dust and gas masses6, 29from a combined analysis of the dust and CO line emission. For these objects we also show masses derived under the simpler analysis as open symbols (for SPT0311–58 the methods give very similar answers for Mdust). Error bars represent 1σ uncertainties.
4 5 6 7 8 9 z 1010 1011 1012 1013 1014 1015 Mh a lo ( M⊙ ) DSFG QSO LBG HFLS3 SPT0311-58 Full sky 2500 deg2 25 deg2 2.0 1.6 1.2 1.0 0.9 0.8 0.7 0.6
Age of Universe (Gyr)
Figure 3 | Halo masses for rare, high-redshift massive galaxies. The dark matter halo mass (Mhalo;
defined at an overdensity of 200 times the mean matter density of the universe) is inferred for galaxies in the first 2 Gyr after the Big Bang (see Methods). These masses present a range of lower limits, from the most conservative assumption (lower bars) that all baryons in the initial halo have been accounted for in the molecular gas mass, to the observationally motivated assumption (upper triangles) that the baryonic mass (Mb) in gas is a fixed ratio of the halo mass Mb/Mhalo = 0.05, calibrated through a comparison3 of simulations and observations spanning z = 0 − 8. The most massive halos that are expected to be observable28 within the whole sky (dotted line), the 2500 deg2 area of the SPT survey (dashed line), and within the subset of that area that is magnified by a factor of two or more (solid line) are also plotted as a function of redshift. As SPT0311–58E and W reside within the same halo, they are combined for this analysis. As in Fig. 2, halo masses are derived for HFLS3 (large red triangles) and SPT0311–58 (large yellow triangles) using only the CO luminosity (open symbols) and the more sophisticated dust and CO analysis (filled symbols); the pairs of points are slightly offset in redshift for clarity.
Methods
1 ALMA Millimeter/Submillimeter Interferometry
We have acquired four observations of SPT0311–58 with ALMA in four receiver bands (B3, B6, B7, B8, covering 84 to 432 GHz) under projects 2015.1.00504.S (PI: Strandet) and 2016.1.01293.S (PI: Marrone). A summary of these observations, including dates, calibration sources, integration times, atmospheric opacity, noise levels, and resolution, is provided in Extended Data Table 1. Salient details are provided below for each observation.
The redshift of SPT0311–58 and the 3 mm continuum flux density were determined from an 84.2-114.9 GHz spectrum assembled from five separate tunings in ALMA band 3 under ALMA Cycle 3 project 2015.1.00504.S. The observing strategy has been used to discover the redshifts of more than 50 SPT dusty sources, and further details on the redshift coverage are provided
in previous works30, 31. Data were taken on 2015 December 28 and 2016 January 2 in ALMA
configuration C36-1 (baseline lengths of 15-310 meters) using 34 and 41 antennas, respectively.
The resulting image has a resolution of 3.3×3.500, though there is spatial information on somewhat
finer scales that allows us to separately estimate flux densities for the E and W sources, separated
by ∼200. Further details of the analysis are provided by Strandet et al.6.
ALMA observed SPT0311–58 a second time under 2015.1.00504.S in band 7 (LO = 343.48 GHz) to produce a continuum image suitable for gravitational lens modeling. Similar observations
were used to produce lens models of SPT sources in previous cycles24, 32. The observations were
performed with 41 antennas in the C40-4 configuration, providing 15–770 meter baselines. The
resulting image has an angular resolution of 0.3×0.500, though lacking any spectral lines it was
found to be insufficient to provide an unambiguous determination of the lensing configuration.
The ALMA Cycle 4 project 2016.1.01293.S was intended to follow up on the discovery
of this very distant source through spectroscopic observations. The 158 µm line of [CII] was
observed on 2016 November 3 in ALMA configuration C40-5, which provided baseline lengths of 18–1120 meters. This provides the primary imaging for this work, as it yielded an extremely
significant detection of the [CII] line and continuum structure at high resolution.
A final observation was obtained in ALMA band 8 (LO = 423.63 GHz), in configuration C40-4 (baselines 15–920 meters). The observations were repeated in four segments to yield the required
integration time. The resulting data have 0.2×0.300resolution. These data provide a final spatially-resolved continuum observation, at 90 µm rest-frame wavelength, along with spectroscopic images
of the 88 µm line of [OIII]. The ALMA continuum images are shown in Extended Data Fig. 1.
2 Spitzer Infrared Imaging
Infrared observations of SPT0311–58 were acquired with the Infrared Array Camera (IRAC)
instrument33 on the Spitzer Space Telescope as a part of Cycle 24 Hubble Space Telescope
pro-gram 14740 (PI: Marrone). The observations consisted of 95 dithered 100 s exposures on-source in both operable IRAC arrays at 3.6 and 4.5 µm. A large dither throw was used. The dataset thus had sufficiently high redundancy to support our standard reduction procedure, which involved constructing an object-masked median stack of all 95 exposures in each band, and then subtract-ing the median stack from the raw frames to compensate for bad pixels not automatically masked by the pipeline, and remove gradients in the background. After these initial preparatory steps,
the background-subtracted exposures were combined in the standard way34with IRACproc35 and
MOPEX to create mosaics having 0.600 pixels. The mosaics achieved an effective total
integra-tion time of about 9000 s after masking cosmic rays and other artifacts. Two flanking fields were covered to the same depth but separately, each in one IRAC passband.
Photometry was performed on the mosaics using Source Extractor36 (SE) in dual-image
mode after trimming to exclude the flanking fields and unexposed areas. The lens galaxy asso-ciated with SPT0311–58 was well detected with no evidence for saturation or even nonlinear de-tector behavior. During this process background and object images were generated and inspected to verify that SE performed as expected and generated valid photometry.
3 Hubble Space Telescope Imaging
SPT0311–58 was observed for 5 orbits of HST imaging with ACS and WFC3/IR in Cycle 24 (PID 14740; PI: Marrone) to determine the morphology of the foreground lens and better constrain the spectral energy distribution of both the lens and source. All observations were acquired on 30 April 2017. The ACS imaging consists of a single orbit divided between the F606W and F775W filters. Exposure times are 844 s and 1.5 ks, respectively. Four orbits of WFC3/IR observing was split evenly between the F125W and F160W filters. While the nominal exposure times are 5.6 ks, a subset of the data in both filters was compromised by significant contamination from scattered
earthlight. We reprocessed the imaging to remove contaminated data, resulting in final exposure times of 4.9ks in each band.
4 Gemini Optical/IR Imaging and Spectroscopy
With the Gemini Multi-Object Spectrograph37(GMOS) of Gemini-South, we obtained deep i and
z images of SPT0311–58 (Program: GS-2015B-Q-51, PI: Rotermund) on 2016 January 29 and 31.
The instrument consists of three 2048 x 4176 pixel CCDs, separated by two 6.4600(80 pixel) gaps,
with a scale of 0.080700 pixel−1. The field of view (FOV) of the GMOS camera is 5.50×5.50. Our
images were taken under photometric conditions and using a 2×2 binning, which gives a scale of
0.16100 pixel−1. The total integration times were 3600 s for i-band and 6600 s for z-band, with
average seeing conditions of 1.300 and 1.000 in i-band and z-band, respectively. The resulting 5σ
point source depths were iAB = 25.2 and zAB = 25.0.
SPT0311–58 was observed using the Facility Near-Infrared Wide-field Imager &
Multi-Object Spectrograph for Gemini (FLAMINGOS-2)38 at the Gemini-South Observatory on the
nights of UT 2016 September 23, and 2017 February 06, under Program GS-2016B-Q-68. The
instrument was used in imaging mode, with 0.18100 pixels, and yielding an unvignetted circular
field of view of ∼5.50 diameter. Our observing sequence for the survey consisted of a randomly
ordered dither pattern, with 1500 offsets about the pointing center. This pattern was repeated until
the required total exposure time was achieved. The individual Ks-band exposure time was set at
15 s in the first observation, and 10 s in the second observation, yielding a typical background
sky level in Ks of ∼10,000-12,000 counts (detector nonlinearity can be corrected to better than
1% up to 45,000 counts), ensuring that 2MASS stars with Ks > 13 do not saturate and can be
used for photometric calibration. The data were reduced using the python-based FLAMINGOS-2
Data Pipeline, FATBOY39, 40, created at the University of Florida. Briefly, a calibration dark was
subtracted from the data set, a flat field image and a bad pixel map were created, and the flat field was divided through the data. Sky subtraction was performed to remove small-scale structure with a subsequent low order correction for the large-scale structure. Finally, the data were aligned
and stacked. The seeing conditions averaged 0.700 in the final image comprising 44 minutes of
integration, reaching Ks,AB = 23.6 at 5σ.
Spectroscopy was obtained with the GMOS-S instrument on the nights of UT 2016 February
1 and 2 (Program: GS-2016B-Q-68, PI: Chapman) using the 100wide longslit at a position angle =
For a source that fills the 100slit this setup results in a spectral resolution of ∼ 7 ˚A. The observations
were spectrally dithered, using two central wavelength settings (8300 and 8400 ˚A) to cover the
chip gaps. The data comprise a series of individual 900s exposures, dithering the source spatially between two positions (“A” and “B”) along the slit in an ABBA pattern, repeated four times, two at each central wavelength setting. The total integration time is 4 hrs. A bright foreground object was positioned along the slit midway between the acquisition star and SPT0311–58, providing an additional reference point for locating traces along the slit.
The spectra were reduced, beginning with bias subtraction and bad pixel masking using the IRAF GMOS package provided by Gemini. The individual chips were combined into a single mo-saic for each exposure and the momo-saicked frames were then sky subtracted by differencing neigh-boring A–B exposure pairs; this method resulted in nearly Poisson noise even under the numerous bright sky lines. A flat-field slit illumination correction was applied and a wavelength calibra-tion derived for each mosaic. The 2-dimensional spectrum was created by median combining the individual exposure frames.
The spectrum shows a faint continuum beginning above 9000 ˚A at the location of SPT0311–
58. A one-dimensional extraction of the faint trace yields no reliable redshift measurement, but it
is consistent with the redshifted 4000 ˚A break that is expected for the foreground galaxy at z ∼ 1.4.
Calibrated against the nearby R=16.4 star spectrum we find no flux at the expected location of
Lyα redshifted to z = 6.900 (∼9600 ˚A) down to a 3σ flux limit of 3.0 × 10⁻¹⁷erg s−1 cm−2for a
500 km s−1wide emission line.
5 Image de-blending
At the position of SPT0311–58, our optical and infrared images (Extended Data Fig. 2) show a prominent lower-redshift galaxy responsible for lensing the western source, as well as direct stellar emission from the eastern source in the Hubble images (Extended Data Fig. 3), which have the highest resolution. To extract reliable photometry for SPT0311–58E, particularly in the low-resolution Spitzer images that cover the rest-frame optical, and to search for emission from W underneath the lens galaxy, we must model and remove the lens emission. We follow procedures
similar to those in past work41, using the HST/WFC3 images as the source of the lens galaxy model
to de-blend the IRAC image. The foreground lens can be fit with a single S´ersic profile with an index n = 1.77. As seen in Extended Data Fig. 4, there is no clear rest-frame ultraviolet emission from SPT0311–58W in the HST bands after removal of the lens model. To remove the lens from
the IRAC image, the WFC3 model is convolved with the IRAC point spread function and then subtracted from the 3.6 and 4.5 µm images. Residual emission is seen near the positions of both the eastern and western sources. Unfortunately, because SPT0311–58W lies right on top of the lens, the residuals are extremely susceptible to image deconvolution errors and we do not believe the Spitzer/IRAC fluxes to be reliable. In contrast SPT0311–58E is one full IRAC resolution
element, 1.700, from the lens centroid, and we consider the residual emission at this position to be
usable in our subsequent analyses. Images of the model and residuals are provided in Extended Data Fig. 4 and the resulting photometry is provided in Extended Data Table 2.
6 Gravitational Lens Modeling
Gravitational lens modeling of SPT0311–58 was performed using two different codes that model the source-plane emission in different ways. Both codes fit directly to the visibilities measured by ALMA or other interferometers to avoid the correlated noise between pixels in inverted images. In each, the lens galaxy is modeled as a singular isothermal ellipsoid, and posterior parameter distributions are sampled using a Markov Chain Monte Carlo technique, marginalizing over several sources of residual calibration uncertainty (e.g., antenna-based phase errors).
Initial lens models were created using the visilens code, which is described in detail
elsewhere24. The source plane is modeled as one or more elliptical S´ersic profiles. Because of
the simplicity of this source-plane representation, the code is able to sample large and complex parameter spaces quickly. The continuum emission at 160, 110, and 90 µm was modeled with four S´ersic components, one for the SPT0311–58E and three for W. These models leave ∼8σ peak residuals in the 160 and 90 µm data, which both reach peak signal-to-noise >150.
After determining the lens parameters using visilens, we used the best-fit values as initial
input to a pixellated reconstruction code12. This code represents the source plane as an array of
pixels, rather than an analytic model, and determines the most probable pixel intensity values for
each trial lens model while imposing a gradient-type regularization42to avoid over-fitting the data.
For each dataset, we fit for the strength of this regularization. At 160 and 90 µm we re-fit for the lens model parameters and compare to the visilens models as a test of the robustness of the lens modeling. Within each code, the best-fit lens parameters at the two independent wavelengths are consistent to <10%. Further, both the lens parameters and source structure are consistent between the two independent codes, with intrinsic source flux densities, sizes, and magnifications that agree to <15%. The increased freedom in the source plane afforded by the pixellated reconstruction
means that the lens parameters are not independently well-constrained by the 110 µm data, which have both lower signal-to-noise and spatial resolution. For these data, we simply apply the lensing deflections determined from the other two datasets to reconstruct the source-plane emission. The pixellated reconstructions of the three continuum wavelengths are shown in Extended Data Fig. 5.
The channelized [CII] line is also modeled using the same pixellated reconstruction
tech-nique, using 39 consecutive channels of 40 km/s width, each with a peak signal-to-noise ranging from 9–34. For each channel, we apply the lensing deflections from the best-fit model of the 160 µm data, which were observed simultaneously. We fit for the strength of the source-plane
regularization12, 42 at each channel, which varies across the line profile as some velocities
experi-ence higher magnification (e.g., those multiply imaged from -280 km/s to +80 km/s) than others
(e.g., the entire eastern source at >+560 km/s). The models of each [CII] channel are represented
in Extended Data Fig. 6.
We determine the source magnifications using the 90 µm pixellated model, in which the E source is detected at the highest signal-to-noise ratio and so the effects of varying the aperture used to measure the intrinsic flux density are minimized. Because the source-plane morphology is very similar between the three continuum wavelengths, the magnification is also essentially identical between them. We find flux-weighted, source-averaged magnifications for the eastern,
western, and the system as a whole of µE = 1.3, µW = 2.2, µtot = 2.0, respectively. These
magnifications are substantially lower than the median magnification of 5.5 within the sample of
47 SPT-discovered dusty galaxies24 for which we have data adequate to construct lens models or
conclude that sources are unlensed. In this case the low magnification is a consequence of the low
mass of the lensing halo, typically expressed as an “Einstein” radius, θE. The lens model for this
source indicates θE = 0.2900, which is around the 10thpercentile for SPT lensed sources24, and the
background source is both much larger than and offset from the regions of highest magnification. A large portion of the source is therefore only weakly magnified and the source-averaged values are low.
Finally, we also construct a lens model of the 95 GHz ALMA data (rest-frame 380 µm;
Extended Data Table 1). Because the spatial resolution of these data is low (3.500), we model
these data using only the visilens code, which is more suited for low-resolution data. We only allow the lens parameters and source structural parameters (e.g., position, radius) to vary within the ranges determined from the higher-resolution 160, 110, and 90 µm continuum data, leaving only the flux densities of the eastern and western objects as free parameters. This modeling indicates
that essentially all of the observed 380 µm emission can be ascribed to the western source, with the eastern source “detected” at ∼1σ.
In addition to the ALMA data, we use Herschel photometry reported previously6to constrain
the SED of SPT0311–58E and W to rest-frame 30 µm (250 µm observed). The resolution of
HerschelSPIRE is not adequate to separate the two components, so we divide the total flux density
observed in the three SPIRE bands between E and W according to the ratios observed in the ALMA bands. These photometric points are then corrected for the continuum magnification derived from the ALMA data and used in the SED modeling described below. The total and intrinsic flux densities are reported in Extended Data Table 3.
7 Modeling the Spectral Energy Distribution
Extended Data Fig. 7 presents the spectral energy distributions of SPT0311–58E, W, and the fore-ground lens galaxy.
A photometric redshift for the lens is calculated with EAZY43 using the data in Extended
Data Table 2. The resulting redshift is 1.43, with a 1σ confidence interval of 1.08−1.85. The lens
SED fitting is performed with the Code Investigating GALaxy Emission (CIGALE44, 45) assuming
z = 1.43.
The multiple rest-frame ultraviolet to rest-frame optical detections of SPT0311–58E allow us to constrain the stellar mass using reasonable assumptions about the star formation history at this early point in cosmic history. The SED is fit by varying the e-folding time and age from a
pre-viously reported stellar population model46under single- and two-component formation histories,
assuming solar metallicity and using a previously reported47 initial mass function. The minimum
radiation field, power-law slope, and gamma, the fraction of dust mass exposed to radiation
in-tensities above the minimum, from one dust model48, and the color excess and attenuation slope
from other dust models49, 50 are kept free in the SED fitting. The AGN contribution is set to zero
as there are no photometric points to constrain the spectral range most affected by AGN power (mid-infrared) and thus any fraction between 0 and 60% of the dust luminosity is attributable to AGN with nearly equal probability. However, this ignores the spatial distributions of the dust and line emission, which are not strongly peaked as is usually observed in AGN-dominated galaxies, so we deem this wide range to be unphysical. The inferred stellar mass and star formation rates are
history. These answers agree within the uncertainties for a single-component star formation
his-tory. The infrared luminosity (LIR, integrated from 8–1000 µm) is (4.6 ± 1.2) × 1012L and the
extinction is AV = 2.7 ± 0.2 mag.
For the western source, we have only upper limits and the potentially-contaminated IRAC detections to constrain the rest-frame optical/ultraviolet emission. Accordingly, we use the IRAC photometry as upper limits, along with the HST limits and far-infrared data in Extended Data
Table 3, and model the SED with CIGALE. We find a luminosity of LIR = (33 ± 7) × 1012 L ,
seven times larger than for the eastern source. A consistent luminosity is obtained by fitting the
FIR SED with a modified blackbody51. The inferred star formation rate, which is closely connected
to LIR, is 2900±1800 M yr−1. Just as for the eastern source, the SED allows the AGN fraction
to fall between 0 and 60% at roughly equal probability, so we take the absence of a dominant IR emission region (see Fig.s 1(c) and 5) as an indication that the AGN contribution is unlikely to be important and fix the AGN fraction to zero. The dust luminosity due to star formation could therefore in principle be up to a factor of two smaller if the spatial distribution of the emission is ignored. Given that the photometry reaches only to rest-frame V band, it remains possible to hide a
very large stellar mass behind plausible values for the extinction (AV ≤ 6, as seen in other massive
dusty galaxies14, 16, 52, 53). Considering the IRAC flux densities alone, we can calculate simple
rest-frame mass-to-light ratios for the observed bands to see what masses could exist without relying
on the poorly-constrained CIGALE SED modeling. We use a stellar population synthesis code54, 55
to compute a stellar mass-to-light ratio under a range of assumptions: stellar ages of 0.1–0.8 Gyr (from a reasonably “young” population to the approximate age of the universe at the time) and
metallicity of 0.1–1 Z , with no dust attenuation. The mass then ranges from (2 − 10) × 1010M
per µJy of measured flux density. Taking the measured and demagnified flux density (averaged
between the two wavelengths) of 0.5 µJy, we find a stellar mass of (1 − 5) × 1010 M before
correcting for extinction. If the extinction is as large as 5 magnitudes, the true stellar mass could be
unphysically large (> 1012M ), demonstrating that we have no useful constraint without greater
certainty about the reliability of the IRAC flux densities and/or more photometric data points.
8 Galaxy and Halo Masses
Figures 2 and 3 compile mass measurements for high-redshift galaxies discovered by various tech-niques. The galaxy sample primarily comprises galaxies identified through their luminous dust emission (DSFGs) and optically-identified quasars, which are typically the objects with the largest gas, dust, or stellar masses at these redshifts. At the very highest redshifts, where very few galaxies
have been found, objects selected based on their ultraviolet emission are also included. The subsets of galaxies included in each figure overlap significantly but are not identical because not all of the requisite information is available for each source.
Dust Mass: Mass estimates are literature values unmodified from the original publications4, 15, 56–62
owing to the heterogeneity of the data available across the sample. The dust masses are generally derived from the FIR continuum emission, using one to several wavelengths. Differences between the cosmology assumed in this work and the past publications result in unimportant corrections and are ignored.
Gas Mass: Following standard observational practice, the primary source for gas masses4, 27, 56–58, 61, 63–67
shown in Fig. 2(b) is measurement of the luminosity of rotational transitions of CO. The lowest available rotational transition is typically used and any translation between the observed transition and the J = 1 − 0 line that is most commonly used as a molecular gas indicator is taken from the original source. Rather than accepting the varying coefficients for the conversion of CO luminosity
to gas mass, we re-calculate all masses using a common value of αCO = 1.0 M (K km s−1pc2)
−1
,
which is a typical value for actively star-forming galaxies68, 69. For one source the gas mass is
estimated through the star-formation surface density59.
Halo Mass: The halo masses of Fig. 3 are derived from the gas mass sample above. Each dark matter halo mass is represented using a range of values, starting with a conservative and
hard lower limit found by dividing the measured gas mass by the universal baryon fraction10,
fb = 0.19. This lower limit ignores any baryonic mass that has been converted into stars and/or
hot or cool atomic gas phases, which would increase the inferred halo mass. A more realistic, but still conservative, lower limit is represented by the top of the plotted symbols. Here we assume
that the ratio of baryonic mass to halo mass is Mb/Mhalo = 0.05. This value is a factor of ∼ 4
less than the universal baryon fraction but still higher than the typical stellar-to-halo mass ratio
inferred for halos of any mass and redshift via subhalo abundance matching3. Given that we do
not expect high-mass galaxies such as SPT0311–58 to expel a large fraction of their molecular gas
content70 or to later accrete dark matter without also accreting gas in proportion to the universal
baryon fraction, it is reasonable to expect that the baryon-to-halo mass ratio should be less than this inferred upper limit on the stellar-to-halo mass ratio across all masses and redshifts.
HFLS3 and SPT0311–58 Masses: In the case of the two most distant DSFGs, HFLS34 and
we also compute the gas mass using a joint continuum/line radiative transfer model described in Refs. 29 and 6. The mass for SPT0311–58 was computed in Ref. 6 without spatially-resolved (CO
and [CI]) line emission. For the purposes of Fig. 3 only the total gas mass of the two SPT0311–58
galaxies is important for estimating the halo mass. For Fig. 2 the dust mass is divided between the two sources according to the ratio of dust continuum emission in our resolved observations. The gas mass is similarly divided, though the velocity profile of the CO lines provides weak evidence that the molecular gas is concentrated in SPT0311–58W, which would increase the gas mass for this source by 15%.
9 Calculation of Halo Rareness
Figure 3 demonstrates the “rareness” of SPT0311–58 by considering its position in the dark mat-ter halo mass-redshift plane compared with other extreme high-redshift objects (DSFGs, quasars, and an LBG) believed to be hosted by massive dark matter halos. To quantify the rareness of
these extreme objects we employ the method of Ref. 28, adopting theirMATLABscript available at
https://bitbucket.org/itrharrison/hh13-cluster-rarenessand modified slightly
to extend the calculation to z = 10. These authors describe how to properly compute (z, Mhalo)
contours (“exclusion curves”) above which the Poisson probability of such an object being detected in the standard ΛCDM cosmology is less than α (α < 1); the existence of a single object above such an exclusion curve is sufficient to rule out ΛCDM at the 100(1 − α)% confidence level. In Fig. 3, we plot 1σ exclusion curves (i.e., α = 0.32). Of the three different statistical measures of rareness that they propose, we employ the ‘> ν’ measure, which quantifies the rareness according
to the minimum height of the primordial density perturbation from which a halo of mass Mhalo
and redshift z could have formed, ν(Mhalo, z) ∝ (D+(z)σ(Mhalo))−1, where D+(z) is the
normal-ized linear growth function and σ2(Mhalo) is the variance of the matter power spectrum smoothed
on the comoving spatial scale that corresponds to the mass Mhalo. This statistic is sensitive to
changes in the ΛCDM initial conditions, such as primordial non-Gaussianity (which would lead to more high-mass dark matter halos at a given redshift than expected in the standard ΛCDM
cos-mology). For the purposes of this calculation, we assume a ΛCDM cosmology with parameters10
(Ωm= 0.309, ΩΛ= 0.691, h0 = 0.677, σ8 = 0.816) and employ the halo mass function of Ref. 71.
The > ν rareness statistic (and the corresponding exclusion curves) depends on the
re-gion of the Mhalo − z plane to which the survey is sensitive. We assume that the SPT
sam-ple of lensed DSFGs is comsam-plete for z > 1.5. At lower redshift, the probability of lensing
Mhalo & 1015M (the Mhalo value of the exclusion curves for z = 1.5) would have to have a
very high intrinsic (i.e., unlensed) mm flux density (S1.4 & 20 mJy) to be included in the
sam-ple. Because of the effects of “downsizing” (i.e., star formation is terminated at higher redshift in higher-mass galaxies than in lower-mass galaxies), it is unlikely that massive galaxies at z < 1.5
would have sufficiently high IR luminosity to be detected by the SPT73. We furthermore assume
that the survey is complete for Mhalo > 1011M . The assumption that the sample is complete to
Mhalo = 1011M is a conservative one because the galaxies hosted by such halos, which would
have Mb 1010M , are unlikely to be sufficiently luminous to be detected without being very
strongly lensed (µ & 10); erring on the side of overestimating the completeness yields a lower
limit on the rareness. Substituting a minimum halo mass of, e.g., 1012 M would make the value
of the > ν rareness statistic less than found for 1011 M , i.e., SPT0311–58 would be inferred to
be even rarer.
The total area from which the SPT DSFG sample was selected is 2500 deg2. However, the
fact that most of the SPT DSFGs are strongly lensed implies that the effective survey area is
poten-tially much less than 2500 deg2 because not only must a galaxy have a high intrinsic mm flux
den-sity to be included in the sample but also it must be gravitationally lensed by some factor in order to
exceed the S1.4 mm' 20 mJy threshold for inclusion in redshift followup observations. Properly
ac-counting for the effects of lensing on the sample completeness would require defining an effective
survey area as a function of halo mass and redshift, Aeff(Mhalo, z) = 2500 deg2P (µmin|Mhalo, z),
where P (µ|Mhalo, z) is the probability of a galaxy hosted by a halo of mass Mhaloat redshift z
be-ing lensed by a factor µmin, the minimum magnification necessary for which a halo of mass Mhalo
and redshift z would be detectable. However, given the large uncertainties in determining such a function, we opt for a simpler approach. Instead, in Fig. 3, we plot exclusion curves for the full
sky (dotted line); an area of 2500 deg2 (dashed line), which corresponds to the assumption that
all halos in the mass and redshift range specified above would be detected even if they were not
lensed; and an area of 25 deg2 (solid line), which corresponds to the assumption that the survey
area corresponds to just the ∼ 1% of the SPT fields over which the magnification for sources at
z & 1.5 will be at least30, 72 µ = 2, like SPT0311–58.
Code Availability The lensing reconstruction for the ALMA data was initially performed with the visilens code available at https://github.com/jspilker/visilens. Pixelated re-constructions were performed using a proprietary code developed by a subset of the authors and additional non-authors, and we opt not to release this code in connection with this work. The rareness calculation was performed with publicly available code (https://bitbucket.org/
itrharrison/hh13-cluster-rareness). The image deblending for the Spitzer images used GALFIT (https://users.obs.carnegiescience.edu/peng/work/galfit/ galfit.html). The SED modeling used the CIGALE code (https://cigale.lam.fr/), version 0.11.0. The photometric redshift of the lens galaxy was estimated with EAZY (https: //github.com/gbrammer/eazy-photoz).
Data Availability This paper makes use of the following ALMA data: ADS/JAO.ALMA#2016.1.01293.S and ADS/JAO.ALMA#2015.1.00504.S, available at http://almascience.org/aq?project code=2015.1.00504.S and http://almascience.org/aq?project code=2016.1.01293.S. The HST data are available online at
the Mikulski Archive for Space Telescopes (MAST; https://archive.stsci.edu) under proposal ID 14740. Datasets analysed here are available from the corresponding author on reasonable request. 1. Springel, V. et al. Simulations of the formation, evolution and clustering of galaxies and
quasars. Nature 435, 629–636 (2005).
2. Cole, S., Helly, J., Frenk, C. S. & Parkinson, H. The statistical properties of Λ cold dark matter halo formation. Mon. Not. R. Atron. Soc. 383, 546–556 (2008).
3. Behroozi, P. S., Wechsler, R. H. & Conroy, C. The Average Star Formation Histories of Galaxies in Dark Matter Halos from z = 0-8. Astrophys. J. 770, 57 (2013).
4. Riechers, D. A. et al. A dust-obscured massive maximum-starburst galaxy at a redshift of 6.34. Nature 496, 329–333 (2013).
5. Vieira, J. D. et al. Dusty starburst galaxies in the early Universe as revealed by gravitational lensing. Nature 495, 344–347 (2013).
6. Strandet, M. L. et al. ISM Properties of a Massive Dusty Star-forming Galaxy Discovered at z ∼ 7. Astrophys. J. Lett. 842, L15 (2017).
7. Cormier, D. et al. The Herschel Dwarf Galaxy Survey. I. Properties of the low-metallicity ISM from PACS spectroscopy. Astron. Astrophys. 578, A53 (2015).
8. Carlstrom, J. E. et al. The 10 Meter South Pole Telescope. Pub. Astron. Soc. Pac. 123, 568–581 (2011).
9. Mocanu, L. M. et al. Extragalactic Millimeter-wave Point-source Catalog, Number Counts
10. Planck Collaboration et al. Planck 2015 results. XIII. Cosmological parameters. Astron.
Astrophys.594, A13 (2016).
11. Casey, C. M., Narayanan, D. & Cooray, A. Dusty star-forming galaxies at high redshift. Phys.
Rep.541, 45–161 (2014).
12. Hezaveh, Y. D. et al. Detection of Lensing Substructure Using ALMA Observations of the Dusty Galaxy SDP.81. Astrophys. J. 823, 37 (2016).
13. Mihos, J. C. & Hernquist, L. Gasdynamics and Starbursts in Major Mergers. Astrophys. J. 464, 641 (1996).
14. Cooray, A. et al. HerMES: The Rest-frame UV Emission and a Lensing Model for the z = 6.34 Luminous Dusty Starburst Galaxy HFLS3. Astrophys. J. 790, 40 (2014).
15. Decarli, R. et al. Rapidly star-forming galaxies adjacent to quasars at redshifts exceeding 6.
Nature545, 457–461 (2017).
16. Casey, C. M. et al. Near-infrared MOSFIRE Spectra of Dusty Star-forming Galaxies at 0.2 < z < 4. Astrophys. J. 840, 101 (2017).
17. Bouwens, R. J. et al. UV Luminosity Functions at Redshifts z∼4 to z∼10: 10,000 Galaxies from HST Legacy Fields. Astrophys. J. 803, 34 (2015).
18. Ferkinhoff, C. et al. First Detection of the [O III] 88 µm Line at High Redshifts: Characterizing the Starburst and Narrow-line Regions in Extreme Luminosity Systems. Astrophys. J. Lett. 714, L147–L151 (2010).
19. Brauher, J. R., Dale, D. A. & Helou, G. A Compendium of Far-Infrared Line and Continuum Emission for 227 Galaxies Observed by the Infrared Space Observatory. Astrophys. J. Suppl. 178, 280–301 (2008).
20. Inoue, A. K. et al. Detection of an oxygen emission line from a high-redshift galaxy in the reionization epoch. Science 352, 1559–1562 (2016).
21. Lebouteiller, V. et al. Physical conditions in the gas phases of the giant H II region LMC-N 11 unveiled by Herschel . I. Diffuse [C II] and [O III] emission in LMC-LMC-N 11B. Astron.
Astrophys.548, A91 (2012).
22. D´ıaz-Santos, T. et al. Explaining the [C II]157.7 µm Deficit in Luminous Infrared Galaxies – First Results from a Herschel/PACS Study of the GOALS Sample. Astrophys. J. 774, 68 (2013).
23. Oteo, I. et al. Witnessing the Birth of the Red Sequence: ALMA High-resolution Imaging of [C II] and Dust in Two Interacting Ultra-red Starbursts at z = 4.425. Astrophys. J. 827, 34 (2016).
24. Spilker, J. S. et al. ALMA Imaging and Gravitational Lens Models of South Pole Telescope– Selected Dusty, Star-Forming Galaxies at High Redshifts. Astrophys. J. 826, 112 (2016).
25. Bolatto, A. D., Wolfire, M. & Leroy, A. K. The CO-to-H2 Conversion Factor. Ann. Rev.
Astron. Astrophys.51, 207–268 (2013).
26. Bothwell, M. S. et al. A survey of molecular gas in luminous sub-millimetre galaxies. Mon.
Not. R. Atron. Soc.429, 3047–3067 (2013).
27. Aravena, M. et al. A survey of the cold molecular gas in gravitationally lensed star-forming galaxies at z 2. Mon. Not. R. Atron. Soc. 457, 4406–4420 (2016).
28. Harrison, I. & Hotchkiss, S. A consistent approach to falsifying ΛCDM with rare galaxy clusters. J. Cosmology Astropart. Phys. 7, 022 (2013).
29. Weiß, A. et al. Highly-excited CO emission in APM 08279+5255 at z = 3.9. Astron. Astrophys. 467, 955–969 (2007).
30. Weiß, A. et al. ALMA Redshifts of Millimeter-selected Galaxies from the SPT Survey: The Redshift Distribution of Dusty Star-forming Galaxies. Astrophys. J. 767, 88 (2013).
31. Strandet, M. L. et al. The Redshift Distribution of Dusty Star-forming Galaxies from the SPT Survey. Astrophys. J. 822, 80 (2016).
32. Hezaveh, Y. D. et al. ALMA Observations of SPT-discovered, Strongly Lensed, Dusty, Star-forming Galaxies. Astrophys. J. 767, 132 (2013).
33. Fazio, G. G. et al. The Infrared Array Camera (IRAC) for the Spitzer Space Telescope.
Astro-phys. J. Suppl.154, 10–17 (2004).
34. Ashby, M. L. N. et al. SEDS: The Spitzer Extended Deep Survey. Survey Design, Photometry, and Deep IRAC Source Counts. Astrophys. J. 769, 80 (2013).
35. Schuster, M. T., Marengo, M. & Patten, B. M. IRACproc: a software suite for processing and analyzing Spitzer/IRAC data. In Society of Photo-Optical Instrumentation Engineers (SPIE) Conference Series, vol. 6270 of Society of Photo-Optical Instrumentation Engineers (SPIE)
36. Bertin, E. & Arnouts, S. SExtractor: Software for source extraction. Astron. Astrophys. Suppl. 117, 393–404 (1996).
37. Hook, I. M. et al. The Gemini-North Multi-Object Spectrograph: Performance in Imag-ing, Long-Slit, and Multi-Object Spectroscopic Modes. Pub. Astron. Soc. Pac. 116, 425–440 (2004).
38. Eikenberry, S. et al. FLAMINGOS-2: the facility near-infrared wide-field imager and multi-object spectrograph for Gemini. In Ground-based and Airborne Instrumentation for Astron-omy IV, vol. 8446 of Proc. SPIE, 84460I (2012).
39. Warner, C., Packham, C., Eikenberry, S. S. & Gonzalez, A. GPUs and Python: A Recipe for Lightning-Fast Data Pipelines. In Ballester, P., Egret, D. & Lorente, N. P. F. (eds.) Astronom-ical Data Analysis Software and Systems XXI, vol. 461 of AstronomAstronom-ical Society of the Pacific Conference Series, 53 (2012).
40. Warner, C., Eikenberry, S. S., Gonzalez, A. H. & Packham, C. Redefining the Data Pipeline Using GPUs. In Friedel, D. N. (ed.) Astronomical Data Analysis Software and Systems XXII, vol. 475 of Astronomical Society of the Pacific Conference Series, 79 (2013).
41. Ma, J. et al. Stellar Masses and Star Formation Rates of Lensed, Dusty, Star-forming Galaxies from the SPT Survey. Astrophys. J. 812, 88 (2015).
42. Suyu, S. H., Marshall, P. J., Hobson, M. P. & Blandford, R. D. A Bayesian analysis of regularized source inversions in gravitational lensing. Mon. Not. R. Atron. Soc. 371, 983–998 (2006).
43. Brammer, G. B., van Dokkum, P. G. & Coppi, P. EAZY: A Fast, Public Photometric Redshift Code. Astrophys. J. 686, 1503–1513 (2008).
44. Burgarella, D., Buat, V. & Iglesias-P´aramo, J. Star formation and dust attenuation properties in galaxies from a statistical ultraviolet-to-far-infrared analysis. Mon. Not. R. Atron. Soc. 360, 1413–1425 (2005).
45. Noll, S. et al. Analysis of galaxy spectral energy distributions from far-UV to far-IR with CIGALE: studying a SINGS test sample. Astron. Astrophys. 507, 1793–1813 (2009).
46. Bruzual, G. & Charlot, S. Stellar population synthesis at the resolution of 2003. Mon. Not. R.
47. Chabrier, G. Galactic Stellar and Substellar Initial Mass Function. Pub. Astron. Soc. Pac. 115, 763–795 (2003).
48. Draine, B. T. & Li, A. Infrared Emission from Interstellar Dust. IV. The Silicate-Graphite-PAH Model in the Post-Spitzer Era. Astrophys. J. 657, 810–837 (2007).
49. Calzetti, D. et al. The Dust Content and Opacity of Actively Star-forming Galaxies. Astrophys.
J.533, 682–695 (2000).
50. Leitherer, C., Li, I.-H., Calzetti, D. & Heckman, T. M. Global Far-Ultraviolet (912-1800 ˚A)
Properties of Star-forming Galaxies. Astrophys. J. Suppl. 140, 303–329 (2002).
51. Blain, A. W., Barnard, V. E. & Chapman, S. C. Submillimetre and far-infrared spectral energy distributions of galaxies: the luminosity-temperature relation and consequences for photomet-ric redshifts. Mon. Not. R. Atron. Soc. 338, 733–744 (2003).
52. Hopwood, R. et al. Spitzer Imaging of Herschel-atlas Gravitationally Lensed Submillimeter Sources. Astrophys. J. Lett. 728, L4 (2011).
53. Lo Faro, B. et al. The Complex Physics of Dusty Star-forming Galaxies at High Redshifts as Revealed by Herschel and Spitzer. Astrophys. J. 762, 108 (2013).
54. Conroy, C., Gunn, J. E. & White, M. The Propagation of Uncertainties in Stellar Population Synthesis Modeling. I. The Relevance of Uncertain Aspects of Stellar Evolution and the Initial Mass Function to the Derived Physical Properties of Galaxies. Astrophys. J. 699, 486–506 (2009).
55. Conroy, C. & Gunn, J. E. The Propagation of Uncertainties in Stellar Population Synthesis Modeling. III. Model Calibration, Comparison, and Evaluation. Astrophys. J. 712, 833–857 (2010).
56. Wang, R. et al. CO (2-1) Line Emission in Redshift 6 Quasar Host Galaxies. Astrophys. J.
Lett.739, L34 (2011).
57. Wang, R. et al. Far-infrared and Molecular CO Emission from the Host Galaxies of Faint Quasars at z ˜ 6. Astron. J. 142, 101 (2011).
58. Walter, F. et al. The intense starburst HDF 850.1 in a galaxy overdensity at z ≈ 5.2 in the Hubble Deep Field. Nature 486, 233–236 (2012).
59. Watson, D. et al. A dusty, normal galaxy in the epoch of reionization. Nature 519, 327–330 (2015).
60. Venemans, B. P. et al. Bright [C ii] and Dust Emission in Three z > 6.6 Quasar Host Galaxies Observed by ALMA. Astrophys. J. 816, 37 (2016).
61. Venemans, B. et al. The compact, ˜1 kpc host galaxy of a quasar at z=7.1. ArXiv e-prints (2017).
62. Laporte, N. et al. Dust in the Reionization Era: ALMA Observations of a z=8.38 Gravitation-ally Lensed Galaxy. Astrophys. J. Lett. 837, L21 (2017).
63. Walter, F. et al. Molecular gas in the host galaxy of a quasar at redshift z = 6.42. Nature 424, 406–408 (2003).
64. Riechers, D. A. et al. A Massive Molecular Gas Reservoir in the z = 5.3 Submillimeter Galaxy AzTEC-3. Astrophys. J. Lett. 720, L131–L136 (2010).
65. Wang, R. et al. Molecular Gas in z ˜ 6 Quasar Host Galaxies. Astrophys. J. 714, 699–712 (2010).
66. Wang, R. et al. Star Formation and Gas Kinematics of Quasar Host Galaxies at z ˜ 6: New Insights from ALMA. Astrophys. J. 773, 44 (2013).
67. Rawle, T. D. et al. [C II] and 12CO(1-0) Emission Maps in HLSJ091828.6+514223: A
Strongly Lensed Interacting System at z = 5.24. Astrophys. J. 783, 59 (2014).
68. Solomon, P. M. & Vanden Bout, P. A. Molecular Gas at High Redshift. Ann. Rev. Astron.
Astrophys.43, 677–725 (2005).
69. Carilli, C. L. & Walter, F. Cool Gas in High-Redshift Galaxies. Ann. Rev. Astron. Astrophys. 51, 105–161 (2013).
70. Hayward, C. C. & Hopkins, P. F. How stellar feedback simultaneously regulates star formation and drives outflows. Mon. Not. R. Atron. Soc. 465, 1682–1698 (2017).
71. Tinker, J. et al. Toward a Halo Mass Function for Precision Cosmology: The Limits of Uni-versality. Astrophys. J. 688, 709–728 (2008).
72. Hezaveh, Y. D. & Holder, G. P. Effects of Strong Gravitational Lensing on Millimeter-wave Galaxy Number Counts. Astrophys. J. 734, 52–59 (2011).
73. Miller, T. B., Hayward, C. C., Chapman, S. C. & Behroozi, P. S. The bias of the submillimetre galaxy population: SMGs are poor tracers of the most-massive structures in the z ∼ 2 Universe.
Mon. Not. R. Atron. Soc.452, 878–883 (2015).
Acknowledgements ALMA is a partnership of ESO (representing its member states), NSF (USA) and NINS (Japan), together with NRC (Canada) and NSC and ASIAA (Taiwan), in cooperation with the Re-public of Chile. The Joint ALMA Observatory is operated by ESO, AUI/NRAO and NAOJ. This work incorporates observations with the NASA/ESA Hubble Space Telescope, obtained at the Space Telescope Science Institute (STScI) operated by AURA, Inc. This work is also based in part on observations made with the Spitzer Space Telescope, which is operated by the Jet Propulsion Laboratory, California Institute of Technology under a contract with NASA. The SPT is supported by the National Science Foundation through grant PLR-1248097, with partial support through PHY-1125897, the Kavli Foundation and the Gor-don and Betty Moore Foundation grant GBMF 947. Supporting observations were obtained at the Gemini Observatory, which is operated by the Association of Universities for Research in Astronomy, Inc., under a cooperative agreement with the NSF on behalf of the Gemini partnership: the National Science Founda-tion (United States), the NaFounda-tional Research Council (Canada), CONICYT (Chile), Ministerio de Ciencia, Tecnolog´ıa e Innovaci´on Productiva (Argentina), and Minist´erio da Ciˆencia, Tecnologia e Inovac¸˜ao (Brazil). D.P.M., J.S.S., J.D.V., K.C.L., and J.S. acknowledge support from the U.S. National Science Foundation under grant AST-1312950. D.P.M. was also partially supported by NASA through grant HST-GO-14740 from the Space Telescope Science Institute and K.C.L. was partially supported by SOSPA4-007 from the National Radio Astronomy Observatory. The Flatiron Institute is supported by the Simons Foundation. J.D.V. acknowledges support from an A. P. Sloan Foundation Fellowship.
Author Contributions D.P.M. proposed the ALMA [CII] and [OIII] line observations and analyzed all ALMA data. J.S.S. performed the lens modeling. C.C.H. led the rareness analysis. M.L.N.A., M.B.B., S.C.C, A.H.G, J.M., K.M.R., and B.S. provided optical/infrared data reduction and deconvolution. K.A.P. and J.D.V. performed SED modeling of the sources and lens. A.W. performed joint dust/line modeling of high-redshift targets. D.P.M. wrote the manuscript. J.S.S., C.C.H., D.P.M., S.L., K.A.P., and J.D.V. prepared the figures. All authors discussed the results and provided comments on the paper. The authors are ordered alphabetically after J.D.V.
Author Information Reprints and permissions information is available at www.nature.com/reprints. The authors declare no competing financial interests. Readers are welcome to comment on the online version of the paper. Publishers note: Springer Nature remains neutral with regard to jurisdictional claims in pub-lished maps and institutional affiliations. Correspondence and requests for materials should be addressed to D.P.M. (dmarrone@email.arizona.edu).
Extended Data Table 1 |ALMA Observations
Date Frequencya Antennas Resolution Flux Phase PWVb tc
int Noise Level d (GHz) (arcsec) Calibrator Calibrator (mm) (min) (µJy/beam)
B3 3.3×3.5 35 2016-Jan-02 91.95 41 3.8×3.9 Uranus J0303-6211 1.8 1.2 65 2015-Dec-28 95.69 34 3.2×3.5 Uranus J0309-6058 2.9 1.2 83 2015-Dec-28 99.44 34 3.1×3.4 Uranus J0309-6058 2.8 1.2 77 2015-Dec-28 103.19 34 3.0×3.4 Uranus J0309-6058 2.7 1.5 72 2015-Dec-28 106.94 34 2.9×3.3 Uranus J0309-6058 2.8 1.0 95 B6 2016-Nov-03 233.65 45 0.25×0.30 J0334-4008 J0303-6211 0.5 32.4 24 B7 2016-Jun-04 343.48 41 0.31×0.49 J2258-2758 J0303-6211 0.8 6.5 12 B8 0.20×0.30 53 2016-Nov-15 423.63 41 J0538-4405 J0253-5441 0.8 11.4 2016-Nov-16 423.63 42 J0538-4405 J0253-5441 0.5 33.7 2016-Nov-16 423.63 42 J0538-4405 J0253-5441 0.4 33.7 2016-Nov-17 423.63 43 J0538-4405 J0253-5441 0.3 33.7
aFirst local oscillator frequency bPrecipitable water vapor at zenith cOn-source integration time dRoot-mean-square noise level in 7.5 GHz continuum image
Extended Data Table 2 |Optical/IR Photometry
Telescope Instrument/Filter Lens SPT0311–58E SPT0311–58W HST ACS/F606W >27.05 >28.11 >27.08 HST ACS/F775W >26.55 >27.59 >26.63 Gemini GMOS/i0 25.00±0.20 Gemini GMOS/z0 24.40±0.20 HST WFC3/F125W 23.06±0.16 25.28±0.10 >26.69 HST WFC3/F160W 22.76±0.15 24.98±0.12 >27.11 Gemini FLAMINGOS/Ks2.16 µm 22.42±0.13 ... ... Spitzer IRAC/Ch1 3.6 µm 21.40±0.14 24.47±0.30 (23.87±0.28) Spitzer IRAC/Ch2 4.5 µm 21.63±0.13 24.45±0.25 (23.63±0.22)
All data in apparent (i.e., not corrected for magnification) AB magnitudes. Limiting magnitudes reported as 1σ values. The magnification estimates for the E and W sources are 1.3 and 2.1, respectively, as reported in Methods Section 6. IRAC photometry
for SPT0311–58W is uncertain due to blending with the lens, as noted in Methods Section 5.
Extended Data Table 3 |Far-Infrared Photometry
Telescope Observed Wavelength Sν(east intrinsic) Sν(west intrinsic) Sν(total apparent) Herschel/SPIREa 250 µm 1.9±0.6 12.7±4.2 29.0 ± 8.0 Herschel/SPIREa 350 µm 2.5±0.5 16.6±2.9 38.0 ± 6.0 Herschel/SPIREa 500 µm 3.5±0.6 22.7±4.2 52.0 ± 8.0 ALMA/B8 710 µm 3.1 ± 0.2 19.9 ± 0.3 ALMA/B7 869 µm 2.9 ± 0.2 15.9 ± 0.25 ALMA/B6 1.26 mm 1.18 ± 0.05 9.77 ± 0.15 ALMA/B3 3 mm 0.040 ± 0.028 0.76 ± 0.02
Flux densities (Sν) in mJy.
![Figure 1 | Continuum, [C II ], and [O III ] emission from SPT0311–58 and the inferred source-plane structure](https://thumb-eu.123doks.com/thumbv2/123doknet/13262464.396832/8.918.105.813.118.515/figure-continuum-iii-emission-inferred-source-plane-structure.webp)