Analyzing the Effect of Air Capacitor Turbocharging
Single Cylinder Engines on Fuel Economy and
Emissions Through Modeling and Experimentation
The MIT Faculty has made this article openly available.
Please share
how this access benefits you. Your story matters.
Citation
Buchman, Michael R., W. Brett Johnson, and Amos G. Winter.
“Analyzing the Effect of Air Capacitor Turbocharging Single Cylinder
Engines on Fuel Economy and Emissions Through Modeling and
Experimentation.” Volume 3: 20th International Conference on
Advanced Vehicle Technologies; 15th International Conference on
Design Education (August 26, 2018).
As Published
http://dx.doi.org/10.1115/DETC2018-85934
Publisher
American Society of Mechanical Engineers
Version
Final published version
Citable link
http://hdl.handle.net/1721.1/120858
Terms of Use
Article is made available in accordance with the publisher's
policy and may be subject to US copyright law. Please refer to the
publisher's site for terms of use.
ANALYZING THE EFFECT OF AIR CAPACITOR TURBOCHARGING SINGLE
CYLINDER ENGINES ON FUEL ECONOMY AND EMISSIONS THROUGH
MODELING AND EXPERIMENTATION
Michael R. Buchman
Global Engineering and Research Lab Department of Mechanical Engineering Massachusetts Institute of Technology
Cambridge, Massachusetts 02139 Email: mbuchman@mit.edu
W. Brett Johnson
Global Engineering and Research Lab Department of Mechanical Engineering Massachusetts Institute of Technology
Cambridge, Massachusetts 02139 Email: wbj@mit.edu
Amos G. Winter, V
Global Engineering and Research Lab Department of Mechanical Engineering Massachusetts Institute of Technology
Cambridge, Massachusetts 02139 Email: awinter@MIT.EDU
ABSTRACT
Turbocharging can provide a cost effective means for in-creasing the power output and fuel economy of an internal com-bustion engine. A turbocharger added to an internal comcom-bustion engine consists of a coupled turbine and compressor. Currently, turbocharging is common in multi-cylinder engines, but it is not commonly used on single-cylinder engines due to the phase mis-match between the exhaust stroke (when the turbocharger is pow-ered) and the intake stroke (when the engine intakes the com-pressed air). The proposed method adds an air capacitor, an ad-ditional volume in series with the intake manifold, between the turbocharger compressor and the engine intake, to buffer the out-put from the turbocharger compressor and deliver pressurized air during the intake stroke. This research builds on previous work where it was shown experimentally that a power gain of 29% was achievable and that analytically a power gain of 40-60% was pos-sible using a turbocharger and air capacitor system.
The goal of this study is to further analyze the commercial viability of this technology by analyzing the effect of air
capac-itor turbocharging on emissions, fuel economy, and power den-sity. An experiment was built and conducted that looked at how air capacitor sizing affected emissions, fuel economy, and the equivalence ratio. The experimental data was then used to cali-brate a computational model built in Ricardo Wave. Finally this model was used to evaluate strategies to further improve the per-formance of a single cylinder diesel turbocharged engine with an air capacitor.
INTRODUCTION
The goal of this study is to analyze the commercial viabil-ity of single cylinder turbocharging technology by understanding how adding air capacitors to the intake stream affects emissions, fuel economy, and power density. Turbocharging engines is a cost effective way to increase the performance of multi-cylinder diesel engines by boosting power output, increasing fuel effi-ciency, and improving emissions quality [1, 2].
Turbocharging could also have many useful applications for Proceedings of the ASME 2018 International Design Engineering Technical Conferences and Computers and Information in Engineering Conference IDETC/CIE 2018 August 26-29, 2018, Quebec City, Quebec, Canada
DETC2018-85934
single cylinder engines [3, 4]. The first is to help meet new emis-sions standards. Diesel emisemis-sions can cause environmental dam-age and impact health both chronically and acutely, and with the large volume of single cylinder engines sold each year, even in-cremental improvements in emissions can result in significant improvements in air quality. Therefore, regulatory bodies have set emissions restrictions on these engines that are constantly tightening. For example, manufacturers in India must bring their single-cylinder engines up to BS 6 (equivalent to euro 6) emis-sions standards by 2020 [5]. The exhaust treatments required to do this will reduce the mechanical power of the engine due to back pressure. Turbocharging can be used to mitigate some of the performance losses caused by emissions after treatment.
Furthermore, turbo charging single cylinder engines will re-duce particulate emissions in high altitude operations by supply-ing more air to the engine for more complete combustion. Areas such as the Altiplano Plateau in Bolivia would benefit from this technology, as 60% of the farms there are at an altitude above 4,000 meters. In addition, local small-scale farmers would also benefit from the power increases provided by turbocharging. Air density, and consequentially engine power output, decreases by over 30% at these high altitudes and turbocharging would help counteract these losses [6, 7].
Turbocharging single cylinder engines can also improve fuel economy by allowing the smaller engines to produce the same power output as a larger engine, but with fewer frictional losses due to the smaller frictional area between the piston and the cylinder [1, 2]. The increased air mass flow rates caused by tur-bocharging can also improve fuel economy by reducing cooling losses through increased heat transfer. However, care should be taken as turbocharging can also increase fuel consumption by in-creasing pumping losses [1, 2].
Turbocharging single cylinder engines is not currently done commercially due to the mismatch between the intake and ex-haust strokes. Previous work from the authors has demonstrated that using a large volume intake manifold as an air capacitor can equalize this mismatch (Fig. 1) [8]. However, the commercial vi-ability of this approach depends on how manifold sizing affects power density, emissions, and fuel efficiency.
The authors have already demonstrated how an air capacitor can increase power output in single cylinder engines by 40-60% (depending on heat transfer in the manifold) compared to natural aspiration using first-order analytical models of the interaction between the air capacitor, turbocharger, and engine. These mod-els were verified with a simple experimental setup composed of a diesel generator modified with an air capacitor turbocharger sys-tem, which showed an increase in engine power output by up to 29% compared to natural aspiration [9].
FIGURE 1. Block diagram that shows the layout of the experimental setup used
EXPERIMENT DESIGN
To further explore how air capacitors affect power output and examine their effect on fuel efficiency and emissions, empiri-cal testing was performed on a single cylinder diesel engine fitted with a turbocharger and manifolds of varying size, which acted as air capacitors. Manifold size was varied and engine power output, fuel efficiency, and gas emissions were measured for en-gine speeds of 2500, 3000, and 3500 RPM and for a range of output power (from no load to an equivalence ratio of about 2). Measurements from this engine were used to calibrate a one di-mensional CFD engine model built in Ricardo Wave. This model was then used to predict how tuning other parameters such as valve timings, injection timings, the compression ratio, and heat transfer could further improve the turbocharged engine.
The single cylinder diesel engine was fitted with a tur-bocharger and an interchangeable manifold system. A series of sensors, including an eddy current dynamometer, measured emissions, fuel economy, manifold temperatures, manifold pres-sures, and power output from the engine (Fig. 2 and Fig. 3).
The Taylor DE 20 small engine eddy current dynamometer was selected for its small size, relatively low cost, and high accu-racy [10]. The dynamometers accuaccu-racy is determined by the load cell its attached to, the distance from the dynomometers center to the load cell, and the calibration accuracy. In order to max-imize accuracy, the load cell must have the narrowest possible range that can accommodate the maximum expected torque from
FIGURE 2. Block diagram that shows the layout of the experimental setup used
the engine [10]. The maximum torque from the engine was ex-pected to be 60% larger than the rated torque due to turbocharg-ing. Using this expected torque as an input for Equations 1-2, it was determined that a load cell with a range of at least 207n was needed. The U4000 load cell (Shelborne Sensors,) with a 250 n range was selected based on the dynamometer manufacturers recommendation and the sensors range [11].
LoadCellSize=MaximumTorque
LeverArm (1) LoadCellSize=1.6 ∗ 22nm
0.17m = 207n (2) The kholer KD440 engine was selected for this experiment because it is readily available, commonly used in numerous ap-plications, has a mechanical governor that allows simple speed control, and can be easily fitted with a turbocharger. The kholer KD440 is a direct injected diesel engine with a 0.44 liter dis-placement, and its specifications are shown in Table 1 [12]. Stan-dard diesel fuel purchased at a local Shell Station and SAE 10w-30 motor oil were used for this experiment. The engine was fit-ted with the IHI RHB31 turbocharger (Ecotrons,) because, at the time, it was the only commercially available turbocharger small enough for this application.
TABLE 1. Kholer KD440 Air Cooled Diesel Engine specifications
Maximum Power 6.8 kw Maximum Torque 22 nm Maximum speed 3,600∗RPM Displacement 441 cm3· kg Bore 86 mm Stroke 76 mm Compression Ratio 20.3:1
*note that the engine has data for up to 3,600 RPM but is recom-mended for operation at a maximum of 3,000 RPM
**Data From Manufacturer [12]
Five intake manifolds were created to connect the tur-bochargers compressor outlet to the engine intake (Fig. 4). These manifolds were designed to have minimal flow losses and to test how different intake manifold volumes affected the engines over-all performance. The manifolds had approximately the same di-ameter to control for the effect of pressure drop on manifold per-formance. The smaller two manifolds were high pressure hoses
FIGURE 3. Photographs of the experimental setup with key parts of the setup identified. A: Zoomed out view of Dynamometer room shown in Fig. 2. B: Zoomed in view of the dynamometer and engine platform. C: Zoomed in view of the controls system.
with a one and a half inch internal diameter, while the three larger manifolds consisted of a steel chamber connected to the engine intake and compressor intake by two high pressure hoses with a one and a half inch internal diameter. In addition, a custom exhaust manifold was created to connect the engine to the tur-bochargers turbine inlet because the initial exhaust manifold was not designed to mechanically support a turbocharger.
In order to measure fuel economy, the fuel mass was contin-uously measured using a load cell to calculate the mass of fuel used over time. The fuel tank was suspended from the load cell using a wire [13]. The load cell was calibrated between each experiment by adding diesel fuel in 250ml increments, and as-suming a density of diesel fuel of 832g/ml [1]. This method for measuring fuel economy was chosen due to its low cost relative to mass flow meters. Initial tests were performed to determine the sampling frequency and sampling duration needed to accu-rately measure fuel economy. To provide the most conservative estimate on sampling duration, the tests were performed at low speed and low power to minimize the fuel flow rate, and thus maximize the error. It was found that a 120 second test at 4Hz resulted in a 95% confidence interval that was less than 1% of the brake specific fuel economy value.
The Testo 350 Portable Emissions Analyzer was used to measure steady state emissions characteristics. The analyzer was selected due to its low cost, large range, high accuracy, and rea-sonable reaction time [ [14]]. The analyzer measured nitrous ox-ide, oxygen, carbon monoxox-ide, and carbon dioxide levels in the engines exhaust. Steady state air mass flow rate was calculated
FIGURE 4. Diagram of the five initial intake manifold configurations tested initially. Note that this figure is not to scale.
from emissions and fuel flow rate data using stoichiometry as de-scribed in equations 3 and 4. The concentration of NOx, CO, and other exhaust gas elements were small enough in the exhaust to be considered negligible for this derivation.
In order to avoid having to obtain an expensive air mass flow meter steady state air mass flow rate was calculated from emis-sions and fuel flow rate data. Equations 3-4 show how air mass flow rate can be calculated. Note that the concentration of NOx, CO, and other exhaust gas elements are small enough in the ex-haust that it can be considered irrelevant.
The combustion of diesel fuel can be described by the a sim-ple stoichiometric equation.
(1.8n
4 + n)O2+CnH1.8n−→ 1.8n
2 H2O+ nCO2 (3)
From this equation the molar balance of the combustion of diesel can be calculated.
per mol CnH1.8nBurned−→ (
1.8n
4 + n) mol O2Consumed(4)
mass of oxygen that is consumed for every gram of fuel burned. Molar Mass CnH1.8n= (13.8 ∗ n) g mol (5) Molar Mass O2= 32 g mol (6) ˙ mO2 burned= ˙mf uel∗ 3.36 (7)
By making assumption that the mass fraction of oxygen burned is equal to the volume fraction of oxygen burned it is possible to calculate the intake mass flow rate of oxygen as a function of the volume percent of oxygen in the exhaust stream, fuel mass flow rate, and the volume percent of oxygen in the in-take stream. All of these are known values.
˙ mO2 intake≈ %O2 intake by volume %O2 burned by volume ∗ ˙mO2 burned (8) ˙ mO2 intake≈ %O2 intake %O2 intake− %O2 exhaust ∗ ˙mf uel∗ 3.36 (9)
The engine’s intake stream is ambient air where oxygen makes up 20.95% of ambient air composition by volume and 23.2% by mass. Combining this data with the fuel flow rate data makes it possible to calculate the mass flow rate of air.
˙
mair= ˙mO2 intake∗ Mass Fraction Oxygen in Air (10)
˙ mair= 20.95 20.95 −Vol%O2 exhaust ∗ ˙mf uel∗ 3.36 0.232 (11)
This analysis allows for the calculation of air mass flow rate, air to fuel ratio, and the Airfuel equivalence ratio. These values are important for evaluating the performance of the engine and the effectiveness of the turbocharger air capacitor system.
RESULTS AND DISCUSSION
Figure 5 shows the pressure in the intake manifold (mea-sured approximately 10cm before the intake valve) as a function of power output for the five capacitor cases and the naturally as-pirated case at 3500 RPM. As expected, the intake pressure in-creases with power output and also with increasing air capacitor size.
Figure 6 shows the air mass flow rate through the engine as a function of engine power output for the five turbocharged cases and the naturally aspirated case when the engine is running
FIGURE 5. Plot showing the intake air pressure of the engine as a function of the engine’s power output for the five turbocharged cases and the naturally aspirated case at 3500 RPM.
FIGURE 6. Plot showing the air mass flow rate through the engine as a function of the engine’s power output for the five turbocharged cases and the naturally aspirated case at 3500 RPM.
at 3500 RPM. The increase in air mass flow rate with increas-ing power for the turbocharged conditions demonstrated the tur-bocharger’s efficacy, and mass air flow rate increased with capac-itor size as expected. The superior performance of the naturally aspirated condition at low powers is likely due to low exhaust en-thalpy, which would cause the turbocharger to behave like a flow constrictor.
Compared to the naturally aspirated case, turbocharging with the largest air capacitor was able to increase the air flow by approximately 30 %. This corresponds to a 30% increase in air density in the engine witch should result in a 30% increase in power density. However, a significantly lower power density increase was observed.
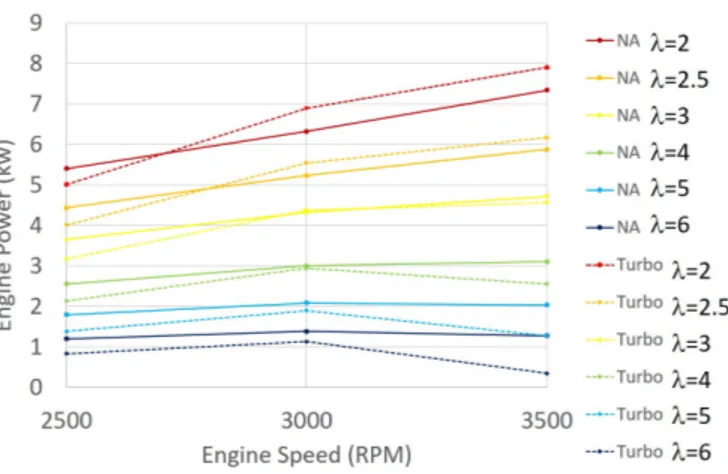
FIGURE 7. Map of engine showing the how the equivalence ratio of the engine for different speeds and powers. The solid lines show the map for the naturally aspirated case and the dotted lines show the map for the turbocharged case with the largest capacitor size.
equivalence ratio (lambda) engine map was created. The equiva-lence ratio (λ ) was calculated using equation 12. Figure 7 com-pares the air to fuel equivalence ratios of the largest capacitor tur-bocharged case to the naturally aspirated case. This map shows, that as expected, the naturally aspirated case outperforms the tur-bocharged case at low loads and at low speeds where the enthalpy in the exhaust gas is lower. At higher speeds and loads the tur-bocharger outperforms the naturally aspirated engine. However, the turbocharger only increases the power output of the engine by approximately 10% for a the lowest equivalence ratio at the maximum speed. At this operating point the intake air mass flow is increased by 30% so a similar increase in equivalence ratio is expected. This implies there is a significant inefficiency the system. AF= m˙air ˙ mf uel (12) λ = AF AFStoichiometric = AF 14.5 (13)
In order to further observe the potential inefficiency, the brake specific fuel economy (BSFC) is plotted in figure 8. This plot shows that the turbocharged engine is operating at a lower efficiency than the naturally aspirated, which matches the equiva-lence ratio results. But, it is unexpected. Two possible sources of this inefficiency are pumping losses and premature combustion due to an excessive effective compression ratio.
Pumping losses can be calculated from the engine volume, the exhaust pressure, and the intake pressure (Eqn. 14). The
FIGURE 8. Plot showing the BSFC as a function of the engine’s power output for the five turbocharged cases and the naturally aspirated case at 3500 RPM.
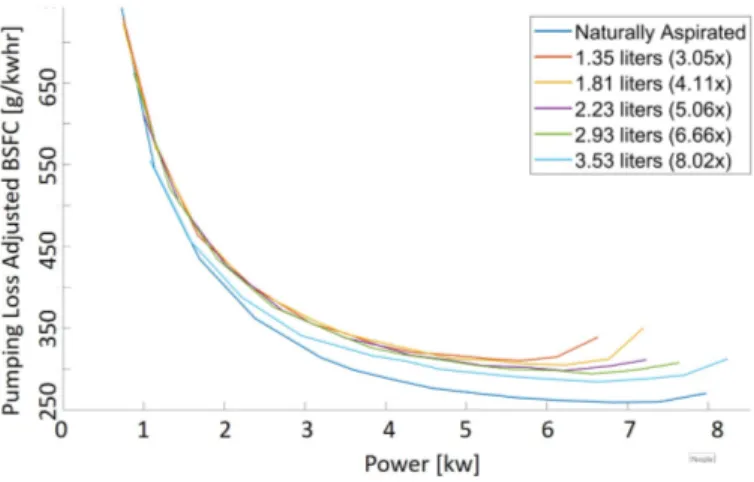
pumping losses for the five turbocharged engine configurations were found to start high and decrease as the engine power in-creases while that of the naturally aspirated case started low and increased with increasing engine power (Fig. 9). To see the ef-fect of pumping losses on the system the BSFC was adjusted to include pumping work (Eqn. 15). This adjustment accounted for the difference in efficiency at lower power levels but did not explain the efficiency losses at higher powers (Fig. 10).
The efficiency losses at higher powers are most likely due to diesel knock caused by a large effective compression ratio when the engine is turbocharged resulting in premature combustion. This hypothesis will be tested in future work where the engine is modified to have a lower compression ratio. In addition, more computational modeling will be done to identify other potential sources of efficiency losses.
PumpingLosses≈ Q ∗ ∆P ≈RPM∗Veng
2 ∗ 60 ∗ ∆P (14) Ad justedBSFC≈ FuelFlow
(Sha f tPower + PumpingLosses) (15) In order to meet emissions standards understanding the ef-fect on nitrous oxide emissions are key. Nitrous oxide emissions are a function of temperature and the amount of oxygen avail-able. Increasing air capacitor size increased the available oxy-gen, and, as a result, increased the NOx levels. Figure 11 shows how available oxygen increases the NOx concentrations. Fig-ure 12 shows the break specific nitrous oxide production which shows that the available oxygen NOx increase is magnified by the higher air mass flow rate. With no emissions control systems this is what is expected since the engine is running in a leaner state higher intake air density and the air mass flow rate is higher.
FIGURE 9. Plot showing the pumping losses in the engine as a func-tion of the engine’s power output for the five turbocharged cases and the naturally aspirated case at 3500 RPM.
FIGURE 10. Plot showing the adjusted BSFC as a function of the engine’s power output for the five turbocharged cases and the naturally aspirated case at 3500 RPM.
The collected data also provide insights into how incorpo-rating air capacitor turbocharging with emissions strategies can improve engine performance. Larger air capacitors resulted in a lower exhaust temperatures (Fig. 13). This can be used with an active exhaust gas recirculation (EGR) system to reduce the amount of oxygen in the engine during lower power states. A high EGR ratio system can combine with a diesel particulate fil-ter to minimize NOx emissions while compensating for the in-creased particulate emissions due to the EGR system.
Carbon monoxide emissions was the final parameter that was analyzed. Figure 14 shows carbon monoxide emissions as a function of power output. The combustion process is more likely to favor carbon monoxide at certain temperatures and when more oxygen is available. At lower powers carbon monoxide output
FIGURE 11. Plot showing the nitrous oxide emission in the exhaust as a function of the exhaust temperature output for the five turbocharged cases and the naturally aspirated case at 3500 RPM.
FIGURE 12. Plot showing the brake specific NOx output as a func-tion of the engine’s power output for the five turbocharged cases and the naturally aspirated case at 3500 RPM.
FIGURE 13. Plot showing the exhaust temperature as a function of the engine’s power output for the five turbocharged cases and the natu-rally aspirated case at 3500 RPM.
FIGURE 14. Plot showing the brake specific CO output as a function of the engine’s power output for the five turbocharged cases and the naturally aspirated case at 3500 RPM.
was reduced in the turbocharged case most likely due to the in-crease in oxygen due to the higher temperature. At higher powers the lack of oxygen becomes the dominant force in carbon monox-ide formation. As a result the smaller capacitor sizes, which are at a lower equivalence ratio, produce significantly more carbon monoxide. This implies that using a large air capacitor can be used as a strategy to control carbon monoxide emissions.
COMPUTATIONAL MODEL
To predict the performance of the system in response to changes in manifold design, a computational model was created in Ricardo Wave. An initial model of the Kholer engine was created using the default software values, engine geometry from taken from the Kholler kd440 manual, and constants from litera-ture [15].
The software’s default constants were based on a large multi-cylinder gasoline engine. Therefore, the Ricardo Wave model had engine specific constants that needed to be calibrated: Heat Transfer Multipliers, the NOx formation constants, the ex-haust orifice (determines back pressure), and the four multipliers in the Chen-Flynn friction model (EQN. 16) [16].
FMEP= A + B ∗ PeakPressure +C ∗ n + D ∗ n2 (16) These variables were calibrated using data from the naturally aspirated dynomomiter tests. A simulated annealing algorithm was used to calibrate the system using the recommended range from the software or values from the literature [15] as bounds. Figure 15 shows the flow chart of how the calibration scheme worked. The matlab function that utilized the built in simulated
FIGURE 15. Flow chart of how the computational model calibration method works.
annealing package controlled the optimization constants. This function fed a second matlab function that created the framework for nine engine simulations for different power and speed levels (based on experimental engine data) and sent the framework to a simulink model. The simulink model ran a Ricardo Wave one dimensional CFD model for each of the nine cases. For each simulation the system was scored for each running condition us-ing equation 17. The summation scores for the nine simulations gave a total score that was fed back into the simulated annealing algorithm function (Eqn. 18). This process then repeated with the simulated annealing algorithm feeding a new set of constants to the simulation control matlab function. The algorithm was time constrained to run for a day, during which 300-400 itera-tions would occur. For future work this simulation will be run for significantly longer in order to ensure that a true minimum is reached.
TABLE 2. Model constants that were calibrated using the simulated annealing method. These values effect fuel economy, emissions, power output, and exhaust pressure. Each constant will affect all of these parameters by directly effecting a specific parameter in the Ricardo Wave model.
Calibration Constant Units Range Values From
Directly Effects Optimized Value Heat Transfer Multiplier (Intake Valves Closed) − 0.6-2 Software Temperatures 1.966 Heat Transfer Multiplier (Intake Valves Open) − 0.6-2 Software Temperatures 0.7275 NOx Arrhenius Exponent Multiplier − 0.5-2 Software Emissions 1.0197 NOx Pre-Arrhenius Exponent Multiplier − 0.5-2 Software Emissions 0.889 Cetane Number − 45-55 Literature Combustion Speed 50.883 Exhaust Orifice Diameter mm 25-40 Experiment Exhaust Pressure 35.69 Chen-Flynn Friction A bar 0.05-0.4 Literature FMEP 0.2257 Chen-Flynn Friction B − 0.004-0.006 Literature FMEP 0.005887 Chen-Flynn Friction C pa∗minm 130-170 Literature FMEP 145.42 Chen-Flynn Friction D pa∗min2
m2 0.016-0.032 Literature FMEP 0.01782
Fit(speed, power) = (ExperimentPower− ModelPower ExperimentPower ) 2 + (ExperimentBSFC− ModelBSFC ExperimentBSFC ) 2 + (ExperimentNOx− ModelNOx ExperimentNOx ) 2
+ (ExperimentTexhaust− ModelTexhaust ExperimentTexhaust
)2 + (ExperimentPexhaust− ModelPexhaust
ExperimentPexhaust
)2 (17)
TotalScore= Fit(low, low) + Fit(low, mid) + Fit(low, high) + Fit(mid, low) + Fit(mid, mid)
+ Fit(mid, high) + Fit(high, low) + Fit(high, mid) + Fit(high, high)
(18)
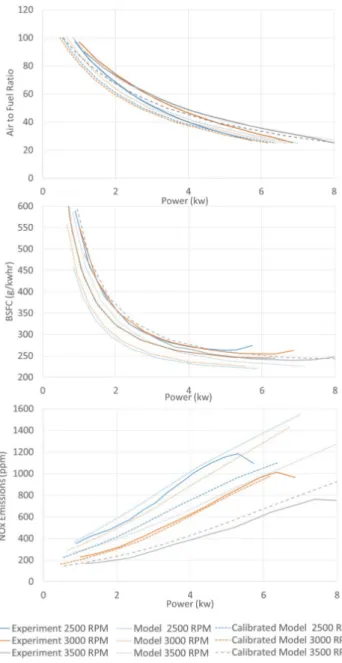
The comparison of the calibrated model to the uncalibrated model are shown in figure 16. Initially the models were com-pared empirically. The models will be comcom-pared analytically once the calibration algorithm has the opportunity to run for a significantly longer period of time. For comparing air to fuel ra-tio to power the calibrated model was found to be slightly more accurate overall but less accurate at lower powers and for the
high speed case. For fuel economy the calibrated model is ob-served to be significantly more accurate in the high load use case and noticeably more accurate in the mid load case. In the case of emissions the calibrated model is observed to be significantly more accurate for the mid and high speed cases and slightly less accurate for the low speed case.
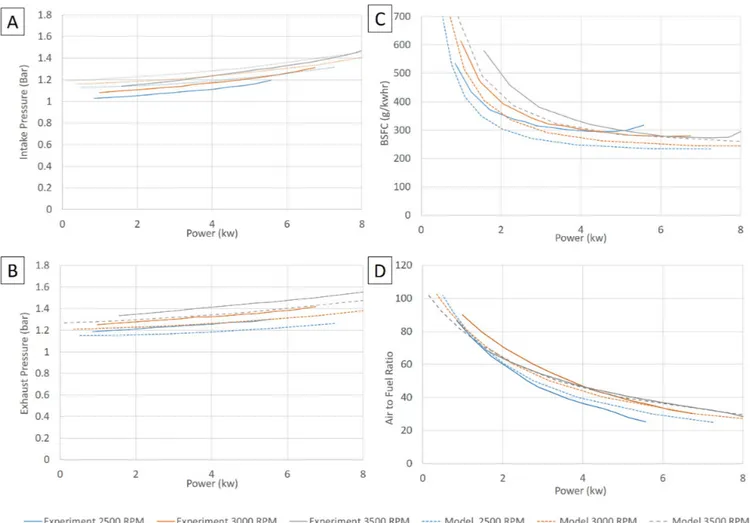
The calibrated model was modified to include a turbocharger. In this case the detailed MAP for the RHB31turbocharger we were using was unavailable. A generic turbocharger MAP that came with the Ricardo Wave software (220tcMap) was used and scaled in order to match the size of the RHB31. The scaling was done in a similar simulated annealing method to calibrating the naturally aspirated model with the scoring based on matching the model’s average intake and exhaust pressure to the real engine with the largest volume air capacitor. The results are bellow in table 3. Figure 17 shows how the model compares to the experimental data.
The model has a noticeable error relative to the experimental data. However, it is observed that the calibrated model with the calibrated turbocharger is able to accurately predict the trends in fuel economy, power, and pressure which makes it a useful tool for identifying how engine parameters affect overall engine performance.
FIGURE 16. The results of the calibration method that compares the naturally aspirated engine to the uncalibrated naturally aspirated model and the calibrated naturally aspirated model. The top plot shows Air to Fuel ratio as a function of power output. The middle plot shows fuel economy as a function of power output. The bottom plot shows nitrous oxide emissions as a function of power output.
PRELIMINARY STRATEGIES FOR OPTIMIZING THE ENGINE FOR TURBOCHARGING
The next steps in this project is to use the computational model to explore how other strategies could further improve the engine performance and compound the benefits of turbocharging. The first strategy of interest is intercooling. By cooling the air in the intake manifold, the intake air density will increase
TABLE 3. The scaling values used to fit the model turbocharged to the real turbocharger
Calibration Constant Optimized Value Compressor Diameter Multiplier 0.8 Compressor Mass Flow Multiplier 0.9 Compressor Efficiency Multiplier 0.7
Shaft Inertia 1 ∗ 10−6kgm2 Turbine Diameter Multiplier 1.12
Turbine Mass Flow Multiplier 0.5 Turbine Efficiency Multiplier 0.9
[17, 18]. This will also allow the engine to run at a cooler tem-perature which will increase the engine’s efficiency and reduce the NOx output of the engine. Inter-cooling was simulated in the calibrated Ricardo Wave model by changing the heat transfer co-efficient of the intake manifold. As heat transfer increased in the intake manifold, power output increased and fuel consumption decreased with a diminishing marginal return (Fig. 18). Since adding heat transfer elements to the manifold adds cost, future work should incorporate cost when optimizing the intake mani-fold for heat transfer to promote commercial viability.
The second strategy is optimizing fuel injection timing. The current engine uses a mechanical fuel pump which injects the diesel fuel at approximately 500 bar starting at six degrees be-fore top dead center (TDC). The calibrated Ricardo Wave model demonstrated how adjusting the injection timing can have a large effect on the overall engine performance. Injection timing has a large effect on fuel consumption and power output with the opti-mal timing being approximately six degrees before TDC for the low speed case and ten degrees before TDC for the high speed case (Fig. 19).
The third area strategy is optimizing valve timing. Adding a turbocharger affects the pressures in the intake and exhaust man-ifold, which will affect how the air flows into and out of the en-gine. As a result the optimal valve timing for the naturally as-pirated case might not be the same as the optimal timing for the turbocharged case [19]. The Ricardo Wave model shows that the intake valve timing can significantly impact the power density of the engine but has minimal effect on fuel economy (Fig. Figure 20). For the turbocharged case the model suggests that the intake valve close should happen earlier than the engine’s current 42 degrees and the intake valve open should happen latter than the engine’s current 10 degrees in order to maximize power density with a negligible effect on fuel economy.
FIGURE 17. Plots showing a comparison between the calibrated turbocharger model and the experimental data for the function of power output using the largest volume capacitor condition. A) Shows intake pressure as a function of power output. B) Shows exhaust pressure as a function of power output. C) Shows BSFC as a function of power output. D) Shows power output as a function of air to fuel ratio.
The model also shows that the exhaust valve timing has a no-ticeable effect on fuel economy and power density (Fig. 21). The exhaust valve closed should be latter then the current 10 degrees After TDC to optimize both fuel economy and power density. This behavior is most likely due to more air needing to be scav-enged. To maximize the power density, the exhaust valve open should be latter then the current 58 degrees before Bottom Dead Center (BDC). However, maximizing power output opposes min-imizing fuel consumption, which occurs when the exhaust valve opens earlier than the current 58 degrees BDC.
The fourth strategy identified is adjusting the compression ratio. Since the engine is intaking higher density air in the tur-bocharged case, the effective compression ratio is significantly higher, even though the geometric compression ratio stays the same [1, 2]. This high effective compression ratio could cause premature combustion in the turbocharged case and inefficient
combustion. The Ricardo wave model showed that the optimal compression ratio is between 16 and 18, notably less than the engine’s actual compression ratio of 20.3 (Fig. 22).
The final strategy is implementing an exhaust gas recircula-tion (EGR) system. NOx producrecircula-tion increases and the amount of soot decreases when the engine runs leaner, such as in low power states. [1]. Injecting burnt exhaust gas into the intake manifold can make the engine run richer in low power states. Future mod-els will look into the effect of EGR and how best to implement it in a single cylinder turbocharged engine.
The next step in this work is to create a design method that can optimize for these proposed strategies to simultaneously cal-ibrate the variables mentioned in the strategies above. Fuel in-jection, compression ratio, and valve timings are very closely related, and changing one will alter how the others affect the sys-tem. Therefore, a desired design method would be able
simul-FIGURE 18. Plot from Ricardo Wave model showing the effect of adding cooling elements to the intake manifold for the largest volume air capacitor condition at an equivalence ratio of 2 (air to fuel ratio of 29). The y axis is power output. The x axis represents non dimensional heat transfer (the ratio of the heat transfer coefficient to that of the natural convection on a steel tube).
FIGURE 19. Plot from Ricardo Wave model showing the effect of injection timing on power output. For the large volume air capacitor condition at an equivalence ratio of 2 (air to fuel ratio of 29) Note that the default injection timing is -6 degrees relative to top dead center.
taneously evaluate the affects of all the proposed improvement strategies, much like the simulated annealing method used to cal-ibrate the Ricardo Wave model. The main difference will be that the optimization method will minimize emissions, minimize fuel economy, and maximize power output instead of calibrating the engine parameters to match the output to an experimental value. The optimization model will take into account system cost to promote commercial viability.
Additional experiments will also be conducted with a dif-ferent turbocharger and with difdif-ferent compression ratios. By
FIGURE 20. Plot from Ricardo Wave model showing the effect of intake valve timing on power output (top) and BSFC (bottom). The engine’s default is opening the intake valve 10 degrees before top dead center and closing the intake valve 42 degrees after bottom dead center. The data shown is for the large volume air capacitor at 3500 RPM and an equivalence ratio of 2 (air to fuel ratio of 29).
experimenting with a better characteristic turbocharger it will be possible to further improve the computational model. The com-pression ratio of the physical engine will also be systematically varied to evaluate its role in the measured efficiency losses re-ported in this study.
CONCLUSION
The goal of this research was to analyze the effect of air capacitor turbocharging on key factors that affect the commer-cial viability of the engine such as emissions, fuel economy, and power density. Initially a set of experiments were run to see how
FIGURE 21. Plot from Ricardo Wave model showing the effect of exhaust valve timing on power output (top) and BSFC (bottom). The engine’s default is opening the exhaust valve 58 degrees before bottom dead center and closing the exhaust valve 10 degrees after top dead cen-ter. The data shown is for the large volume air capacitor at 3500 RPM and an equivalence ratio of 2 (air to fuel ratio of 29).
turbocharging and air capacitor sizing could affect key perfor-mance parameters in a single cylinder engine. Using this data a computational model was created and calibrated. The model was then used to find potential ways to further improve the engines performance.
This initial experiment confirmed that the turbocharger and air capacitor system could be used to increase the intake air den-sity and air mass flow through the system. The air capacitor size was found to have an impact on intake air mass flow. The tur-bocharged engine was able to increase power density; however, it fell short of its potential due to inefficiency in the system. It was found that turbocharging introduced an inefficiency that resulted
FIGURE 22. Plot from Ricardo Wave model showing the effect of compression ratio on power output.The data shown is for the large vol-ume air capacitor at an equivalence ratio of 2 (air to fuel ratio of 29). Note that the engine’s compression ratio is 20.3.
in an increase in fuel consumption. The turbocharger had mixed effects on emissions, increasing NOx emissions but decreasing CO emissions. In the future EGR can be used to mitigate some of these effects.
The results of these experiments calibrated a model that was used to provide more insights on how the turbocharged engine could be improved. Preliminary findings from this model sug-gest that altering the valve timings, injection timings, compres-sion ratio, and the heat transfer properties of the air capacitor can further improve engine performance. A multi-variable optimiza-tion scheme is needed in the future to find the optimal engine configuration since these engine perimeters are linked.
Overall it was found that an air capacitor has a positive im-pact on engine performance. Future steps are needed to confirm the inefficiencies in the system, further refine the computational model, run experiments with different engine configurations, and test some of the proposed improvements.
NOMENCLATURE AF Air to Fuel Ratio
AFStoichiometric Stoichiometric Air to Fuel Ratio
BMEP Break Mean Effective Pressure FMEP Friction Mean Effective Pressure
˙
mair Air Mass Flow Rate
˙
mf uel Fuel Mass Flow Rate
n Mean Piston Speed λ Equivilance Ratio
∆P Pressure Difference Between Intake and Exhaust ˙
Q Volumetric Flow Rate RPM Engine Speed Veng Engine Volume
ACKNOWLEDGMENT
We would like to thank Kevin Cedrone and the members of the Global Engineering and Research Lab for their assistance and feedback on this project. This work was sponsored by the Tata Center for Technology and Design at MIT and the MIT De-partment of Mechanical Engineering. I would also like to thank Ricardo Plc. for gifting us a Ricardo Wave license.
This material is based upon work supported by the National Science Foundation Graduate Research Fellowship under Grant No. 1122374. Any opinion, findings, and conclusions or recom-mendations expressed in this material are those of the authors(s) and do not necessarily reflect the views of the National Science Foundation.
REFERENCES
[1] Heywood, J., 1988. Internal Combustion Engine Funde-mentals. McGraw-Hill, New York, Ny.
[2] Watson, N., and Janota, M., 1982. Turbocharging the Inter-nal Combustion Engine. Jhon Wiley and Sons, New York, NY.
[3] Aravand, B., and Simhachalam, J. (personal communica-tion august 20th 2013) conversion with partners at mahin-dra and mahinmahin-dra corporation.
[4] USHACORPORATION, 2014. Stationary Diesel Engines, Presentation on Stationary Diesel Engines by USHA for marketing purposes.
[5] THE INTERNATIONAL COUNSEL ON CLEAN TRANS
-PORT, 2016. India Bharat Stage VI Emission Standards:
India BS VI Policy Update.
[6] NEW AGRICULTURIST, 2013. Country Profile - Bo-livia, WREN media. [online] available at: www.new-ag.info/en/country/profile.php?a=3155 [Accessed on 2018-2-11].
[7] Engineering toolbox, (2003). u.s. stan-dard atmosphere. [online] available at:
https://www.engineeringtoolbox.com/standard-atmosphere-d˙604.html [accessed 1/3/2018].
[8] Buchman, M., and Winter, A., 2014. “Method for tur-bocharging single cylinder four stroke engine”. Proceed-ings of the ASME 2014 International Design Engineering Technical Conferences(IDETC2014-35044), Aug. 2014. [9] Buchman, M., and Winter, A., 2016. “Validating a method
for turbocharging single cylinder four stroke engines”. Pro-ceedings of the ASME 2016 International Design Engi-neering Technical Conferences(IDETC2016-59593), Aug. 2016.
[10] TAYLOR DYNAMOMETER. DE20 Eddy Current Dynamometer. [online] available at: www.taylordyno.com/wp-content/uploads/2016/08/SMS2025v006-DE20.pdf [Accessed on 2018-1-12].
[11] SHERBORNE SENSORS, 2008. U4000 Series Universal Tension/Compression Load Cell. [online] available at: www.sherbornesensors.com/uploads/files/Files/U4000˙-˙2013˙Iss˙1.pdf [Accessed on 2018-1-12].
[12] KOHLER, 2012 (accessed January 12, 2018). KD440 Work-shop Manual.
[13] OMEGA, (accessed January 12, 2018). high-accuracy S-Beam Load Cells Rugged for Industrial Applications. [14] TESTO, (accessed January 18, 2018). Testo 350
Combus-tion and Emission Analyzer.
[15] Narayanan, A., 2011. “Downspeeding the diesel engine a performance analysis”. Master’s thesis, Chalmers Univer-sity of Technology.
[16] Chen, S. K., and Flynn, P. F., 1965. “Development of a single cylinder compression ignition research engine”. SAE(650733).
[17] Makartchouk, A., 2002. Diesel Engine Engineering: Ther-modynamics, Dynamics, Design, and Control. Marcel Dekker, Inc., New York, Ny.
[18] Winterbone, D., and Pearson, R., 1999. Design Techniques for Engine Manifolds. Professional Engineering Pub. Lim-ited, United Kingdom.
[19] Hiereth, H., and Prenninger, P., 2003. Charging the internal Combustion Engine. Springer Vienna, Vienna.