HAL Id: tel-02159558
https://tel.archives-ouvertes.fr/tel-02159558
Submitted on 18 Jun 2019
HAL is a multi-disciplinary open access archive for the deposit and dissemination of sci-entific research documents, whether they are pub-lished or not. The documents may come from teaching and research institutions in France or abroad, or from public or private research centers.
L’archive ouverte pluridisciplinaire HAL, est destinée au dépôt et à la diffusion de documents scientifiques de niveau recherche, publiés ou non, émanant des établissements d’enseignement et de recherche français ou étrangers, des laboratoires publics ou privés.
and airborne data
Ronghai Hu
To cite this version:
Ronghai Hu. Consistent forest leaf area index retrieval using ground and airborne data. Earth Sciences. Université de Strasbourg, 2018. English. �NNT : 2018STRAD021�. �tel-02159558�
UNIVERSITÉ DE STRASBOURG
ÉCOLE DOCTORALE MSII (
ED n°269
)
LABORATOIRE ICUBE (UMR 7357)
THÈSE
présentée par :Ronghai HU
soutenue le : 27 août 2018
pour obtenir le grade de :
Docteur de l’université de Strasbourg
Discipline/ Spécialité: Télédétection
Estimation cohérente de l’indice de
surface foliaire en utilisant des données
terrestres et aéroportées
THÈSE dirigée par :
Mme NERRY Françoise Directeur de Recherches, CNRS
RAPPORTEURS :
M. SOBRINO José Professor, University of Valencia
M. ROUJEAN Jean Louis Directeur de Recherches, CNRS
EXAMINATEUR :
i
Acknowledgements
The PhD stage in France is a very important experience and precious memory for me. As a Chinese student, it is my first time to do research with international colleagues and live independently abroad for a long time. This experience largely broadened my horizons, helped me establish collaboration with international researchers, trained me to live independently and enjoy life, and provided me a good opportunity to learn French. I would like to express my gratitude to all those who helped me during my PhD period in France.
First, I would like to thank three professors without whom I would not complete my PhD successfully. I would like to thank Dr. Françoise NERRY, my French supervisor who always encourages me and offers me this PhD opportunity. Many thanks for inviting me to your laboratory in France, helping me contact and set up my fieldwork in the historical garden of university of Strasbourg, and patiently helping me revise all the documents. I enjoy the time in France and I’m missing the life there already. I would like to thank Dr. Zhao-Liang LI, who recommended me and helped me apply for the PhD in France. Many thanks for helping me adapt to life in France and is always concerned about my future development. I would like to thank Prof. Guangjian YAN, my Chinese promoter who always cares about my growth and recommended me to France for further study. Many thanks for guiding me through my entire study and research career. I am lucky to become a student of you.
I would like to express my sincere gratitude to all my colleague in France. Elena BOURNEZ and Tania LANDES support me with the laser scanner data and helped advance my
ii
research in France. I’m particularly grateful to my main collaborator Elena BOURNEZ without whom I cannot work smoothly on my research about terrestrial laser scanner. You are always nice and support me with my research wholeheartedly. I really enjoyed the cooperation with you. Jihad ZALLAT helped me practice French and helped me lay the foundation for further French learning. Jerome COLIN introduced me the coffee time and helped me integrate into TRIO group. Laure ROUPIOZ, who kindly shared a office with me, always patiently explained to me the French chat that I didn't understand or didn’t keep up with. Raphaël LUHAHE always cheered me up and treated me as a family member. Hervé YÉSOU often brought me into French chat and brought a lot of French special gifts to my family. I have already missed our daily coffee time.
I am grateful to the chinese students and visiting scholars of the TRIO team, Zhuoya NI, Enyu ZHAO, Yuanyuan CHEN, Xiaojing HAN, Xiaopo ZHENG, Xinyu LAN, Yanlong WANG, Chao REN, Wei WANG, and Wenping YU, who help me adapt to the environment and accompany me in daily life and work. Wenhui YU took me to start European self drive tours. Yang Xiucheng accompanied me to play badminton and exercise. Yuan YE brought me know a lot of Chinese friends in Strasbourg. Dr. Wei Ruicheng took me to set up a hiking group, as well as Peng JING, Jianmin YANG. Baihui Li, Wenjin YAO, Peng ZHAO, Guixian LIU, Shangzhi CHEN, Lihong LIU, Xiaoguang SUN, Fujiao TANG, Shuangqi TANG, Jian WANG, Jinyang FAN, Chen LI, Li JIANG, and many friends in the hiking group. Accompanied by them, I traveled through more than ten countries in Europe, climbed more than ten mountains with kilometers height and experienced extraodinary scenery. I never felt lonely in Europe.
Finally, I would like to thank my family. Without their understanding and support I cannot wholeheartedly devoted to research work. I am lucky to growing up in such a family.
I am fortunate enough to know a lot of people who accompanied me, helped me, and concerned about me. There are too many people helped me. Thank you for all that I mentioned or I didn’t mention here. I hope our friendship will last forever. I sincerely thank you and wish you all a happy life!
iii
Contents
Acknowledgements ... i Contents ... iii List of Figures ... v List of Tables ... ix List of Acronyms ... xi Résumé ... I Chapter 1 Introduction ... 1Chapter 2 Review of Indirect Methods for Leaf Area Index Measurement ... 5
2.1 Introduction ... 5
2.2 Basic Concepts and Theoretical Background ... 11
2.3 Methods to Retrieve True LAI from Indirect Gap Fraction Measurements . 19 2.4 Instruments for Indirect LAI Measurement ... 30
2.5 Recent Advances and Future Perspectives ... 43
2.6 Gaps of Current Methods and Possible Solutions ... 52
Chapter 3 Modelling Leaf Area Index Based on Path Length Distribution ... 55
3.1 Beer-Lambert law ... 56
3.2 Essential Reason for LAI Underestimation: Inconstant Path Length ... 57
3.3 New LAI Retrieval Method Based on Path Length Distribution ... 59
iv
3.5 Materials ... 66
3.6 Results and Discussion ... 75
3.7 Conclusion ... 84
Chapter 4 Estimating Leaf Area of An Individual Tree in Urban Areas Using Terrestrial Laser Scanner and Path Length Distribution Model ... 85
4.1 Introduction ... 86
4.2 Modeling Leaf Area of a Single Tree ... 88
4.3 Materials ... 90
4.4 Methods ... 95
4.5 Results ... 101
4.6 Discussion ... 107
4.7 Conclusions ... 113
Chapter 5 Quantifying Clumping Effect and Estimating Leaf Area Index Using Airborne Laser Scanner and Path Length Distribution Model ... 115
5.1 Introduction ... 116 5.2 Materials ... 119 5.3 Methods ... 123 5.4 Results ... 131 5.5 Discussion ... 137 5.6 Conclusion ... 143
Chapter 6 Summary and Perspective ... 145
6.1 Major Findings and Discussions ... 146
6.2 Perspectives ... 148
References ... 151
v
List of Figures
Fig. 2.1 Yearly published items and citations related to indirect LAI measurement. ... 8
Fig. 2.2 Citation network on indirect LAI measurement since the 1990s ... 10
Fig. 2.3 Overview of a 25×25 m² homogeneous canopy composed of 79577 randomly distributed disc-shaped green leaves with a radius of 0.05 m (LAI=1) ... 13
Fig. 2.4 Typical LAD (g) and projection functions (G) ... 17
Fig. 2.5 Gap-size distributions in the zenith direction of a homogeneous canopy with planophile LAD ... 23
Fig. 2.6 Illustration of path length distribution ... 25
Fig. 2.7 Comparison of various clumping correction methods in discrete broadleaf forest scenes ... 29
Fig. 2.8 Illustration of various clumping correction methods ... 47
Fig. 3.1 Path length within the homogenous scene. ... 57
Fig. 3.2 Path length within a cylindrical canopy. ... 58
Fig. 3.3 Path length of the ellipse and circle. ... 64
Fig. 3.4 Flow of obtaining path length distribution from measured gap data. ... 66
Fig. 3.5 Overview of the cylindrical row canopy scene. ... 67
vi
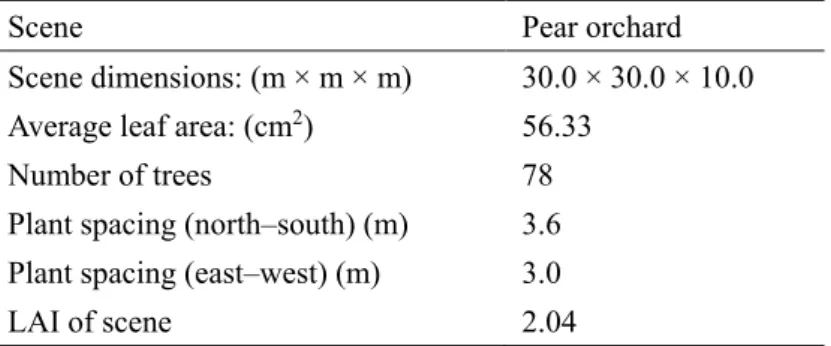
Fig. 3.7 Pear orchard located in Huailai, Hebei province, China. ... 70
Fig. 3.8 Visible (a) and near-infrared (b) image pair and classified canopy (c) and woody (d) component in site 1 ... 73
Fig. 3.9 Validation of the retrieved LAI in cylindrical row canopy scenes ... 75
Fig. 3.10 Validation of the retrieved LAI in different zenith angles in discrete broadleaf forest scenes ... 77
Fig. 3.11 Validation of the retrieved LAI in discrete broadleaf forest scenes ... 79
Fig. 3.12 Comparison of indirect leaf area index measurement in 2014 ... 81
Fig. 3.13 Effect of woody components on the indirect leaf area index measurement ... 83
Fig. 4.1 Illustration of Beer-Lambert law-based method for a forest stand (a) and for a single tree (b). ... 88
Fig. 4.2 Overview of the studied tree in the historical garden of the University of Strasbourg, France. ... 91
Fig. 4.3 Overview of the studied tree (red circle) and the seven TLS stations in June 27, 2016 ... 92
Fig. 4.4 Allometric relationship between leaf area and shoot length ... 93
Fig. 4.5 Terrestrial laser scanning data acquisition, pre-processing, and reconstruction of the studied tree (Source : E. Bournez). ... 94
Fig. 4.6 Leaf projection functions (G) computed from the point cloud of each station and the merged point cloud of four stations in July 3, 2013 ... 95
Fig. 4.7 The merged point cloud (a), convex envelope (b), and concave envelope (c) of the studied tree crown ... 97
Fig. 4.8 Illustration of laser pulses, gap probability and path length calculation for the studied tree using its envelope ... 98
Fig. 4.9 Path length distributions from seven TLS stations using a concave tree crown envelope in June 27, 2016 ... 102
Fig. 4.10 Plant area or woody area of the studied tree retrieved using TLS data and path length distribution model at different dates and seasons ... 103
vii
Fig. 4.11 Validation of the retrieved leaf area using TLS data and path length distribution
model. Both refined concave envelope and convex envelope were tested ... 104
Fig. 4.12 Comparison of woody area retrieved using refined concave envelope and convex envelope ... 105
Fig. 4.13 TLS-derived leaf area and gap probability of the studied tree crown at different resolutions ... 107
Fig. 5.1 Workflow diagram for estimating the clumping index and LAI by using the path length distribution model and airborne laser scanner data ... 119
Fig. 5.2 Airborne laser scanner data area and 18 field sites in the Genhe forestry reserve ... 121
Fig. 5.3 Workflow diagram for processing the normalized point cloud data and calculating the LAI for each grid cell ... 125
Fig. 5.4 Vertical crown cover from first-returns proportion. ... 128
Fig. 5.5 Validation of the laser penetration metrics using field photography ... 133
Fig. 5.6 The 0.5 m-resolution pit-free CHM generated using the ALS data ... 134
Fig. 5.7 The 5 m-resolution LAI generated using the ALS data using the path length distribution model ... 135
Fig. 5.8 Field validation of the LAI from the ALS data using the path length distribution model ... 136
Fig. 5.9 Comparison of the LAIs with different resolutions ... 137
Fig. 5.10 Clumping index maps at different scales ... 138
ix
List of Tables
Table 2.1 Relevant journals that published more than four papers related to indirect LAI
measurement ... 8
Table 2.2 Accuracy of Beer-Lambert law in homogeneous canopies for indirect LAI measurement ... 13
Table 2.3 Typical LADs (g) ... 16
Table 2.4 Accuracy of leaf projection function (G) in homogeneous canopies for indirect LAI measurement ... 17
Table 2.5 Representative methods for indirect LAI measurement ... 27
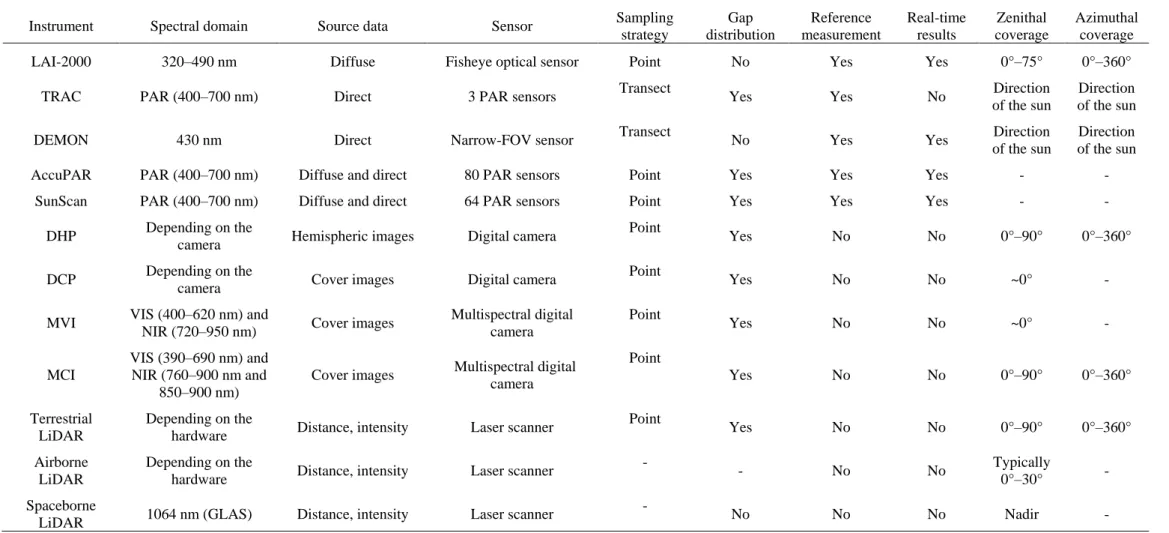
Table 2.6 Representative instruments for indirect LAI measurement ... 31
Table 3.1 Scene characteristics of broadleaf cylindrical canopies ... 68
Table 3.2 Scene characteristics of broadleaf spherical canopies ... 69
Table 3.3 Scene characteristics of the pear orchard in Huailai, Hebei province, China .. 70
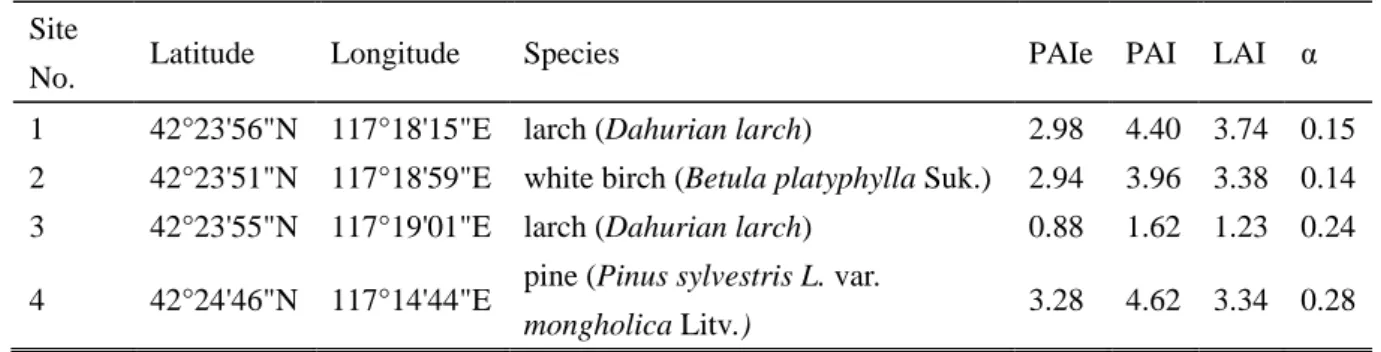
Table 3.4 Description of Study Sites and Results of The Indirect Measurement ... 72
Table 3.5 Description of MCI Measurement ... 72
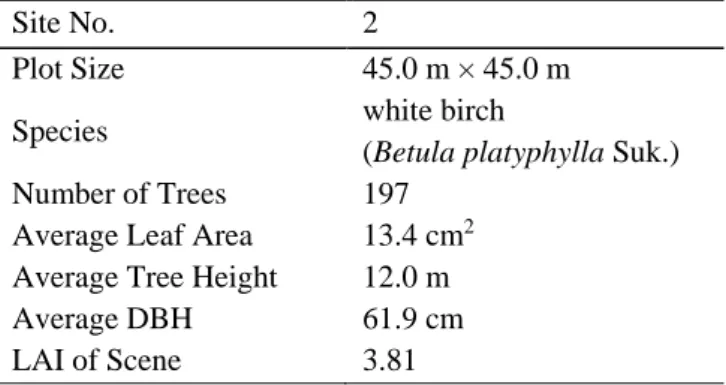
Table 3.6 Description of the Direct Measurement Site (White Birch) in Chengde, Hebei Province, China ... 73
x
Table 3.8 In situ validation of LAI retrieval in the pear orchard... 80 Table 4.1 Technical parameters of the two TLS systems ... 92 Table 4.2 Foliage Area Volume Density retrieved from seven TLS stations using path
length distribution model and concave envelope in June 27, 2016 ... 102 Table 4.3 Plant Area of ten trees retrieved from seven TLS stations in June 27, 2016 .. 106 Table 5.1 Representative Laser Penetration Metrics (LPM) ... 129 Table 5.2 Clumping Index of Airborne Laser Scanner (ALS), field photography and TRAC
xi
List of Acronyms
LAI Leaf Area Index
PAI Plant Area Index
WAI Woody Area Index
LAD Leaf Angle Distribution
FAVD Foliage Area Volume Density
LAIe Effective Leaf Area Index
PAIe Effective Plant Area Index
GLAI Green Leaf Area Index
GAI Green Area Index
TRAC Tracing Radiation and Architecture of Canopies
DHP Digital Hemispherical Photography
DCP Digital Cover Photography
MVI Multiband Vegetation Imager
MCI Multiband Canopy Imager
LiDAR Light Detection and Ranging
TLS Terrestrial Laser Scanner
ALS Airborne Laser Scanner
SLS Spaceborne Laser Scanner
xii
VIS Visible
NIR Near-infrared
PPFD Photosynthetic Photon Flux Density
DBH Diameter at Breast Height
CHM Canopy Height Models
AGL Above Ground Level
VCC Vertical Crown Cover
LPM Laser Penetration Metrics
LPI Laser Penetration Index
3D Three Dimensional
CC Gap-size distribution method
LX Finite-length averaging method
CLX Combination of CC and LX Methods
PATH Path length distribution method
PATH_MES Path length distribution method based on measured gap data
PATH_ELL Path length distribution method based on ellipse section
I
Résumé
La végétation est l'élément le plus important de la biosphère. C'est un facteur clé pour relier les différentes couches du système terrestre et réguler le cycle biogéochimique global qui a un impact profond sur l'avenir de l'humanité et de la Terre. La photosynthèse végétale est la réaction chimique la plus importante sur Terre. Le processus d'utilisation de l'énergie lumineuse pour assimiler le dioxyde de carbone et l'eau pour produire de la matière organique et libérer de l'oxygène est le principal moyen pour l'écosystème terrestre d'obtenir de l'énergie externe et de maintenir l'équilibre du carbone et de l'oxygène. La végétation a donc un impact sur l'équilibre radiatif du système gaz terrestre, sur le cycle de l'eau et du carbone et la régulation du sol, l'environnement écologique et le climat global.
La surface foliaire est l’un des facteurs majeurs de la production d’un écosystème. L’indice de surface foliaire (Leaf Area Index, LAI), défini comme la moitié de la surface foliaire par unité de surface de sol, est un paramètre clé de la structure de la végétation pour la modélisation des échanges de masse (eau et carbone) et d’énergie (rayonnement et chaleur) dans le système Terre-atmosphère. Une mesure précise du LAI est particulièrement importante pour le calcul quantitatif du cycle global des matériaux et de l'énergie. Au cours des dernières décennies, les exigences de précision de l'inversion du LAI ont également été continuellement renforcées du fait du développement rapide du changement global, l'évaluation écologique, de l'agriculture de précision et d'autres domaines. Le Système mondial d'observation du climat (Global Climate
II
Observing System, GCOS) exige que l'erreur relative du produit indice de surface foliaire ne dépasse pas 20% et que l'erreur absolue ne dépasse pas 0,5.
La méthode indirecte par inversion de la loi d’extinction du rayonnement de Beer-Lambert est actuellement la principale méthode de mesure terrestres et aéroportées du LAI en raison de sa grande efficacité et de son mécanisme concis. L’effet d’agrégation du feuillage est le facteur le plus critique qui influence la précision de l’estimation du LAI. Dans la mesure indirecte au sol, les algorithmes précédents corrigent dans une large mesure l’effet d’agrégation en considérant les espaces entre les couronnes. Cependant, l’effet d’agrégation causé par des longueurs incohérentes de trajets dans la couronne n’est pas pris en compte.
La recherche cohérente de LAI avec des données de télédétection à plusieurs échelles, en particulier à l’échelle au sol et à l’échelle aéroportée ou satellitaire, est une tâche permanente importante. Traditionnellement, la mesure indirecte utilisant la loi de Beer-Lambert et les instruments optiques étaient utilisés pour la mesure de LAI au sol, tandis que le modèle de transfert de rayonnement et l'image de télédétection multispectrale étaient utilisés pour la détermination aéroportée et spatiale de LAI.
Le scanner laser offre une opportunité pour une détermination LAI cohérente à plusieurs échelles, car le scanner laser terrestre et le scanner laser aéroporté ont le même mécanisme physique. Le balayage laser est une technologie de télédétection active qui capture les nuages de points tridimensionnels de l'objet scanné. Il a été largement utilisé pour obtenir les paramètres des auvents et des couronnes, tels que la hauteur des arbres, le diamètre à hauteur de poitrine, la densité de la canopée et la biomasse, etc.
À l'échelle du terrain, les méthodes d'estimation du LAI peuvent être classées en méthodes directes et indirectes. Les méthodes directes, y compris la récolte, l'allométrie et la collecte des déchets, peuvent être utilisées pour mesurer un arbre individuel et sont considérées comme plus précises que les méthodes indirectes mais présentent l'inconvénient d'être longues, laborieuses et destructrices pour la végétation. Les méthodes indirectes, dans lesquelles la surface foliaire est déduite des mesures d'autres variables, telles que la fraction de trou ou la transmission de la lumière à travers les auvents, sont efficaces, non destructives et modifiables en automatisation ; ainsi, ces méthodes sont largement utilisées. Cependant, les travaux antérieurs sur la mesure
III
indirecte du LAI se sont principalement concentrés au niveau du peuplement, c'est-à-dire sur une communauté contiguë d'arbres. La mesure de la surface foliaire d'un arbre individuel est rarement explorée bien que les arbres isolés soient plus communs que les forêts dans les zones urbaines. La plupart des instruments et des théories ne sont pas directement applicables à la mesure du LAI d'arbres individuels urbains, en raison de l'influence des bâtiments environnants ou d'autres objets. Le scanner laser terrestre peut séparer l'arbre étudié de l'environnement urbain en utilisant ses informations de distance uniques, tandis que la théorie traditionnelle de la végétation continue devrait être adaptée pour les arbres isolés en milieu urbain.
À l'échelle aéroportée, l'estimation du LAI repose principalement sur l'imagerie optique passive précoce ou sur la technologie émergente du scanner laser actif. La récupération de LAI en utilisant l'imagerie optique passive est facilement affectée par de multiples facteurs tels que l'atmosphère, la structure de la canopée, l'hétérogénéité du sol et l'effet d'échelle, et est facilement saturé. En tant que moyen d'observation émergent développé au cours des 20 dernières années, le scanner laser aéroporté est devenue le principal moyen de cartographie régionale de l'indice foliaire du fait de sa meilleure pénétrabilité et de son accès direct à l'information tridimensionnelle de la canopée forestière. À l'heure actuelle, la détermination du LAI utilisant le scanner laser aéroporté est principalement obtenue via un modèle semi-empirique, réalisé par l'équation de régression semi-empirique avec l'indice de pénétration laser, le rapport de nuages de points ou d'autres paramètres intermédiaires. Des recherches antérieures montrent que le modèle semi-empirique et semi-physique basé sur l'indice de pénétration du laser et la loi de Beer-Lambert donne les meilleurs résultats. Cette méthode est devenue le principal moyen de récupération du LAI utilisant le scanner laser aéroporté car elle a une certaine signification physique et réduit le problème de saturation dans l'inversion d'image optique. Le scanner laser aéroporté partage le même principe La loi de Beer avec mesure indirecte, permettant à l'inversion LiDAR aéroportée de tenir compte des progrès de la recherche et de l'expérience de mesure indirecte de l'indice de surface foliaire depuis plus d'un demi-siècle, mais il fait également face à des problèmes similaires avec la mesure indirecte au sol. L'effet d’agrégation est le facteur clé. La grande empreinte et la faible densité ponctuelle du scanner laser aéroporté sont deux contraintes majeures pour appliquer la méthode au sol traditionnelle afin de corriger l'effet d’agrégation, car les empreintes LiDAR aéroportées (dizaines de centimètres ou plus) sont trop grandes pour capturer les petits espaces et la taille
IV
détaillée la distribution, qui est un intrant nécessaire pour la méthode au sol traditionnelle. De plus, les informations tridimensionnelles ne sont pas non plus utilisées efficacement. Par conséquent, la correction de l'effet d’agrégation est toujours un problème non résolu pour la détermination du LAI utilisant le scanner laser aéroporté.
En résumé, le LAI est un paramètre clé du cycle écologique de la Terre, et sa précision d'acquisition a toujours la nécessité et la possibilité d'amélioration. La technologie du scanner laser actif offre une possibilité de récupération cohérente du LAI à plusieurs échelles, alors que les théories traditionnelles ont besoin d'adaptation. Il est nécessaire de démarrer de la mesure au sol la plus basique et de l'inversion du scanner laser aéroporté de pointe pour améliorer la précision et la fiabilité du produit du LAI de la source. Dans cette thèse, le modèle de distribution de longueur de trajet est introduit pour corriger l'effet d’agrégation, et il est appliqué aux données du scanner laser terrestre et du scanner laser aéroporté. La méthode d'obtention de la distribution de longueur de trajet de différentes plates-formes est étudiée et le modèle de récupération cohérent est établi. Le modèle devrait faciliter la récupération cohérente de l'indice de surface foliaire des forêts à l'aide de données au sol et aéroportées.
Le chapitre 1 présente en introduction les motivations de ce travail de thèse après une brève discussion sur l'état de l’art et la nécessité d'étudier l'estimation du LAI. La base théorique, les progrès et les problèmes de l’estimation de l’indice foliaire sont tout d’abord résumés. Les méthodes indirectes ont connu des progrès considérables au cours des dernières années, les rendant ainsi opérationnelles dans la mesure LAI au sol et même dans le cas de l’estimation aéroportée. L’amélioration de la précision de ces méthodes a toujours été une tâche permanente étant donné l’exigence croissante de relier la précision aux mesures réelles. La dernière décennie a été témoin de progrès associés au balayage laser, à la photographie de couverture, à l’estimation de l’agrégation à l’intérieur de la cime, aux effets de pente, à la composante ligneuse et à la mesure de la distribution de l’angle foliaire.
Le chapitre 2 passe en revue de manière exhaustive le cadre théorique et les méthodologies de mesure indirecte des LAI, suivis des descriptions des instruments et des plates-formes actuels. Les développements futurs et les perspectives d’amélioration de l’applicabilité et de la précision
V de la mesure indirecte du LAI sont ensuite discutés.
Pour faire face à l’effet d’agrégation dans l’estimation de l’indice foliaire des forêts, ce travail effectue des recherches pertinentes basées sur la distribution de la longueur de la trajectoire sous trois aspects : modélisation théorique, mesure terrestre et estimation aéroportée.
Dans le chapitre 3, prenant les longueurs incohérentes de trajets dans la couronne comme point de rupture, ce travail analyse le mécanisme de sous-estimation du LAI de la loi de Beer-Lambert, puis propose le modèle de l’estimation du LAI en introduisant la distribution de la longueur de trajet pour modéliser l’effet d’agrégation au sein d’une couronne causé par la forme de la couronne. Contrairement au modèle précédent, le modèle de distribution de longueur de trajet a l’avantage d’utiliser la distribution de longueur de trajet pour décrire la distribution spatiale tridimensionnelle des feuilles et de considérer la forme de la couronne tridimensionnelle et la distribution en hauteur de l'arbre. De plus, il peut traiter la distribution non aléatoire de la fraction de trou dans les couronnes. Grâce à différentes formes d'intrants, le modèle peut être appliqué aux instruments et plates-formes terrestres et aéroportés existants pour améliorer efficacement la précision de la mesure de l'indice de surface foliaire.
Le chapitre 4 présente une méthode pour estimer la surface foliaire des arbres isolés en milieu urbain en utilisant le modèle de distribution de la longueur de trajet. La méthode d’obtention de la distribution de la longueur du trajet proposée est basée sur l’enveloppe de la couronne d’arbre reconstruite à partir du nuage de points 3D mesuré par le scanner laser terrestre. L’objectif est d’appliquer et vérifier le modèle de distribution de la longueur de trajet sur les données du scanner laser terrestre pour les arbres isolés en milieu urbain. Ainsi, l’effet d’agrégation pourra être corrigé pour améliorer la précision de l’estimation de la surface foliaire. La mesure de la surface foliaire urbaine est importante pour bien évaluer l'impact des arbres urbains sur la régulation du microclimat, l'effet d'îlot de chaleur, le refroidissement du bâtiment, l'amélioration de la qualité de l'air et la formation d'ozone. Les travaux antérieurs sur la mesure de la surface foliaire portaient principalement sur le niveau du peuplement, bien que la présence d'arbres individuels soit plus fréquente que celle des forêts dans les zones urbaines. Les seules méthodes réalisables pour la mesure non destructive de la surface foliaire, à savoir les méthodes indirectes optiques, sont largement limitées dans les zones urbaines parce que le trajet de la
VI
lumière est toujours intercepté par les bâtiments environnants ou d'autres objets.
Le scanner laser terrestre, qui permet d'extraire l'arbre individuel en utilisant ses informations de distance uniques, offre une possibilité de mesurer indirectement l'indice de surface foliaire dans les zones urbaines. Cependant, la théorie de mesure indirecte du LAI, qui utilise le cosinus de l'angle zénithal d'observation pour la correction de longueur de trajectoire, est incompatible pour un arbre individuel car la zone projetée de LAI change à mesure que l'angle zénithal change, rendant les résultats incomparables et ambigus.
Par conséquent, le modèle de distribution de la longueur de trajet a été modifiée pour la mesure de la surface foliaire pour les arbres isolés en remplaçant la correction de la longueur du trajet cosinus traditionnel par la canopée continue avec la distribution de la longueur du trajet réel. Puisque les données du scanner laser terrestre sont plus détaillées (meilleure résolution spatiale) que les données du scanner laser aéroporté, la distribution de longueur de trajet pourra être calculée de façon plus précise. De façon spécifique, chaque enveloppe de l’arbre est composée d’une multitude de triangles. Pour chaque rayon, les intersections avec tous les triangles sont calculées. Généralement, on détecte deux intersections. La longueur du trajet de ce rayon est calculée par la distance entre ces deux points. Puis la longueur du trajet de tous les rayons sont calculées. Dans un deuxième temps, la fraction de trouée est calculée par les proportions des rayons passant à travers l’arbre. Les rayons qui n’ont pas de retours ou qui ont des rendements au-delà de l’enveloppe sont considérés comme passant à travers l’arbre. Enfin, la fraction de trouée et la distribution de longueur de trajet sont utilisées comme entrées du modèle de distribution de longueur de trajet. La densité de la surface foliaire de chaque arbre est ainsi obtenue. Pour chaque arbre, les résultats des différentes observations sont cohérents, démontrant la stabilité et la validité de la méthode.
Le chapitre 5 présente une méthode de cellule de grille basée sur le modèle de distribution de longueur de trajet pour calculer le LAI corrigé par agrégation en utilisant les données du scanner laser aéroporté sans exigence de mesures de terrain supplémentaires. Nous avons séparé les zones à l'intérieur et entre les couronnes afin de prendre en compte l'agrégation entre les couronnes, et migré le modèle de distribution de la longueur du trajet pour prendre en compte le profil du feuillage 3D et l'agrégation à l'intérieur de la couronne.
VII
La méthode d’obtention de la distribution de la longueur du trajet proposée est basée sur un modèle de hauteur de la canopée reconstruite à partir du nuage de points 3D mesuré par le scanner laser aéroporté. Dans un premier temps, les données du scanner laser aéroporté sont lues et prétraitées. Pour chaque ligne de vol, les points relatifs au bruit ont été enlevés et l’élévation du sol a été soustraite. Puis les 20 lignes de vol ont été fusionnées. Les résultats de ce processus conduisent à des données normalisées, dans lesquelles la valeur de z représente la hauteur de chaque point au-dessus du sol. Deuxièmement, les données normalisées sont utilisées pour calculer la LPM (Laser Penetration Metrics). Une méthode multi-niveaux a été appliquée pour générer un modèle de hauteur de la canopée (Canopy Height Models, CHM) sans trou. Troisièmement, la LPM a été utilisée comme une approximation de la fraction de trouée, et la CHM comme celle de la distribution de longueur de trajet. Ces deux données ont été utilisées comme entrées du modèle de distribution de longueur de trajet. Ainsi, la carte de LAI a pu être obtenue. Finalement, les LPM et LAI ont été validées avec des mesures sur le terrain.
La précision sur la fraction de l’écart et sur le LAI efficace est la même que pour les recherches précédentes. Notre nouvelle méthode est capable de calculer le LAI réel. Avec les données du scanner laser aéroporté de 0,4 m-empreinte, les résultats sont généralement prometteurs et une analyse d'agglutination à plusieurs niveaux est compatible avec le paysage parcouru. Les LAI de différentes résolutions sont cohérents, avec une différence de moins de 5% entre 5 et 250 m de résolution. En raison de sa constance et de sa configuration simple, la méthode fournit une occasion de cartographier le LAI corrigé par agglutination et renforce la capacité du LiDAR aéroporté à surveiller le changement de végétation et à valider le produit satellite. Cette méthode de cellule de grille basée sur la distribution de longueur de trajet mérite d'être testée et appliquée en utilisant une technologie laser plus récente.
Le chapitre 6 présente et discute les principales conclusions de cette thèse ainsi que les perspectives et les limites rencontrées. Le modèle de distribution de la longueur de la trajectoire et les conclusions proposées dans ce document peuvent faciliter l’amélioration de la précision de la récupération de l’indice LAI forestier et de l’inversion cohérente aéroportée et terrestre.
VIII
mesure du LAI des arbres isolés en milieu urbain en utilisant des données du scanner laser terrestre en remplaçant la correction de longueur de trajet cosinus traditionnelle par une distribution en longueur réelle. À l'échelle aéroportée, un modèle de distribution de la longueur du trajet est mis en œuvre pour corriger l'effet d'agrégation en utilisant le modèle de hauteur de la canopée acquis à partir des données du scanner laser aéroporté. Ils fournissent également l’occasion de cartographier le LAI corrigé par agrégation et renforcent la capacité du scanner laser aéroporté à surveiller la dynamique de la végétation. La récupération cohérente du LAI forestières à l'aide de données au sol et aéroportées est réalisée en utilisant la distribution de la longueur du trajet.
Par rapport à la recherche existante, les caractéristiques de recherche et les innovations de cette thèse sont les suivantes :
(1) Un modèle de distribution de la longueur du trajet a été proposé pour tenir compte de l'indice d'agrégation à l'intérieur de la couronne et de l'estimation du LAI. Le concept de fonction de distribution de longueur de trajet est introduit, et le modèle d'inversion du LAI basé sur la distribution de longueur de trajet est établi. L'un des avantages de la théorie de la distribution de la longueur de trajet est qu'elle permet de caractériser et de traiter le caractère non aléatoire induit par la forme de la couronne au sein des auvents qui peut entraîner une sous-estimation allant jusqu'à 25%. Cet aspect n'a jusqu’à présent pas été traité de manière appropriée par les algorithmes existants et on s'attend à ce que la théorie de longueur de trajet améliore la précision de mesure indirecte de LAI avec l'utilisation des instruments optiques courants.
(2) Une méthode d'estimation précise de la surface foliaire des arbres isolés a été proposée en remplaçant la correction de la longueur du trajet en cosinus traditionnel pour la canopée continue avec la distribution de la longueur du trajet réel. La distribution de la longueur du trajet réel a été calculée au moyen d'intersections d'enveloppes d'impulsions laser basées sur l'enveloppe de couronne d'arbre reconstruite à partir du nuage de points du scanner laser terrestre. En conséquence, la densité volumique de la surface du feuillage a été séparée du modèle de distribution de la longueur du trajet pour le calcul de la surface foliaire. Les résultats de différentes stations sont globalement cohérents et l'utilisation de la moyenne pondérée des
IX
différentes stations par les nombres d'échantillons améliore encore l'universalité et l'efficacité de la méthode proposée.
(3) Une correction indépendante de l'effet d’agrégation à l'aide des données du scanner laser aéroporté a été obtenue avec l'utilisation de la distribution de longueur de trajet. L'algorithme de correction de l'effet agrégation traditionnel est difficile à appliquer pour les données du scanner laser aéroporté. La principale limitation est que le scanner laser aéroporté a une grande empreinte et une faible densité de nuages, ce qui rend difficile l'obtention de l'information précise de distribution de brèche requise par l'algorithme d'index d'agrégation au sol traditionnel. Dans cette thèse, le modèle de distribution de longueur de trajet est introduit dans l'inversion du scanner laser aéroportée et la distribution de longueur de trajet est directement obtenue en utilisant le nuage de points 3D pour corriger l'effet d'agrégation et estimer le LAI. Il permet de se soustraire à la limitation du scanner laser aéroporté de ne pas obtenir la distribution précise des tailles de trous en utilisant le processus de la correction indépendante de l'effet d’agrégation avec les données du scanner laser aéroporté ce qui améliore grandement la précision et la praticabilité de la cartographie rapide du LAI.
Les applications de l'acquisition de la distribution de la longueur du trajet ne se limitent pas à la méthode proposée dans ce document. Les perspectives sont nombreuses aussi bien pour l’extension de la méthode que pour son amélioration.
(1) Acquisition de la distribution de la longueur du trajet avec reconstruction précise de l'enveloppe à l'aide d'une matrice de voxels
Dans cette étude, les feuilles sont généralement uniformément réparties dans l'enveloppe et l'écart de distribution des feuilles pour les arbres plus complexes n'est pas pris en compte, ce qui pourrait entraîner une sous-estimation des arbres ayant des structures complexes. Une reconstruction d'enveloppe précise utilisant une matrice de voxels sera utile pour décrire des structures arborescentes complexes.
(2) Correction de l'effet d’agrégation et estimation du LAI basé sur un scanner laser aéroporté à onde complète
X
Le scanner laser à pleine longueur d'onde fournit plus d'informations que le scanner laser à retour discret traditionnel, en particulier les informations de largeur d'impulsion obtenues lorsque l'impulsion laser traverse la canopée. Ce type d'information a un grand potentiel d'application pour l'acquisition d'une longueur de trajet. Les données à retour discret ont certaines limites pour obtenir le profil inférieur de la canopée. Bien que l'inversion de l'indice de surface foliaire puisse toujours être obtenue par la longueur de trajet relative, une distribution de longueur de trajet absolue plus précise peut être obtenue si l'information de forme d'onde complète peut être obtenue. Cela contribuera à l'inversion de la densité de la surface foliaire et améliorera encore la précision de l'estimation de l'indice de surface foliaire par le scanner laser aéroporté.
(3) Utilisation du scanner laser satellitaire pour corriger les effets d'agrégation et estimer le LAI
Le scanner laser satellitaire peut également acquérir des informations 3D. Bien que sa résolution soit beaucoup plus faible que celle du scanner laser aéroporté, ses mécanismes sont similaires. Il est également possible d'obtenir des informations de distribution de longueur de trajet pour corriger l'effet d'agrégation. Si la correction de l'effet d'agrégation des données du scanner laser satellitaire peut être réalisée, la précision de l'inversion du LAI du scanner laser satellitaire sera grandement améliorée, et une nouvelle source de données du LAI globale pourra être fournie. L'application du modèle de distribution de trajet avec des données acquises par le scanner laser satellitaire pose encore de grands défis. Différent d'un scanner laser à petite empreinte avec une impulsion laser correspondant à une longueur de trajet, la taille d’une empreinte est de plusieurs dizaines de mètres, couvrant une grande surface incluant la canopée et le sol, et l'unique écho contient différentes composantes. Pour des informations de hauteurs différentes, il est nécessaire d'explorer toutes les informations de forme d'onde et d'étudier la méthode d'extraction de la distribution de longueur de trajet à partir des informations de forme d'onde complète.
1
Chapter 1 Introduction
Vegetation is the most important component of the biosphere. It is a key factor in connecting the various layers of the earth system and regulating the global biogeochemical cycle, which has profoundly impact on the future of mankind and the earth. Plant photosynthesis is the most important chemical reaction on the earth. The process of using light energy to assimilate carbon dioxide and water to produce organic matter and release oxygen is the main means for the earth ecosystem to obtain external energy and maintain the balance of carbon and oxygen. Vegetation has a profound impact on the radiation balance of the Earth's gas system, water cycle, carbon cycle, and soil regulation, ecological environment and global climate.
Leaf area index (LAI), defined as one half of the total leaf area per unit ground surface area (Chen and Black 1992a), is a key parameter of canopy structure. It controls a variety of biophysical and physiological processes and is widely used in ecology, forestry, botany and agronomy (Jonckheere et al. 2004; Myneni et al. 1989; Ross 1981). Most ecosystem models require an accurate estimate of LAI, as leaf area directly regulates productivity for all ecosystems (Asner et al. 2003; Clark et al. 2008; Stark et al. 2012). From the perspective of material, LAI has a direct impact on photosynthesis and respiration, further affecting the global material cycle, especially carbon cycle. From the perspective of energy, it characterizes the canopy-atmosphere interface, where most of the energy fluxes exchanges (Breda 2003). Accurate measurement of LAI is particularly important for the quantitative calculation of global material and energy cycle. In recent decades, the accuracy requirements of leaf area index inversion have also been continuously improved with the rapid development of global change,
2
ecological assessment, precision agriculture and other fields. The Global Climate Observing System (GCOS) requires that the relative error of the leaf area index product does not exceed 20% and the absolute error does not exceed 0.5.
Consistent LAI retrieval with multi-scale remotely sensed data, especially between ground scale and airborne or satellite scale, is an important on-going task. Traditionally, indirect measurement using Beer-Lambert law and optical instruments were employed for ground LAI measurement while radiation transfer model and multispectral remote sensing image were employed for airborne and spaceborne LAI retrieval. Ground measurement is the basis, not only for fine modeling at small regional scale, but also for reference value of airborne and spaceborne inversion, which determines the overall accuracy of leaf area index inversion. Airborne and spaceborne retrieval has an obvious advantage in coverage, and is an irreplaceable means of obtaining regional and global data.
Laser scanning provides an opportunity for consistent LAI retrieval at multiple scales because terrestrial laser scanning (TLS) and airborne laser scanning (ALS) have the same physical mechanism. Laser scanning is an active remote sensing technology which captures three-dimensional (3D) point clouds of the scanned object. It has been widely used in obtaining parameters of canopies and crowns, such as tree height, diameter at breast height (DBH), canopy density, and biomass, etc. (Bouvier et al. 2015; Koch et al. 2006; Wang et al. 2009).
At ground scale, the LAI estimation methods can be classified as direct and indirect methods. Direct methods, including harvesting, allometry, and litter collection, can be used for measuring an individual tree and are regarded as more accurate than indirect methods but have a disadvantage of time-consuming, labor-intensive, and destructive to vegetation (Colaizzi et al. 2017; Daughtry 1990; Peper and McPherson 2003; Simioni et al. 2004). Indirect methods, in which leaf area is inferred from measurements of other variables, such as the gap probability or light transmission through canopies, are efficient, nondestructive and amendable to automation; thus, these methods are widely used (Macfarlane et al. 2014; Mu et al. 2017; Ryu et al. 2010b; Yao et al. 2011). However, previous work on indirect LAI measurement mainly focused on the stand level, i.e. a contiguous community of trees (Leblanc and Fournier 2014; Nowak et al. 2008; Strahler et al. 2008; Weiss et al. 2004). Leaf area measurement for an individual tree is rarely explored although isolated trees are more common than forests in urban areas. Most instruments and theories are not directly applicable to urban individual tree LAI measurement, because of the influence of the surrounding buildings or other objects. TLS can
3
separate the studied tree from the urban environment using its unique distance information, while the traditional theory for continuous vegetation should be adapted for isolated trees in urban environment.
At airborne scale, the LAI estimation is mainly based on early passive optical imaging or emerging active laser scanner technology. The LAI retrieval using passive optical imaging is easily affected by multiple factors such as atmosphere, canopy structure, soil heterogeneity and scale effect, and is easy to be saturated. As an emerging means of observation developed in the past 20 years, ALS has become the main means of regional leaf area index mapping because its better penetrability and direct access to the three-dimensional information of forest canopy. At present, the LAI retrieval using ALS is mainly realized by semi-empirical model, which is realized by the semi-empirical regression equations with laser penetration index, point cloud ratio or other intermediate parameters. Previous researches show that the semi-empirical and semi-physical model based on laser penetration index and Beer-Lambert law performs best. This method has become the main means for ALS LAI retrieval because it has certain physical meaning and reduces the saturation problem in optical image inversion. Airborne LiDAR shares the same principle Beer-Lambert law with indirect measurement, making it possible for airborne LiDAR inversion to learn from the research progress and experience of indirect measurement of the ground leaf area index for more than half a century, but it also faces similar problems with ground indirect measurement. The clumping effect is the key factor. The large footprint and low point density of airborne LiDAR are two major constraints for applying the traditional ground method to correct the clumping effect, as airborne LiDAR footprints (tens of centimeters or larger) are too large to capture the small gaps and the detailed gap size distribution, which is necessary input for traditional ground method. In addition, the three-dimensional (3D) information is also not utilized efficiently. Therefore, correcting clumping effect is still an unsolved problem for ALS LAI retrieval.
In summary, the LAI is a key parameter of the Earth's ecological cycle, and its acquisition accuracy still has the necessity and possibility of improvement. Active laser scanning technology provides an opportunity for consistent LAI retrieval at multiple scales while traditional theories need adaptation. It is necessary to start from the most basic leaf area index ground measurement and the cutting-edge airborne laser scanner inversion to improve the accuracy and reliability of the leaf area index product from the source. In this thesis, the path length distribution model is introduced to correct the clumping effect, and it is applied to the
4
TLS and ALS data. The method of obtaining the path length distribution of different platforms is studied, and the consistent retrieval model is established. The model is expected to facilitate the consistent retrieval of the forest leaf area index using ground and airborne data.
Chapter 1 introduces in the introduction the motivation of this thesis work after a brief discussion on the state of the art and the need to study the estimation of LAI. The theoretical basis, progress and problems of foliar index estimation are first summarized.
Chapter 2 provides a comprehensive review of the theoretical framework and methodologies for indirect measurement of LAI, followed by descriptions of current instruments and platforms. Future developments and prospects for improving the applicability and accuracy of indirect LAI measurement are then discussed. To deal with the clumping effect in estimating the leaf area index of forests, this work carries out relevant research based on the path length distribution under three aspects: theoretical modeling, terrestrial measurement and airborne retrieval.
Chapter 3 analyzes the mechanism of LAI underestimation of the Beer-Lambert law, then proposes LAI estimation model in introducing the path length distribution to model the clumping effect caused by the crown shape.
Chapter 4 presents a method to estimate the leaf area of isolated trees based on the path length distribution and TLS data. The method for obtaining the path length distribution is proposed based on the envelope of the reconstructed tree crown from the 3D point cloud measured by the TLS.
Chapter 5 presents a method to correct the clumping effect based on the path length distribution and ALS data. The method of obtaining the proposed path length distribution is based on a canopy height model reconstructed from the 3D point cloud measured by the airborne laser scanner.
Chapter 6 summarizes and discusses the main conclusions of this thesis as well as the perspectives and limitations encountered.
5
Chapter 2 Review of Indirect Methods for Leaf
Area Index Measurement
Optical indirect methods based on the Beer-Lambert law are widely adopted in numerous fields given their high efficiency and feasibility for LAI estimation. These methods have undergone considerable progress in the past decades, thereby making them operational in ground-based LAI measurement and even in airborne estimation. Improving the accuracy of these methods has always been an ongoing task given the increasing requirement for relating accuracy to actual measurements. The last decade witnessed progress associated to laser scanning, cover photography, within-crown clumping, slope effect, woody component, and leaf angle distribution measurement. This chapter comprehensively reviews the theoretical framework and methodologies of indirect LAI measurement, followed by current instruments and platforms. Future development and perspectives to improve the applicability and accuracy of indirect LAI measurement are then discussed.
2.1
Introduction
Leaf area index (LAI), which describes the amount of leaf area per unit horizontal ground surface area, is a key vegetation parameter for modeling mass (water and carbon) and energy (radiation and heat) exchange between the biosphere and the atmosphere (Asner et al. 2003; GCOS 2011; Ren et al. 2014; Stark et al. 2012; Tian et al. 2015b).
6
LAI ground measurement plays an important role in vegetation monitoring and serves as the true value for remote sensing validation (Breda 2003; Gower et al. 1999; Yan et al. 2016d; Yin et al. 2017). Methods for LAI ground measurement can be classified as direct or indirect. Direct methods generally consist in sampling manually leaves in a destructive way and measuring their area by means of instruments such as LI-3000C Portable Leaf Area Meter (LI-COR, Lincoln, NE, USA), LI-3100C Area Meter (LI-(LI-COR, Lincoln, NE, USA), and CI-202 Portable Laser Leaf Area Meter (CID Bio-Science, Camas, WA, USA) before calculating LAI by definition. A complete manual measurement is thus only feasible for small samples of low vegetation. However, manual sampling is also employed for forests or large samples of low vegetation by selecting small amounts of representative leaves and establishing allometric relationships. The allometric relationships are empirical functions that relate leaf area or leaf weight (gravimetric method) to any dimension of the woody element that carries leaves, including sapwood area, stem diameter, and crown base height (Colaizzi et al. 2017; Jonckheere et al. 2004). These relationships, dependent on the site, species, and even years (Breda 2003), are then used for upscaling (Daughtry 1990; Gower et al. 1999). We classify the allometric method as a direct method in the present study because the sampled leaves and the branch structures for determining the allometric relations are measured manually. When the samples are representative enough, direct methods are regarded as more accurate than indirect methods and, thus, are often used to validate indirect methods. However, direct methods are generally time consuming, labor intensive, and often destructive to vegetation, which limits their applications and render them unfeasible for high temporal and spatial frequency measurements (Jonckheere et al. 2004; Weiss et al. 2004). Indirect methods, including optical and inclined point quadrat methods, infer LAI by measuring other variables, such as gap fraction, light transmission, and contact number. It could be noticed that the allometric method could also be viewed as an indirect-contact LAI measurement method because it infers LAI based on the relationship with other vegetation characteristics. Indirect methods consist of Beer-Lambert law-based optical methods and inclined point quadrat methods. Optical methods infer LAI from measurements of radiation transmission through canopies with the use of optical instruments (e.g., LAI-2000, Tracing Radiation and Architecture of Canopies [TRAC], and Digital Hemispherical Photographs), which are efficient and nondestructive; thus, these methods are widely used for ground measurement and remote sensing validation (Chen and Cihlar 1996; Dou et al. 2016; Qu et al. 2014; Zeng et al. 2015). The inclined point quadrat method consists in using thin needles (point quadrats) to pass through the canopy and count the number of
7
contacts of touches between point quadrats and leaves. It therefore requires a large number of insertions, which leads to huge fieldworks (Jonckheere et al. 2004). Optical point-quadrat method, which consists in measuring heights to the lowest leaves above a set of sample points established on the ground beneath the canopy, is a modification of the point-intercept method (Radtke and Bolstad 2001). This method is less labor-intensive with the use of laser scanning but underestimates total LAI when the foliage is clustered and foliage density is high (Coops et al. 2007; Radtke and Bolstad 2001). Thus, Beer-Lambert law-based optical methods have become the mainstream approach for LAI measurement.
Indirect methods have been rapidly developed and widely used since the 1990s. Literature searches were conducted in Web of Science using the keyword combination TOPIC: (“leaf area index” OR “plant area index”) AND TOPIC: (measur* OR estimat* OR method) AND TOPIC: (indirect OR “optical instrument*”) (Fig. 2.1, Table 2.1). Results indicate that the number of published items generally increased and approximately 25 papers are being published annually (Fig. 2.1a) in journals on agriculture, forestry, remote sensing, and global change (Table 2.1). The number of citations is one to two orders of magnitude larger than that of published items. The citations are nearly 1200 times in 2016, which is approximately 42 times the number of published items that year (Fig. 2.1b). Several reviews were cited more than 500 times, many of which come from other fields. This finding indicates that LAI indirect measurement methods are widely recognized in the scientific community and have been applied in large fields and industries.
8
Fig. 2.1 Yearly published items and citations related to indirect LAI measurement. (The search was conducted on March 18, 2018, using Web of Science with the keyword combination TOPIC: [“leaf area index” OR “plant area index”] AND TOPIC: (measur* OR estimat* OR method) AND TOPIC: [indirect
OR “optical instrument*”].)
Table 2.1 Relevant journals that published more than four papers related to indirect LAI measurement. (The search was conducted on March 18, 2018, using Web of Science with the keyword combination TOPIC: [“leaf area index” OR “plant area index”] AND TOPIC: [measur* OR estimat* OR method] AND TOPIC:
[indirect OR “optical instrument*”].)
Journal No. of published items
Agricultural and Forest Meteorology 40
Journal of Applied Remote Sensing 36
Forest Ecology and Management 11
Remote Sensing of Environment 9
Remote Sensing 9
Canadian Journal of Forest Research 7
Tree Physiology 6
Field Crops Research 6
International Journal of Remote Sensing 5
IEEE Transactions on Geoscience and Remote Sensing 4
Global Change Biology 4
Agronomy Journal 4
9
We analyzed the citation network on indirect LAI measurement using CiteSpace (Chen 2006) (Fig. 2.2) starting in the 1990s to consider only complete records of the Web of Science. Four main periods can be considered. In the first period, indirect instruments based on light transmission were widely and successfully used in low crops (Welles 1990). Indirect measurement techniques started to be operational and commercialized during this period. However, these indirect instruments underestimate LAI when applied to forests where leaves are not randomly distributed (Chason et al. 1991; Deblonde et al. 1994; Fassnacht et al. 1994; Smith 1993). Thus, the focus in the second period was dedicated to a better understanding of non-random or clumped forest canopy. The physical definition of LAI was first discussed (Chen and Black 1992a), and the gap-size distribution model was developed for the measurement of forest LAI (Chen 1996; Chen and Cihlar 1995a). The physical mechanism and sampling scheme for measuring forest LAI, which includes clumping index, woody-to-total area ratio, and needle-to-shoot area ratio, were proposed. Several comprehensive reviews and comparisons were made in the third period to summarize theories, sensors, errors, and sampling in indirect LAI measurement (Breda 2003; Garrigues et al. 2008; Jonckheere et al. 2004; Leblanc et al. 2005b; Weiss et al. 2004). The combination of gap-size distribution and finite-length averaging method was also proposed (Leblanc et al. 2005b). In the fourth period, namely, the current one, indirect LAI measurement continues to move forward with wide applications. Considerable efforts were exerted in the past decades to quantify and correct clumping effect, woody components, and leaf angle distribution (LAD) (Hu et al. 2014; Ryu et al. 2010b; Zou et al. 2009); considerable progress was achieved in improving the accuracy and applicability of indirect measurement on slopes (Baret et al. 2010; Gonsamo and Pellikka 2009). A number of new platforms, instruments, and methods, such as laser scanning (Hu et al. 2018; Jupp et al. 2009; Tang et al. 2014a), cover photography (Macfarlane et al. 2007b), and within-crown clumping modeling (Hu et al. 2014; Hu et al. 2018), were recently employed or developed. The cost with hemispherical or cover photography became much less expensive than commercial instruments such as LAI-2000 and also made the success of indirect measurements (Chianucci and Cutini 2013; Garrigues et al. 2008; Ryu et al. 2010b).Two book chapters mainly introduce satellite remote sensing of LAI and clumping index (Chen 2013; Chen 2018), but a comprehensive review of indirect LAI measurement was not conducted since the reviews of Breda (2003), Jonckheere et al. (2004), and Weiss et al. (2004).
10
Fig. 2.2 Citation network on indirect LAI measurement since the 1990s
This study comprehensively reviews the development and status of indirect LAI measurement and related theories, algorithms, instruments, and influencing factors. The latest progresses and prospects are summarized and discussed by considering four challenges, namely, clumping/scale effect, LAD, woody component, and slope effect.
11
2.2
Basic Concepts and Theoretical Background
2.2.1
LAI definition
LAI is a dimensionless variable originally defined as leaf area (one side) per unit area of land (Watson 1947). This definition is suitable for flat leaves, but unclear for curly or needle-shaped leaves. Therefore, to clarify the notion of leaf area index, detailed definitions were proposed in relation to different applications and contexts. Representative definitions include “half the total leaf area” (Chen and Black 1991; Fassnacht et al. 1994), “half the total intercepting area” (Chen and Black 1992a), and “projected leaf area” (Myneni et al. 1997). The definition “half the total leaf area” pertains to biological processes, such as gas exchange, whereas “total intercepting area” concerns physical processes, such as radiation interception. The definition “projected leaf area” was disregarded because projection of a given area in one direction may differ in another direction when leaves are not flat, thick, or 3D-shaped. Meanwhile, the definitions “half the total leaf area” and “total intercepting area” make no difference for flat leaves, but may introduce large differences for leaves with concave shapes, such as curved or wrinkled broadleaves. Currently, “half the total leaf area per unit ground surface area” is the widely used definition of LAI (Chen and Black 1991; Chen et al. 1991; Jonckheere et al. 2004). Moreover, “ground surface area” is specifically defined as “horizontal ground surface area” to clarify LAI on sloping surface (Gonsamo and Pellikka 2008; Leblanc et al. 2005b). The definition “half the total leaf area per unit horizontal ground surface area” is suitable for all flat and needle-shaped leaves and flat and sloping surface and is friendly for applications.
Given the limitation of instruments and algorithms, indirect LAI measurements are influenced by the architecture of the canopy (e.g. clumping) and by the nature of the vegetation elements that are present, including woods, organs, stems, green or senescent elements. Thus, the measured quantity does not exactly correspond to the actual definition of LAI and additional denominations were proposed in the literature. First, the inversion of the Beer-Lambert law to retrieve LAI assumes a random spatial distribution of the foliage, which leads to the estimation of an effective quantity (effective leaf area index, LAIe) in clumped canopies like forests or row crops (Chen et al. 1991). Second, most of the optical instruments have only one visible band and cannot distinguish leaf and woody components; thus, the results obtained are plant
12
area index (PAI), which is the sum of the leaf and Woody Area Index (WAI) (Neumann et al. 1989). In addition, some distinctions can also be achieved between green leaves (GLAI – Green Leaf Area Index) and other photosynthetic organs that contain chloroplasts. The Green Area Index (GAI) considers photosynthetically active (e.g. green) plant areas without making differences between leaves, stems, and reproductive organs (Baret et al. 2010). Most users are interested in photosynthesis and carbon and energy exchanges; hence, the definition of LAI (GLAI and GAI) is preferred and widely used for remote sensing products, such as MODIS, GEOLAND, and GLOBCARBON (Baret et al. 2013; Myneni et al. 2002; Plummer et al. 2006). In most studies, LAI is almost the same as GLAI and GAI, especially when only green leaves are involved. However, PAIe and LAIe are generally different from LAI because leaves are generally clumped in most vegetations, and PAI is also relatively different from LAI in forests because of the presence of woody components.
2.2.2
Beer-Lambert Law and Gap Probability Model
The theoretical basis of indirect LAI measurement is the Beer-Lambert law, also known as Beer-Lambert law. It was originally used to describe the attenuation of light in uniform mediums and further extended to light interception of homogenous canopies (De Wit 1965; Monsi and Saeki 2005; Monteith 1965; Ross 1981). The classic relationship between LAI and gap probability was established as follows:
( )
G( )LAI/cos( )P =e− , (1.1)
where P(θ) denotes the gap probability in viewing zenith angle θ. Gap probability can also be written as gap fraction, where gap probability is close to theory and gap fraction is close to measurement. G(θ) represents the leaf projection function in the θ direction that can be calculated from the leaf inclination distribution, and cos(θ) is used for considering the optical path length through the homogeneous vegetation layer with random foliage distribution.
Leaves are considerably larger than the molecules in gas or liquid media, but this difference does not limit Beer-Lambert law for indirect LAI measurement because Eq. (1.1) can also be derived from contact frequency theory and binomial models that assume finite leaf size (Monsi and Saeki 2005; Nilson 1971; Wilson 1960). Here, Eq. (1.1) was validated in an accurately simulated homogeneous canopy with random foliage distribution (Fig. 2.3) to show
13
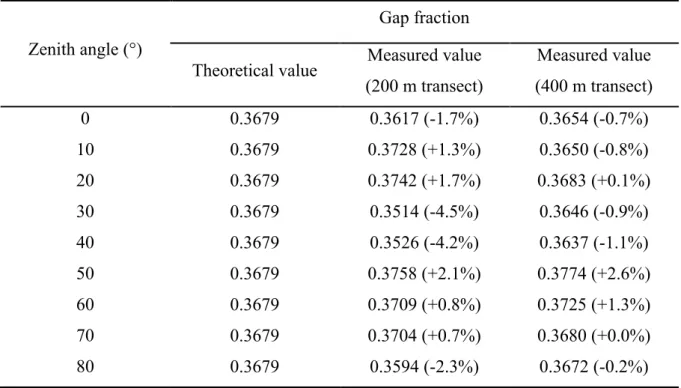
the accuracy of the theoretical derivation. In the fully controlled environment, the LAI of the canopy is known as 1 by definition and gap fraction could be measured accurately by ray intersection (Widlowski et al. 2013). For simplicity, leaf arrangement is totally horizontal, which provides G(θ)=cos(θ). Theoretical gap probability is consistent with the measured values (Table 2.2) with a difference of less than 5% for 200 m transects and less than 3% for 400 m transects.
Fig. 2.3 Overview of a 25×25 m² homogeneous canopy composed of 79577 randomly distributed disc-shaped green leaves with a radius of 0.05 m (LAI=1). The pink planes represent the measurement transects.
Table 2.2 Accuracy of Beer-Lambert law in homogeneous canopies for indirect LAI measurement
Zenith angle (°)
Gap fraction Theoretical value Measured value
(200 m transect) Measured value (400 m transect) 0 0.3679 0.3617 (-1.7%) 0.3654 (-0.7%) 10 0.3679 0.3728 (+1.3%) 0.3650 (-0.8%) 20 0.3679 0.3742 (+1.7%) 0.3683 (+0.1%) 30 0.3679 0.3514 (-4.5%) 0.3646 (-0.9%) 40 0.3679 0.3526 (-4.2%) 0.3637 (-1.1%) 50 0.3679 0.3758 (+2.1%) 0.3774 (+2.6%) 60 0.3679 0.3709 (+0.8%) 0.3725 (+1.3%) 70 0.3679 0.3704 (+0.7%) 0.3680 (+0.0%) 80 0.3679 0.3594 (-2.3%) 0.3672 (-0.2%)
Eq. (1.1) is the classic formula used to calculate LAI in a specific zenith angle. When measurements are conducted at several zenith angles, the final LAI becomes the integration of all zenith angles (Chen and Black 1991; Miller 1967):
14
( )
( )
( )
/ 2 0 2 ln cos sin LAI =
− P d . (1.2)If only the measurements at several discrete zenith angles are available, the final LAI can be weighted as follows: ( ) 1 n i i i LAI LAI W = =
, (1.3)where n is the number of discrete zenith angles, LAI(θi) denotes the LAI calculated at the zenith
angle θi, and Wi represents the weighting factor that is proportional to sin(θi)dθi and normalized
to sum to 1.0.
Several instruments were developed based on this theory for indirect LAI measurement; promising results were achieved in low crops, such as wheat and corn (Ross 1981; Welles and Cohen 1996; Welles and Norman 1991). These instruments underestimate LAI for 30% to 70% in field measurements when applied to a highly complex forest (Chen and Cihlar 1995b; Weiss et al. 2004). The underestimation caused by the clumping effect exists not only in forests, but also in row crops with an underestimation of 11% (Baret et al. 2010). Underestimation is critical, with an underestimation of approximately 20% to 60% when vegetation is small and row structure is significant (Demarez et al. 2008). The main error is caused by homogenous assumption, but the leaves are generally highly clumped in forests.
2.2.3
LAD and Leaf Projection Function
The community recognized the impact of LAD as early as the 1950s and 1960s, and a leaf projection function G was introduced to represent its impact on transmission and thus, on indirect LAI measurement (Monsi and Saeki 1953, 2005; Monteith 1965; Wang et al. 2007; Watson 1958)
2.2.3.1
LADLAD refers to the mathematical description of the angular orientation of leaves in the vegetation. It is defined as the probability of leaf normal falling within a unit interval of inclination angle. This function meets the condition as follows under the assumption of random distribution of the azimuth angles:
![Fig. 2.1 Yearly published items and citations related to indirect LAI measurement. (The search was conducted on March 18, 2018, using Web of Science with the keyword combination TOPIC: [“leaf area index” OR “plant area index”] AND TOPIC: (measur* OR esti](https://thumb-eu.123doks.com/thumbv2/123doknet/14459973.520302/33.892.263.635.97.432/yearly-published-citations-indirect-measurement-conducted-science-combination.webp)