Publisher’s version / Version de l'éditeur:
Vous avez des questions? Nous pouvons vous aider. Pour communiquer directement avec un auteur, consultez la
première page de la revue dans laquelle son article a été publié afin de trouver ses coordonnées. Si vous n’arrivez pas à les repérer, communiquez avec nous à [email protected].
Questions? Contact the NRC Publications Archive team at
[email protected]. If you wish to email the authors directly, please see the first page of the publication for their contact information.
https://publications-cnrc.canada.ca/fra/droits
L’accès à ce site Web et l’utilisation de son contenu sont assujettis aux conditions présentées dans le site LISEZ CES CONDITIONS ATTENTIVEMENT AVANT D’UTILISER CE SITE WEB.
Report (National Research Council of Canada. Division of Building Research); no. DBR-R-70, 1955-07-01
READ THESE TERMS AND CONDITIONS CAREFULLY BEFORE USING THIS WEBSITE.
https://nrc-publications.canada.ca/eng/copyright
NRC Publications Archive Record / Notice des Archives des publications du CNRC :
https://nrc-publications.canada.ca/eng/view/object/?id=bd72b867-aefc-4018-8096-56e0c97988f4 https://publications-cnrc.canada.ca/fra/voir/objet/?id=bd72b867-aefc-4018-8096-56e0c97988f4
NRC Publications Archive
Archives des publications du CNRC
Access and use of this website and the material on it are subject to the Terms and Conditions set forth at
Local Climate in the Ottawa Region: 1954 Boyd, D. W.
I 40 I 50 " I 0 , 7l.P 00 75 .30 • , 45•4ッGイイ]]]]]]]ZZZZZ]ZZZZZセZZMZZ]]]]ZZZZZZZ]]]]ZZZZZZMM]ZZZMM]]ZZZZZZZ[ZZZZZ]]]]ZZZZZ]]]]]]]]]]]]]]]セ 45 40
WE..ATHE..R STATroNS JkJ THE. OTTAWA RE.GION'
• PRE.C-lprTATIOf..J Of..JI...Y • PRE.C,JP1TATlot-J E, TEMp. i N. R.C.. 2 ROCKCLlFFE. .3 THE. AIRPORT 4 E.Xp. FARM 5 HOG'S BACK. (0 LE.M/E.UX IS. 7 CITY VIEW' 8 GATfNE.AU セ L.ONG IS • to MAt-JOTICI( H SI11RL.E..Y 5AY fZ AL5rON RD. 13 BAYVI
aw
14 f,JLUN(,$ fiR. 15 GLOUCE.5TE.R ゥセ 0 RL.E..AN 517
UNIV. OF O. I MMセGMMMMMMZWBGMMMセ 130 •.....
\ ... \", <; |ᄋᄋᄋᄋᄋMセャ ( <, :... 8•
2 .3 4 5 MIL.E.5 o I I ヲMMMMMMMMMMMMヲMMMNjMMMMMMM|MMMMMキセセMMMMMMGZNNMZMM⦅⦅⦅|⦅MMMMM⦅⦅ゥ 1'20 I 30 iMセMセMMMMMMKMMMMMM|MMMGGGG|MMMMMMMMMMKMM '20NATIONAL RESEARCH COUNCIL CANADA
LOCAL CLIMATE IN THE OTTAWA REGION:
1954
by
Donald Wo Boyd
Report No0
70
of the
Division of Building Research ottawa
PREFACE
This report is a further record of the detailed studies being made of the climate of the ottawa region by the Division of Building Research in connection with its over-all investigation of climate in relation to buildingo
The author, Donald W. Boyd, serves as full-time climatologist to the Division, being seconded to this post from his official position with the Meteorological Division of the Department of Transport by kind permission of
Mr. Andrew Thomson, Controllero This very close liaison between the two Divisions is a continuing source of satis-faction to the Division of Building Research.
The Division is most grateful to the volunteer observers in the ottawa district whose work has made the preparation of this report possible. It is hoped that when they see this record of the consolidated results, they will feel encouraged and realize that their own individual
observations are greatly assisting in the development of a clear picture of the climate of the Ottawa region.
ottawa July
1955
R. F. Legget, Director.
LOCAL CLIMATE IN THE OTTAWA regionセ 1954 by
Donald W. Boyd
INTRODUCTION
In 1954 there were ten weather stations in the Ottawa region that sent reports to the Meteorological
Division of the Department of Transport every montho Three of these reported wind, five reported temperatures and nine reported precipitation for each of the twelve months o Seven other stations were in operation for parts of the year but did not report every month.
The locations of all these stations are indicated on the map in Appendix Ao Some notes about their names, observers and exposures are contained in this Appendix.
Each part of this report deals with a single weather element and is based on the observations taken at all those stations whose records of that element are oomplete or nearly complete. It is very difficult to use incomplete records because some estimate must be made for the missing data. One day or one month can not be just Itleft outlt
because averaging the remaining data is the same as aS5Uming that the missing value is the same as the average0 A better estimate can usually be made. In many cases of missing
observations it is the observer himself who is best able to make a good ・ウエゥュ。エ・セ but too frequently he does not bother.
Instead, a clerk at the climatological office carefully averages the remaining observations and unconsciously makes the assumption that the missing day was an "average" one.
During 1.953 the Climate Services of the Meteoro= logical Division computed the average monthly temperatures and precipitations for the 30-year period, 1921 to 1950
inclusive, for all the Canadian stations that were reporting throughout this period. These 30-year averages are called
2
-ョッイュ。ャウセ The only station in the Ottawa region with normals for this standard period is the Experimental Farm. In
Report 46 (of the Division of Building Researchj NRC) for 1953, and in this report for 1954 the observations and the normals for the Farm are compared., to show how the curren.t year differed. from norm.al o In Report sセSV for 1952 the old normal temperatures and precipitations (based on observations from 1872 to 1937 from more than one station) were compared with the averages for 1952 of four stationso
PART ONEセ TEMPERATURE
Four Ottawa stations read and reset maximum and minimum thermometers at. least twi.:e a day, at 0730 and 1930
E.S.To, or as close to these times as is practicalc The minimum temperature reported for the day is the lower of the two
(or the lowest of the four) readings taken on that calendar day. In other words it is the lowest temperature in the
24-hour period ending at the time of the evening observation, The maximum temperature reported for the day is the higher of the readings taken in the evening and the next mor-n Lng
(or the highest of the four readings ・セ、ゥョァ with the one at 0730 E.S.To}o Thus it is the highest エ・ュー・イ。エャセ・ in the 24=ho'tU" period which does not end until the time of the observation the following morning. At Bayview the actual temperature is read each hour, The minimum temperature is the lowest of the
25
readings 「・ァゥイイイャゥイセ and ・ョ、ゥセセ at 2000 E.S.T o and the maxamum temperature is the highest of the 25 readings beginning and ending at 0800 EoS.ToExtreme Temper-aturea
Temperature reports from all the stations at Ottawa (including some which are now closed but whose observations go back as far as 1872) have been searched, and the highest and lowest temperatures ever reported in each month have been selectedo These long term extremes are
tabulated in the first and last lines of Table I.
The rest of Table I is based entiI>ely on the daily maximum and minimunl temperatures observed in
19540
Four different values セG・ tabulated for each station and for each montho The first and last ァイッオーウセ the monthly maximum and the monthly minimum, are, イ・ウー・」エゥカ・ャケセ the highest of the daily maximum temperatures and the lowest of the daily- 3 セ
minimum. temperatures in each montho The second and third
ァイッオーウセ the mean daily maximum. and the mean daily minimum, are the averages for the month of the daily maximum. and minimum. エ・ュー・イ。エオイ・ウセ respectivelys
No new long-term monthly maximum. or minimum temperature records were set or equalled during
19540
The nearest approach to a long-term maximum record was the50
degrees reported by Bayview in February and the nearest to a minimum. record was the38
degrees at the Experimental Farm in August. Each of these was four degrees from the corr-ea-ponding record.Mean Temperatures
The mean temperature for a day is often defined 。セ
the average of the maximum and minimumo Renoe the monthly
mean temperatures are the averages of the monthly mean da:iJ.y maxima and minima
o
These monthly means are shown in TableIIo
Since the values for Bayview were obtained in a different 1,.1SY (from hourly readings of an ordinary thermometer instead of from maximum and minimum thermometers) j) they have not been
used in computing the aver-age mean temperatures for エィセ r-egi cn , The ウ・セッョ、 section of Table
II
lists the differences between the mean temperatures for the individual at.at.Lons and the a.verage mean temperature f'or the region .i.n 19540 NoRoC o and Ro ckcLff'f'e reported temperatures above the av er-ag s in 6i.Ter ymonth but never more than one degree above averageo Tho
Experimental Farm and the Airport at Uplands were consistently below the average, with the exception of the Farm in Januar.TG and the differences were all less than one degreeo
The differences from the average for the whole year for these four stations are Ldst ed below" together Hith
the corresponding differences in the two previous years o
1952
.l2.?2.
125.!t
aカ・イ。セN.RoCo 0 0
3
0.2 004 003
Rockcliffe 0.2 0 0
5
00 7 0 06
Airport セPPR セPPNS セoッV -0 0
5
Exp. Farm -0 0
3
-0 03
-004
-0 ..3
In all three years Rockoliffe was the warmest, NoReC o ウ・」ッョ、セ
the Experimental Farm third, and the Airport the coldest ・l^セイMLエ in
1953
when it was the same as the Far-m, Such consd atient. values are not likely to be the result of chanceg they probablyrepresent real differences in the local climates of these four stat:tons ..
The monthly mean temperatures at Bayview are all about three degrees higher than the average of the other four stations o In view of the small differences among the other stations it seems doubtful that these three degrees are entirely due to a difference in the local climateo Part of the differences may be the result of differences in the methods of obtaining the mean temperatureso Bayview is in an urban district; the other stations have suburban or even rural ウオイイッオョ、ゥョァウセ and hence somewhat higher temperatures would be expected at Bayviewo
The monthly mean temperatures at the Experimental Farm in 1954 are compared with the normal mean temperatures
in the last section of Table 110 The differences from normal for the Farm will be very close to the differences from
normal in other parts of the region because of the relatively constant differences between the mean temperatures at the Farm and at the other stationso The two previous ケ・。イウセ 1952 and 1953y were three or four degrees above normalo In 1954 the average was back very close to normal with about half the months warmer than normal and the rest coldero January was
cold but February more than made up for it by being 905 degrees above normal0 The spring months were very close to
ョッイュ。ャセ the summer rather cool and the autumn a little warmer than usual.
Daily Temperatures at NoRoCo and rッ」ォeQAヲヲセ
In the reports for the last two years a detailed study has been made of the daily maximum and minimum tempera= tures at NoRoCo compared to those at Rockcliffe o The 1953 results and the results of a similar study of the 1954 observations are plotted in fゥァセN IA and IBo Each plotted point represents the mean value of about 15 readings of the maximum (or minimum) temperature at Rockcliffe and the mean value of the corresponding differences between the maxima
(or minima) at NoRoCo and Rockcliffeo
The 1952 study suggested that the rather protected position of the observing station at Rockcliffe resulted in
somewhat higher maxima at that station in warm weather and slightly lower minima in cold weather o The concentration of points for both 1953 and 1954 below the zero difference line for maximum temperatures over 55°F in Fig o IA confirms the first suggestion that Rockcliffe maxima are higher than those at NoR.Co in warm weathero The plotted points for minimum
temperatures below zero in Figo IE are too few to be conclusive ..
"" 5
=PART twoセ PRECIPITATION
Measurements of rainfall and snowfall are made two or four times a day at most of the Ottawa stations at the same times as the thermometers are reado The precipitation day is the same as the maximum temperature dayo That iS9 the total precipitation for the day is the sum of all the amounts which fall from 7030 EoSoTo in the morning until the 7030 ッ「ウ・イカ。セゥッョ
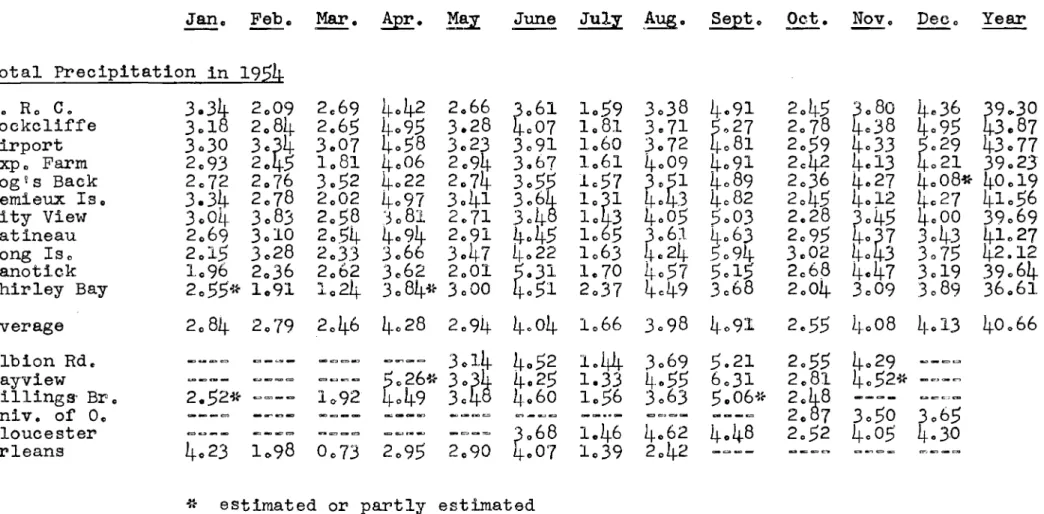
on the morning following the day for which they are raperteao Total Precipitation
Nine stations in the ottawa region reported rafn and snow for every month in the year
19540
The monthly totalprecipitations (ioeo the depths of snow divided by tens plus
the actual rainfalls) for these stations are tabulated in Table 1110 Two other stations9 that missed only one or two months9 were also used in computing an average for the region o The amounts for the missing months had to be estimatedo These
estimates are not reliable as values of total precipitation for those particular stations in those particular months9 but they do lead to more reliable values fer the total precipitations
for the year and the averages fer the regiono The available data for six other ウエ。エゥッョウセ with less than ten ュッョエィウセ records s are
also given at the bottom of Table IlL
Table IV lists the differences between the total
precipitations'at the individual stations and the average for the region in
19540
In the reports for1952
and1953
it wasremarked that the summer precipitation showed more variations from station to station than the winter precipitationo This is not borne out by the differences for
19540
Differences from the average of over an inch occurred in each of f・「イオ。イケセ Marchs June, September and Decembero The most consistent precipitationin
1954
was in July and in October., The difficulty of measur-Ing snow accurately may have some bearing on these large 、ゥヲヲ・イ・ョ」・セウand9 of course, larger variations would be expected this year
because of the greater number of stations.,
On the total for the year the two airports (Rockcliffe and Ottawa Airport) head the list with more than three inches above the average for the eleven stationso Shirley Bay is the lowest with four inches below the averageo No simple precipi= tation pattern for the region is suggested by these ヲゥァオイ・ウセ
probably because it is masked by larger random var-Lat Lons ,
There are more data9 of course, for the first four stations0 If the total annual precipitation for these four is
- 6 セ
averaged and subtracted from the individual r-eadI.ngs , for each of the last three ケ・。イウセ the following "\Talues are ッ「エ。ゥョ・、セ
1952
1953-
セ
Average N.ReC.-0.86
-2066
セRLNRT='
·,L.O92 Rockcliffe1.25
1090
...セッ SGセ1,,83
_' Airport1019
001.2 2023 1018
Exp .. Farm-10.59
0.65
- 2..3"1.J. .-10 0 8These are not as consistient as the corresponding temperature differencesj but the average differences of almost two inches
probably mean that N"RoCo is drier and Rockcliffe wetter than the city as a whole. The average differences of just over an inch at the Experimental Farm and Ottawa Airport may not be significant.. They show at least that several years records will be needed to show a consistent pattern for ten or mor-e
stationso
The monthly total prec.ipitations at the Experimental Farm in
1954
are compar-ed with the normal to·tal precipitationsin the lower section of Table IV.. The year as a whole was
fairly wet with more than four inches above the normal precipiE o
tatLon , This excess was spread fairly evenly amongst; the months of April, aオァオZSエセ September)) November and December- all of which were between one and two inches above nor-maf., March was relatively dryセ but per-haps the best remembered month will be the dry July when less than ha.lf the normal rainfall
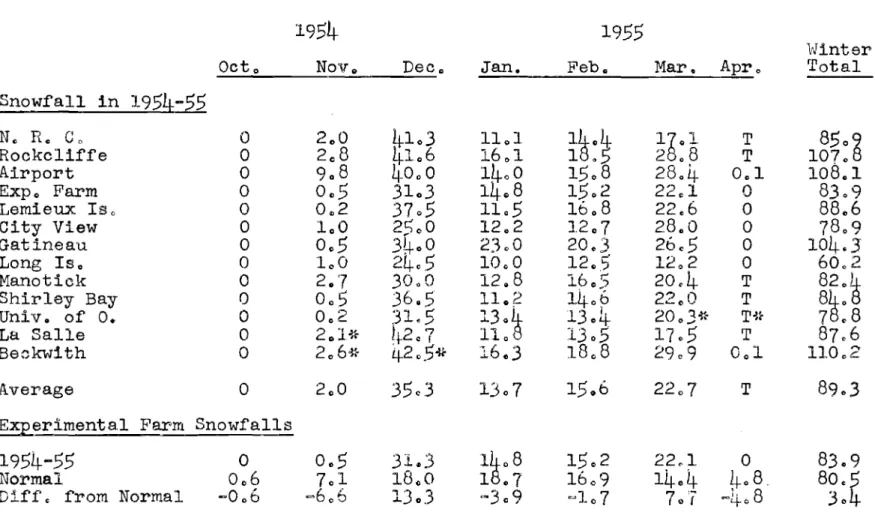
occurred .. Snowfall
During the winter of
19.54-55
there was ten stations in the ottawa region that reported snmill every montho Three additional stations had incomplete snowfall イ・」ッイ、ウセ two were established after the first snowfall, the other one did not report in March or Aprilo The monthly snowfalls and the totals for the winter are shown in Table V, including estimates for the missing reportsoAs in the previous winter the snowfall at the two airports was considerably heavier than at most of the stations o It has been suggested that the 、イゥヲエゥイセ at such exposed ャッ」。セ
tions may tend to increase the measured snowf'aLl, , but this is
open to question o It was noted last year that stations far from the Ottawa River had somewhat lighter snowfalls and again this winter the reports from City View, Long Island and
Manotick are below the average f'or: all thirteen at.at.Lons ,
The normal monthly and winter snowfall at the Experimental Farm and this winter's differences from normal
= 7 ..
are shown at the bottom of Table V" The total snowfall for the winter was only 3,,4 inches above normal but much of the snow was concentrated in December and Marche hッキ・カ・イセ the 31e3 inches in December was far from being a イ・」ッイ、セ 3808 inches was reported by the Experimental Farm as recently as December 19420
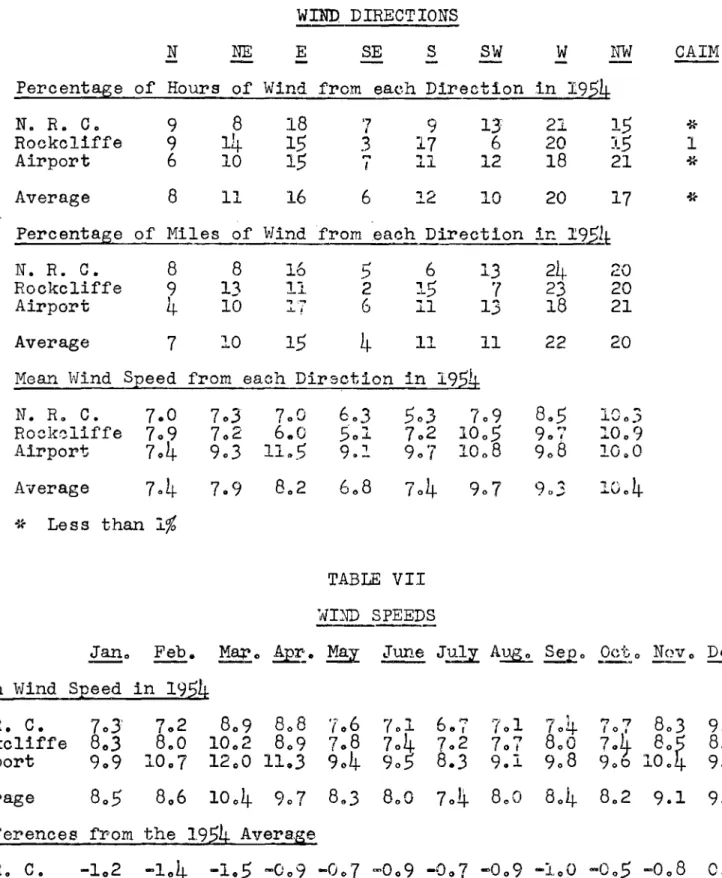
PART tiヲヲゥeeセ WIND
Three of the Ottawa stations have cup anemometers which record the number of miles of wind in each hour9 and the prevailing direction for the houre The data in Tables VI and VII are all based on these hourly wind speeds and 、ゥイ・」エセ
ions"
Table VI shows the percentages of hours and of miles and the mean speeds of the winds from each of the eight directions for the two airports and for NoRoC" In 1954 west winds were the most frequent in ottawa on the basis of hours or of miles, and northwest winds came second" The differences in frequencies between stations seem to be mostly random" The very frequent west winds at NoRoC" in 1953 were replaced by only very slightly above average frequency in 19540 The very infrequent south winds at Rockcliffe in 1953 were replaced by
more than average frequency in 19540
The wind rose in Fig" 2 shows how the direction frequencies in 1954 at Ottawa Airport differed from the ョッイュ。ャセ
which is based on only seven years records" West and northwest winds were slightly more frequent than normal and southwest winds were less frequent" The other directions were either normal or fairly infrequent"
The mean wind speeds for each direction shown in the last section of Table VI are much more consistent than the
frequencies" Winds from the northwest. west and southwest averaged almost 10 m"poh" in both 1953 and 1954e East winds were almost average at about 8 m"p"h" both years and the rest were relatively light" At Ottawa Airport the strongest average in both years was over 11 mopoh" from the east"
The mean wind speeds for each month in 1954 with their averages and the differences from the averages are listed in Table VII" As usualj the stronger winds
(8
05
mepoh o andover) occur in the winter and early spring and the lighter
winds in the warmer seasons" The differences from the averages are quite similar to those for 1953. except in December when the wind speeds were rather unusual" In the other months N"RoC"
=
8
<=>winds were always from
005
to105
mopoh o below the 。カ・イ。ァセッThe Rockcliffe winds were all less than one mopoh o below the average and the Airport winds were mostly between 1 and 2 mopoho stronger than the averageo
CONCLUSION
Changes in the monthly values of temperature and precipitation can be concisely presented by means of a
hythergraph (Figo
3)0
The position of each month on the graph is determined by its mean temperature and its total ーイ・」ゥーゥエ。Gセtiono The normal values for the Experimental Farm have been plotted in small circles in the last figure and the actual values in
1954
are at the points of the arrow-so Thus each arrow indicates by its length and direction the departure of that month from the normal precipitation and temperatureo Arrows pointing to the left indicate dry months such as July and March and those to the right indicate wet months o Arrows sloping upwards are warm months such as February0 Thosesloping downwards like July and September are coolo
It can be seen that the yeat· as a whole was quite weto The year
1952
was similarly wet but1953
was drier oFrom the hythergraph it is also e'lT:1dent that the mean t empera-ture for the year
1954
as a whole was セ・イケ close to ョッイュ。ャセwhereas
1952
and1953
were thr'ee or four degrees 。「ッセ・ normal0 No -exbr-eme t.emper-at.ure records were established in19540
As in pr-evLous years the Airport and the Exper-Lmenta.LFarm were somewhat cooler on the average than Rockcliffe or" NoRoC0 The significant difference in local climate キィlセィ can
occur between stations only about a mile apart 1s illustrated ·by Fig o 1 Ao
No simple pattern of total precipitation is yet apparent from the single yearITs data for eleven stations nor from three yearsG data for four stationso However9 the
snowfall reports for two winters suggest that the snowfall may be somewhat heavier near the Ottawa Rivero
APPENDIX A
Weather stations within the limits of a cl"by are generally given the name of the city followed by some other name, in brackets, to indicate the section of the city in which the station is located. In the body of this report the name Itottawalt and the brackets have been omitted, but the full names are used in the following list0 In Meteorological"
Division publications the name "Airporttt is abbreviated to "A"0 ottawa (N"R.. C.) is at the Montreal Road Labor-abor-Les of the National Researcn Councilo The thermometer screen and rain gauge were moved a few hundred yards in July
1954
froman elevation of
332
feet to 320 feet above sea level o The observations are taken twice a day by personnel of the Division of Building ResearchoRockcliffe (Airport) is only 10 1 miles northwest of the N.. R.C. station but it is more than 100 feet low-ere The elevation is only 204 feet above sea ャ・カ・ャセ Weather
observations are taken every hour by personnel of the rッcッaッfセ
ottawa (Airport) 1s at Uplands at an ele"iTation of
357
feet above sea levelo > Weather observations are t akenevery hour by personnel of the Meteorological Division of the Department of Transport.
ottawa (Experimental Farm) is at the Central
Experimental Farm at an elevation of 260 ヲ・・エセ The observa= tions are taken twice a day by personnel of the Department of Agriculture ..
Ottawa (Hog!s Back) is at the home of Dr. AoReGo Elmslle near Riverside Drive.
ottawa (Lemieux Island) Is at the Ottawa Water ,Purification and Pumping Station. The observations are
taken by personnel of the City Water Works Department o
City View is at Borden's Ottawa Dairy Farm on the Merlvale Road.
Gatineau is at the mills of the Canadian International Paper Company at Gatineau, qオ・「・セ・
Long Island Is at the Long Island Loeks on the Rideau Canalo The observations are taken by persorulel of the
Manotick is at the home of Dro N.Lo Nicholson on Long Island.
Shirley Bay is at the Department of Transport Ionosphere Station at Shirley Bay.
ottawa (Albion Road) is at the Radio Field Station of the National Research Council on the Albion Road o The observations are taken by personnel of the Division of Radio and Electrical Engineering o
ottawa (Bayview) is on the property of the City of ottawa Engineering Department on Bayview Road. Observations are taken by the Engineering Department using their own instruments0
ottawa (Billings Bridge) is at the home of
Mr. B. Cornwall on the Metcalfe Road.
ottawa (University of Ottawa) is at the south end of the University of Ottawa Ovalo The Institute of Geography are responsible for the observations o
Gloucester is at HoMoCoS. Gloucester, southeast of Ottawa. The observations are taken by personnel of the Royal Canadian Navy.
Orleans (Vehicle Proving Ground) is at the Proving Ground of the Vehicle Development Branch of the Department of National Defence near the Montreal Road.
TABLE I
extreセセ TEMPERATURES
Jan. Feb. セN Apr. May June July セN Sept. Oct. Nov. Dec. Year
LOng Term Maximum
54 54 80 87 95 98 101 100 102 87 75 61 102 Monthly Max1mUlTl in 19$4 N. R. C. 37 fr5 47 78 80
セセ
86 89 76 76 59 37 89 Rockcl1ffe 38d
ttl
79 79 88 90 77 76 58 37 90 Airport 37 79 77 85 88 89 78 76 59 36 89 Exp , Farmal
45 46 77 76 83 86 88 77 76 58セセ
88 Bayview 50 46 80 82 86 92 92 77 77 60 92 Univ. of O. 77 58 36Mean Daily Maximum in
195k.
N. R. c. QUNセN 30.9 32.7 51.7 64.4 7a· 5 7607 74.7 63.] 57.0 42.0 26.0 Rockcl1ffe QセNR 31.1 33.2 52.2 64.5 7 .2 77.(:. 7
4
.4
63.7 57.3 41.8 25.9 Airport 1 .3 29.8 31.9 51.1 63.[\ 73.2 76.9 7 e7 63.2 56.5 41.5 25.4 Exp , Farm 1L,.9 30.0 32.2 50.3 63.3 73.0 76.5 WャエMNセ 63.3 56.5 41., 25.5 Bayview 17.! 33.0 34.6 53.2 66.5 76.3 79.7 77.3 65.8 59.0 43. 28.] Univ. of O. S8.3 42.1 26.1Mean Daily Minimum in QYUセ
N. R. C. 0.0 1,.5 19.1 32.8
44.c
57.0 57.6 5502 48.8 42.3 31.0 12.7 Rockcl1ffe -0.5 1 06 19.2 32'4
43.8 57.3 58.1 56.149·t
42.9 31.6 14.1 Airport -1.0 1405 1705 31. TRNセ 55.7 55.7 54.0 47. 40.6 2908 ll.3 Exp , Farm -0.3 QセNS 18.1 32.1 42. 56.3 55.7 5307 48.0 41.1 30.5 rr, 7 Bayview 3.2 1.6 22.6 35.8 47.2 60.] 61.6 59.1 51.6 45.6 33.8 16.8 Univ. of O. 43.] 30.8 15.6 Monthly Minimum in 1954 N. R. C. -20 -20 .5,
32 49エエセ
42 37 29ゥセ
-7 -20 Rockcl1ffe -23 -24 6 32セセ
Wi-
39 31 -5-24-Airport -21 -21
t
2 30ヲイセ
Tセ
35 26 17 -7 -21 Exp , Farm -23 MRセ 3 3148
セX
セV
27 18 -9 -25 Bayview -16 -1 ...,
7 37 50 50 32 19-1:-
-16 Univ. of O. 30 18 Mセ--Long Term Minimum
_':l!..tJ , -35 -34 Mセ 21 33 38 34 24 9 -23 -38 -38
TABLE
I Iセャャゥan temperatエセs
Jan.
Feb" Mar"Apr"
MayJune
July
セッSept ..
Oct.
Nov.
Dec"
Year
Mean Temperature in 1954
N. R.
c.
7.7
23.,2
2509
Lt2
03
54,,2
65.2
67.2
64.9
56 00
49.6
36.5
19.4
42.7
Rockc1iffe
70t
22.8
26,,2
42 02
54.2
VセッX67.8
VセッX56.6
セoNャ36.7
20.0
4300
Airport
6 0
22.2
24·7
41.2
53.1
6
.t
66.3-
6 .4
55·t
8.6
35,,6
18·t
41.7
Exp ,Farm
7.6
2202 25.2
41.2
5300
64.
66.1
64.0
55.
48.8
35.9
18.
41,,9
Average
7.3
22,,6
25,,5
41,,7
5306
65.0
66,,8
64.8
55.9
49.3
36.2
19.1
42.3
Bayview
10.2
25,,8
28.6
4405
56.8
68.2
7006
68.2
58.7
52 .. 3
38.6
22·4
45.4
Univ. of 00
50.7
36.4
20.9
Differences from the 1954 Average
No R.
C0.4
0.6
0.4
0.6
0,,6
0.2
0.4
0.1
0.1
0.3
0.3
0,,3
0 04
Rockcliffe
0.1
0,,2
oッセ0.5
0 .. 6
0 08
100
1 00
0.7
0.8
005
0.9
0,,7
Airport
-0,,7
-0,,4
セッ..
-0.5
=0,,5
=006
セッLLU MッNセ-0.5
=0.7
-006
-0.7
-0 06
ExpoFarm
0.3
-0 .. 4
-0.3
=0.5
-0.,6
-004
-007
セoッ セPNS-0.5
MッNセ-0.5
-0,,4
Bayview
209
3,,2
3,,1
2,,8
3 02
3,,2
3,,8
3.4
2 08
300
20
.
303
3 01
Univ. of 0..
1.4
002
1 08
Experimental Farm Mean Temperatures
1954
706
2202
25.2
lセャN2
5?,,0
64.6
66
0 164.0
55 06
48.8
35.9
18 06 41c9
Normal
12 00
12,,7
2502
lセPNU5402
VlセP1
6806
6604
58 0
%
4601
33 00
1704
4106
TABLE III
TOTAL PRECIPITATION
Jan.
Feb.
Mar.Apr.
Mq
June
July
\セNSept.
Oct.
Nov.
Deco
Year
Total Precipitation in 1954
Non,
Co
3.34
2009
2
0 6 94042
2.66
G
06I
1 059
3038
4.91
2045
)080
4,,36
セY..30
Rockcliffe
3.18
208l
t2.65
4095
3.28
007
1 081 3,,71
LセRW2078
4.38
4.95
3.87
Airport
3030
3.,4
3007
4.58
SNRセ3091
1 060 3072
081
2059
4033
4029
43077
Expo Farm
2093
2 0 ;) 1 081 4.06
2 09
3
0 6 71 061 4009
4091
2
0 4 24.13
021
39 0
23 hッァセウBack
20
722
0 7 63052
4022
2074
Sッsセ
1057
SセTQ4089
20
3
6
4..
27
4008* 40019
Lemieux Iso
3.34-
2078
2002
4097
3041
306
ャッセャ4.
34 082
2045
40;12
4
027
41056
City View
300LI·
3 083
2058
';081
2 071 304
10 34005
:::>0 .
r-'03
2.28
3045
4000
,39069
Gatineau
2069
3 010
2 0
.54
4094
2
0 9 14045
1
0 b 5eo
61
4063
2095
4 0
47
3043
41027
Long Iso
2 0
15
3 028
2 0
333066
3047
4022
1 063
. ,,24
5094
3.,02
40
33075
42.12
Manotick
1 096
2
0 3 62062 3.62
2001
4°3
1
1.. 70
4057
50
15
2068
4.47
3019
39064
Shirley Bay
2 055-lt- 1
0 9 11
0 2 4 SPXTMャセ3000
051
2037
4049
3
06 82004
3009
3089
36 061
Average
2084-
2
0 7 920
46
4028
2094
4.04
1066
3098
409:1
2 ..55
lセPPX4
013
40066
Albion Rd.
セセセセ 3014-
4052
1 ..44-
3
069
5.21
2055
4 029
セM]]Bayview
セPRVゥエM
3
PTセ
4.25
1.33
4..
55
6.31
2 081
TPUR_セ Mセ^MセBillingS' Br 0
RNUR_セ ==--1
0 9 2049
30
4
060
1056
3 063
UNPV_セ RLLセX MMセM "Und.v ,of O.
」ZG_⦅NBセ セ⦅。B⦅ 」ZZZ[Iセ」]ッセ20 7
3050
セPVUGloucester
セPVX1.,46
4062
4048
2.22
4005
.. 30Orleans
4 023
le>98
0 0
732095
2.90
.. 07
1039
2042
*
estimated or partly estimated
TABLE IV
PRECIPITATION DIFFERENCES
Jan .. Feb., Mar .. Apr .. Maz
- -
JuneJuly
Aug" Sept 0 Oct .. Novo-
Dec. YearDifference from the 1954- !verage
No R" Co 050 セPWP 023 014 セPRX =043 セPPW セPVP 0 =010 セ .. 28 023 セQLLSV Rockcliffe
:4t
005 019 067 034 (>03 015 =027036
023 ,,30 082 3 ..21Airport
..5t
061- ,,30 ,,29 =013 セPPV -026 "010 004 025 1 016 3.11Exp., Farm 009 =.3 セ セッVU セPRR 0 セ ..セW セPPUM ,,11 0 =013 005 008 =1,,43
Hogqs Back = ..12 e,01..1'"3 1006 =006 セGッ 20 =0
9
セGッPY セPTW ",,02 -=" 19 e19 ]ッoセゥJL セo 04-7Lemieux Is" 050 =.. 01 =0414- 069
Q47
Co040 e" 035 045 =Q09 =010 004 014- 0.,90City View. .20 10 0 4
Q12
<'047 =023 GセPUV ·'023 Q0'7t .,12 =,,27 =063 eoo13
セoPY_Gatineau = ..
15
ッセャ .,08 066 e=o 03 041 "oOl =.,37 =028 04° .. 29 = ..'70 ッセVQLong Is., セLLLVY ., 9 e,,,
13
セッVR .. 53 ,,18 " 03..
.
,,26 100;3 .,41'''' 035 =,,381046
ManotiC'k セPXX ]PセS " Lo =066 <>,,93 1 027 004 059
,,24
013 039 =c9tt- セGQNL 02Shirley Bay elf)RYセス =., 8 =l c22 <
,,44
ii- 006 eJ4-r;'i.. 7i
,,51 セQLLRS =0,1)1 =099 =024 <=L·r-0ns
セAlbion Rd" c20 048 =022 セG・RY oJO 0 021 Bayview eYXセス eセd .. 21 =,,33 cj (イZZGセM 1 0
40
.. 26
044*
Billings Br Q =03201<- ・セNUT ,,21 .. 54,,56
=.,10 セセッjU e QU\Sセ =007 Univ" of 0" e , c:3'"1 = e58 =048 Gloucester セGLLSV =020 06It=Q4]
\セッ 03 =,,03- 017 Orleans 1,,39 =,,81 =1.,73 =1,,33 ]ッッlセ セPS 0,,27 " :.".;b Experimental Farm Total Precipitations_1954 2 093 2 04.5 1,,81 4,,06 2,,94 306'( 1,,61 )-!-009 4,,91 2,,42 401.3 4 021 3--:J. 2,3 Normal 2
Q67
2 020 2.,81 2062 2 0Xlセ 3 ..Tセ
305'3 2 0-97 3012 2070 2097 3,,03 3'」Kセeo
' fDiff" fro Normal 0026 0025 =1,,00
lJtlt
0.,10 002 セGャッYR 1 012 QセWY =0,,28 1.16 1,,18 Li v 3 4セZ .. estimated or partly estimated
TABLE V SNOWFALL
1954 1955
l'Jinter
Octo Novo Deco Jan. Feb o Mar. Apr. Total
Snowfall in 1954-55 No Ro Co 0 2,,0 4103 11 01
QセPT
QセPQ T XUPセ Rockcliffe 0 20 841
06 16 01 1.5
2 .8 T 107. Airport 0 90 8 40.0 1400 1508 2804 001 10801 Exp .. Farm 0 0 .. 5 31 e3 14 .. 8 15.2 22,,1 0 83.9 Lemieux Iso 0 0,,2 3705 1105 160 8 2206 0 88,,6 City View 0 1 00 2C:;00 12 02 12,,7 2800 0 78 09
Gatineau 0 005
34..
0 23.0 20.3 26.5 0 104.3 Long Iso 0 1 00 2405 10.0 1205 120 2 0 60.2 Manotick 0 2o ,'7 30.0 12 08 16,,5 20.4 T XRッセ Shirley Bay 0 0 05
36.5
11 02 1406 22,,0 TXセN
Univ. ofo.
0 0.2 31.5QSッセ
...'3
el,4:- 20 03* tセH 7 ,,8 La Salle 0 2 セMエセL It2 07 11013
r- 17.5 T 87.6 ..jNLLセ , 0::;>Beckwith 0 20 VセM
4-
2o.t) -ii-16 ..
3 18 082909
0 01 11002Average 0 2 .. 0
3503
1307 150 6 22 07 T 89.,3Experimental Farm Snowfalls
1954-55 0 0.,5
31.3
QセPX 150 2 22.1 0 83.,9Normal 006 7 01 18 00 1 e7 1609 14,,4 セエッ 8, XPNセ
Diff. from Normal セPPV =60
6
130.3 セS .. 9 =10 7 70'7 セKッ ,. 8 30tセ Trace of less than 0 ..1
0)(-0 Est.imated
TABLE VI WIND DIRECTIONS
N NE E SE S SW
w
NW CAlMPercentage of Hours of Wind from each Direction in
1954
21
15
2015
18 21 N. R. C. Rockc1iffe Airport Average 9 9 6 8 814
10 11 1815
15
16 '7I3
.... I 6 917
11 1213
6 12 10 2017
*
1*
*
Percentage of Miles of "Hind from .each Direction fro. 1951l:
N. R. C. Rockcliffe Airport Average 8 9
4
7 813
10
10
16
1115
.5
2 64
615
11 11 13t
13
1124
23
18 22 20 2021
20Mean Wind Speed from each Direction in
1954
N. R. C. 7.0 rッ」ォセャゥヲヲ・ 709 Airport
704
Average7,,4
*
Less than ャセ 703 700 702 6 .. 0 903 11,,57.9
8
026
0 8 1003
1009
10.0.. " 4
J..lJe TABLE VIr WIND SPEEDSJan" Feb. Ma:ro Apr:. May セ Juq aセ セB セNッ Novo Deco Year Mean Wind Speed in
1954
N .. R. C. Rockc1iffe Airport Average 702 80 9 80 8
8..
0 100 28
0 9 100 7 120 0 11.38
0 61004
907 '106 ?ol6 .. 7
7
0 8704
702
904 9058.3
8,,3 800 704-7048
00 9,,8 804
707
8
0 3 7ッセ 805
900 1004 8,,2 9.1Differences from the 1954 Avera,ge
N. R. C. -10 2
Rockc1iffe
-002
1·0
0
19530
.
0
1954 セ 1·5u
0
o
0
0
a:
f/) 0 0:::>
C
[JDC
[Jz
i
Moセ [J 0oC
0
00 0 [J [J [J 0 0 0 0PセX
Co
0 セC
a:
-1·0 0 0 0 0oB
z
0 -1,50
00 -10 0 10 20 30 40 MAXIMUM TEMPERATUREFIGURE
IA
DIFFERENCES OF MAXIMUM TEMPERATURES
1053 1954
o
Co
o
[J 0°
{jセ
COn
[]o
C'?JOO
COo
o
o
[Jo
1·5 [].
x
1-0u
a:
(I) 0'5:::>
セ
OJ---o---{]---=---i
セセMPNU
z·
-1-0°
- 10 0 10 20 30 40 MINIMUM TEMPERATURE ATFIGURE
IB
E
NORMAL:---1954 :
s
FIGURE: 2
PERCENTAGE OF WIND FROM
o
4 5 80 70 CoO ,-... LL 050 u.J ct ::J t- 40«
cl u.J セSP uJ....
>- '20 :J ::z: I-Z 10 o セ セ 0 aLl セ -10 -'20 .JUL..'Y ,.. ... r'l.r::..- ! AUG "'IIIfセ| OセneN
r»:
SE.PT. MAY Lセ セt ... "7f:;{/
oc. .
I APR. .J. -\'\
\
NO\!·..,
"
\"
' r ... MAR.1.
I 'III .... -" I'1/
11o
E..c, •....
FEe,. / v セ --c(/ JAN. セ 70 (00 50 40 30 20 10 o -10 -'20o
I 2 3 4 5MEA..., MONTHLY TOTAL PRf.CrP1TATION(INC.I-IES)
セigurエN
3
HVTHERGRAPH
r:OR OTTA\v'A,
EXpo
FARM
QセUTM COMPAREO TO AVe..RAGE. FOR 192/-/9.50
NORMAL
1954-oャMMMMMMMセ