Diagnosing Inertial Confinement Fusion Implosions at OMEGA and the NIF Using
Novel Neutron Spectrometry
by
Daniel Thomas Casey B.S. Nuclear Engineering (2005)
University of New Mexico
SUBMITTED TO THE DEPARTMENT OF NUCLEAR SCIENCE AND ENGINEERING IN PARTIAL FULFILLMENT OF THE REQUIREMENTS FOR THE DEGREE OF
DOCTOR OF PHILOSOPHY IN NUCLEAR SCIENCE AND ENGINEERING AT THE
MASSACHUSETTS INSTITUTE OF TECHNOLOGY February 2012
©2012 Massachusetts Institute of Technology. All rights reserved. Signature of Author:_____________________________________________
Department of Nuclear Science and Engineering February 15th, 2012 Certified by:___________________________________________________
Richard Petrasso Senior Research Scientist Thesis Supervisor Accepted by:__________________________________________________
Ronald Parker Professor of Nuclear Science and Electrical Engineering Thesis Reader Accepted by:__________________________________________________
Mujid S. Kazimi TEPCO Professor of Nuclear Science and Engineering Chair, Department Committee on Graduate Students
2
Diagnosing Inertial Confinement Fusion Implosions at OMEGA and the NIF
Using Novel Neutron Spectrometry
by Daniel Thomas Casey
Submitted to the Department of Nuclear Science and Engineering
on December 9, 2011, in partial fulfillment of the requirements for the degree of Doctor of Philosophy
ABSTRACT
A novel neutron spectrometer, called the Magnetic Recoil Spectrometer (MRS), was designed, built, and implemented on the OMEGA laser facility and the National Ignition Facility (NIF) to measure the neutron spectra from inertial confinement fusion (ICF) implosions. Using the MRS, the down-scattered neutron (DSn) spectrum has been used to infer the areal density (ρR) of ICF
implosions for the first time. The DSn technique is essential for diagnosing high ρR (>180mg/cm2) cryogenic deuterium-tritium (DT) implosions, where most other methods fail. The MRS has helped to guide the cryogenic campaign toward the highest ρRs ever achieved at OMEGA. In addition, the
MRS is currently being used to diagnose the DSn spectrum from cryogenic implosions at the NIF during the beginning phases of the National Ignition Campaign (NIC). MRS data have already been essential for tuning these implosions to the highest ρRs ever achieved in an ICF implosion
(>1 g/cm2), and thus for guiding the NIC toward the realization of thermonuclear ignition. The first measurements of the T(t,2n)4He (TT) neutron spectrum in DT implosions at OMEGA have also been conducted using the MRS. The TT-neutron (TTn) spectrum was measured at low reactant central-mass energies of ~23 keV. The results from these measurements indicate that the TT reaction proceeds primarily through the direct three-body reaction channel, which is in contrast to the results obtained in higher energy accelerator experiments. Measurements of the TTn and DD proton yields were also conducted and compared to the DT neutron yield in DT implosions. From these measurements, it is concluded that the DD yield is anomalously low and the TTn yield is anomalously high, relative to the DT yield. These results have been explained by a stratification of the fuel in the core of an ICF implosion.
Thesis Supervisor: Richard D. Petrasso Senior Research Scientist
Plasma Science and Fusion Center, Massachusetts Institute of Technology
3
Acknowledgments
First, I thank my advisor Richard Petrasso whose enthusiasm and scientific rigor are both motivating and, at times, even awe-inspiring. I also thank Johan Frenje, whose leadership of the OMEGA and NIF MRS projects directly led to their successful realization and whose supervision of my thesis research, was both supportive and educational. I also thank Johan for carefully reviewing this thesis manuscript. I am most appreciative for the many contributions of the entire high-energy-density physics division at MIT. This includes Fredrick Seguin, whose masterful experience and attention to detail was essential for many aspects of this project, including the development of the novel processing techniques of the MRS systems. I also thank Fredrick for his efforts in developing and maintaining the microscope and data analysis systems for all of the MIT diagnostics, including the MRS. I thank Chikang Li for always being available for questions and being supportive of this work. I thank Maria Gatu Johnson for developing powerful new analysis techniques and taking over most of the OMEGA and NIF MRS related responsibilities, while I was writing this thesis. I also thank my good friends Nathan Howard, Mario Manuel, Nareg Sinenian, (and so many others they cannot all be named here) for illuminating conversations both on physics and all facets of life. I also thank Jocelyn Schaeffer, Irina Cashen, Robert Frankel, and Ernie Doeg, who skillfully managed many aspects of the MIT etch/lab and are responsible for much of the data processing that was required to both commission the MRS diagnostics and perform the experiments described in this thesis.
This thesis work could not have been possible without the enormous support it received from LLE. The OMEGA operations, engineering, and scientific staff, along with their management, all supported this project. I thank David Meyerhofer and Craig Sangster for supporting the MRS projects, Vladimir Glebov for countless ride-along shot opportunities, Radha Bahukutumbi for enormous simulation support, and Michelle Burke and Joe Katz for managing the OMEGA MRS and the LLE etch/scan lab. I thank Jeff Ulreich and Bill Owens for providing the engineering support of the OMEGA MRS system. In particular, I also thank Sam Roberts, without whom, the OMEGA MRS would not have been successful. His experience and knowledge of OMEGA and its diagnostics are responsible for much of the success of this project. In addition, Sam’s resilience and strength, after his terrible accident, will forever continue to inspire me.
At LLNL, I am very appreciative to Richard Bionta and Mark Mckernan for their support and for establishing and flawlessly running the LLNL MRS etch/scan lab. I also thank Mark for designing much of the NIF MRS detector hardware. I also thank Rick Ashabranner and Jason Magoon for their engineering support of the NIF MRS. I also thank Rick for his continued support of the NIF MRS. I also thank Dennis McNabb, whose involvement in the tt project contributed enormously to its success and fostered new collaborations in plasma nuclear science. I thank Ray Leeper at Sandia, for many insightful and entertaining conversations and for his continued interest in this work.
4
I thank my thesis reader, Professor Ron Parker, for reviewing this thesis, along with Professors Ian Hutchinson, Jeffrey Freidberg, and Miklos Porkolab for excellent courses in plasma physics and fusion energy.
I also thank my parents, Cheryl and Mike Horne, my brother Adam Horne, my Grandparents Don and Judi Horne and the many other members of my family, for their love, support, and pride, which inspired me to work hard. Lastly, and most importantly, I thank my beautiful and wonderful wife Maxine Casey. Her love and support during these long and arduous years of graduate school managed to make them the most rewarding and enjoyable years of my life.
1-5
TABLE OF CONTENTS
Acknowledgments 3 List of figures 1-10 1- Introduction 1-16 1.1Nuclear Energy ... 1-16 1.2 Stellar nucleosynthesis ... 1-17 1.3 Realization of thermonuclear energy on earth ... 1-18 1.4 Historical remarks on Inertial Confinement Fusion (ICF) ... 1-221.5 Thesis Overview ... 1-23
2- Inertial Confinement Fusion (ICF) 2-25
2.1 Ideal ignition condition in ICF ... 2-25
2.2 ICF drive configurations ... 2-27
2.3 Challenges in ICF ... 2-29 2.4 The OMEGA laser facility ... 2-30
2.5 The National Ignition Facility (NIF) ... 2-31
2.6 ICF Diagnostics ... 2-33
3- Probing ICF implosions using neutrons and charged-particles 3-34
3.1 Primary DT neutron spectrum and yield ... 3-34 3.2 Down-scattered neutrons ... 3-35 3.3 Path-integrated areal density (ρL) and its relation to ρR ... 3-37 3.4 Charged-particle measurements for determination of ρL ... 3-38 3.4.1 Charged-particle diagnostics on OMEGA ... 3-39
1-6
4.1 Principle ... 4-43 4.1.1 Efficiency ... 4-45 4.1.2 Energy resolution ... 4-45 4.2 Final design of the MRS on OMEGA and the NIF ... 4-46 4.2.1 MRS configurations on OMEGA and the NIF ... 4-48 4.2.2 Foil holder and blast-shield ... 4-49 4.2.3 Magnet and its properties ... 4-51 4.2.4 CR-39 detector array ... 4-53 4.2.5 Polyethylene neutron shielding ... 4-57 4.2.6 Alignment procedure ... 4-58 4.3 Ab initio modeling and in situ calibration of the MRS ... 4-59 4.3.1 Ab initio modeling of the MRS on OMEGA and NIF using Geant4 ... 4-59 4.3.2 In situ energy calibration of the MRS on OMEGA and the NIF ... 4-62 4. 4 Characterization of the MRS parameters ... 4-67 4.4.1 Manufacturing CD2 foil ... 4-67 4.4.2 Characterization of the CD2-foil density, area and thickness ... 4-68 4.4.3 The differential cross section for elastic n-d scattering in the laboratory system ... 4-71 4.4.4 The magnet aperture ... 4-72 4.5 Geant4 simulations of the complete MRS-response function ... 4-76 4.6 Modeling of the neutron-background and optimal shielding design for the MRS ... 4-79 4.6.1 Neutron interactions in CR-39 ... 4-80 4.6.2 Neutron background characterization and shielding design for the OMEGA MRS ... 4-80 4.6.3 Neutron background characterization and shielding design for the NIF MRS ... 4-83
1-7
4.8 Summary ... 4-87
5- Absolute primary yield measurements at OMEGA and the NIF using the MRS 5-88
5.1 Techniques for measuring neutron yield ... 5-88 5.2 MRS measurements of the primary yield on OMEGA and the NIF ... 5-89 5.3 Future work ... 5-91 5.4 Summary ... 5-92
6- The Coincidence Counting Technique for background reduction in MRS data 6-93
6.1 The Coincidence counting technique (CCT) ... 6-93
6.1.1 CR-39 as a charged-particle detector ... 6-93
6.1.2 The principle of the CCT ... 6-94
6.1.3 First processing step – The sodium-hydroxide track-etch and scan ... 6-94
6.1.4 Second processing step – The ethanol-sodium-hydroxide bulk etch ... 6-95
6.1.5 Third processing step – The second track etch and scan... 6-99
6.1.6 Random-Background Coincidences (BCCT) ... 6-100
6.1.7 Neutron induced background coincidences ... 6-101
6.1.8 Intrinsic background coincidences ... 6-104
6.2 Application of the CCT to D3He-proton data obtained at the MIT linear accelerator ... 6-105
6.3 The application of the CCT to MRS data obtained at OMEGA and the NIF ... 6-107 6.4 Conclusion ... 6-109
7- Down-scattered neutron measurements using the MRS on OMEGA and the NIF 7-110
7.1 Diagnosing ρR in OMEGA implosions ... 7-110
7.2 Authentication of the MRS measurement of the DSn spectrum ... 7-112 7.3 Achieving high ρRtot in OMEGA cryogenic implosions ... 7-113
1-8
7.4.1 Diagnosing average ρRtot ... 7-115
7.4.2 Diagnosing ρRtot asymmetries ... 7-117
7.5 Diagnosing cryogenic DT implosion performance at the NIF using the MRS ... 7-118
7.6 Summary ... 7-121
8- Measurements of the TT neutron spectrum at low reactant energies 8-122
8.1 Introduction ... 8-122 8.2 The tt neutron spectrum and previous measurements ... 8-123
8.3 Measurements of the tt neutron spectrum at OMEGA ... 8-124 8.4 Summary ... 8-128
9– Evidence for stratification of DT fuel in ICF implosions 9-130
9.1 Introduction ... 9-130 9.2 Predicted dd/dt and tt/dt yield ratios in ICF implosions ... 9-131 9.3 Measurements of the dd/dt and tt/dt yield ratios at OMEGA ... 9-132 9.4 The potential role of fuel stratification ... 9-135 9.5 Summary ... 9-136
Summary 137
Bibliography 139
Appendix A- Nuclear cross-sections and center-of-mass vs laboratory frame ... 149
Appendix B– Astrophysical S-factor, reactant distributions, and electron screening ... 158
Appendix C- OMEGA DSn Experimental Data Summary ... 166
Appendix D– NIF DSn Experimental Data Summary ... 176
Appendix E- OMEGA TT Experimental Data Summary ... 180
Appendix F – Fitting algorithm for analyzing MRS data ... 184
1-9
Appendix H- LILAC simulations of select OMEGA implosions ... 190
H.1 Shock-driven exploding pusher ... 190
H.2 Ablatively-driven plastic shell implosion ... 193
1-10
List of figures
Figure 1-1 Binding energy per nucleon as a function of mass number (A) ... 1-17 Figure 1-2 Reaction cross-sections for common fusion reactions ... 1-20 Figure 1-3 Maxwellian averaged reactivities for common fusion reactions ... 1-21 Figure 2-1 ρR and ion temperature Ti requirements of ignition ... 2-27
Figure 2-2 Illustration of direct-drive and indirect-drive ... 2-28 Figure 2-3 Illustration of the three main phases of the capsule-implosion process ... 2-28 Figure 2-4 OMEGA laser facility ... 2-30 Figure 2-5 OMEGA target chamber ... 2-31 Figure 2-6 The National Ignition Facility (NIF) ... 2-32 Figure 2-7 NIF target chamber ... 2-32 Figure 3-1 Fuel and shell neutron collisions ... 3-36 Figure 3-2 Model ICF-neutron spectrum ... 3-37 Figure 3-3 Calculated DSn spectra ... 3-38 Figure 3-4 Charged-particle spectrometers (CPS1 and CPS2) principle ... 3-40 Figure 3-5 CPS1 and CPS2 on OMEGA ... 3-40 Figure 3-6 Example KO-p and KO-d spectra ... 3-41 Figure 3-7 Calculated KO-d for different cryogenic ρRs ... 3-42 Figure 4-1 A schematic drawing of the MRS ... 4-44 Figure 4-2 OMEGA MRS and NIF MRS ... 4-47 Figure 4-3 CAD Drawing of OMEGA and NIF MRS ... 4-48 Figure 4-4 MRS foil holder and blast shield ... 4-50
1-11
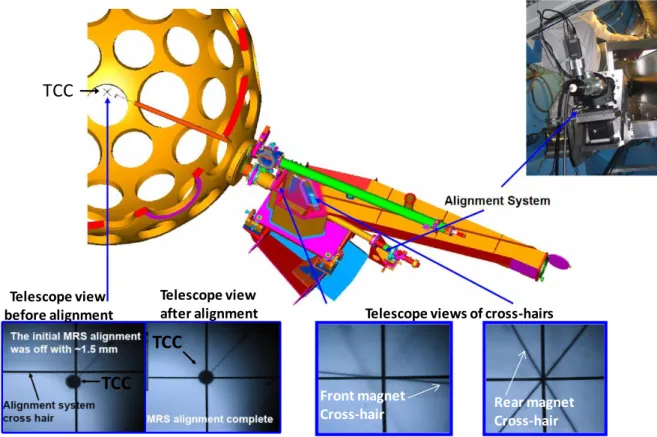
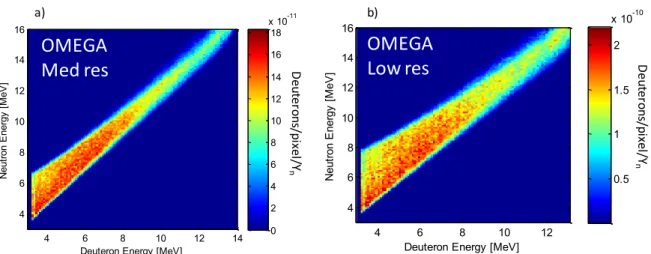
Figure 4-5 Blast shield scattered neutron spectrum. ... 4-50 Figure 4-6 MRS Magnet ... 4-51 Figure 4-7 Modeled and measured magnetic-field maps ... 4-52 Figure 4-8 Comparison of the OMEGA MRS and NIF MRS magnets ... 4-53 Figure 4-9 OMEGA and NIF detector arrays ... 4-54 Figure 4-10 Orientation of detectors ... 4-55 Figure 4-11 Insertion of detector arrays ... 4-55 Figure 4-12 Detector fork and filter schematic ... 4-56 Figure 4-13 Neutron mean-free path for shielding materials ... 4-57 Figure 4-14 Schematics of OMEGA and NIF shielding ... 4-58 Figure 4-15 MRS alignment ... 4-59 Figure 4-16 Illustration of Geant4 model of the MRS response ... 4-60 Figure 4-17 Ab initio modeled OMEGA MRS-response functions ... 4-61 Figure 4-18 Ab initio modeled response for CH2 foil with Ta filters ... 4-61
Figure 4-19 Ab initio modeled NIF MRS response functions ... 4-62 Figure 4-20 In situ energy calibration of the OMEGA MRS ... 4-63 Figure 4-21 In situ energy calibration error ... 4-64 Figure 4-22 In situ calibration of the NIF MRS. ... 4-65 Figure 4-23 NIF MRS split filter calibration ... 4-66 Figure 4-24 CR-39 detector arrangement and coordinate system ... 4-66 Figure 4-25 OMEGA and NIF energy response ... 4-67 Figure 4-26 X-ray radiographs of the CD2 foils ... 4-68
1-12
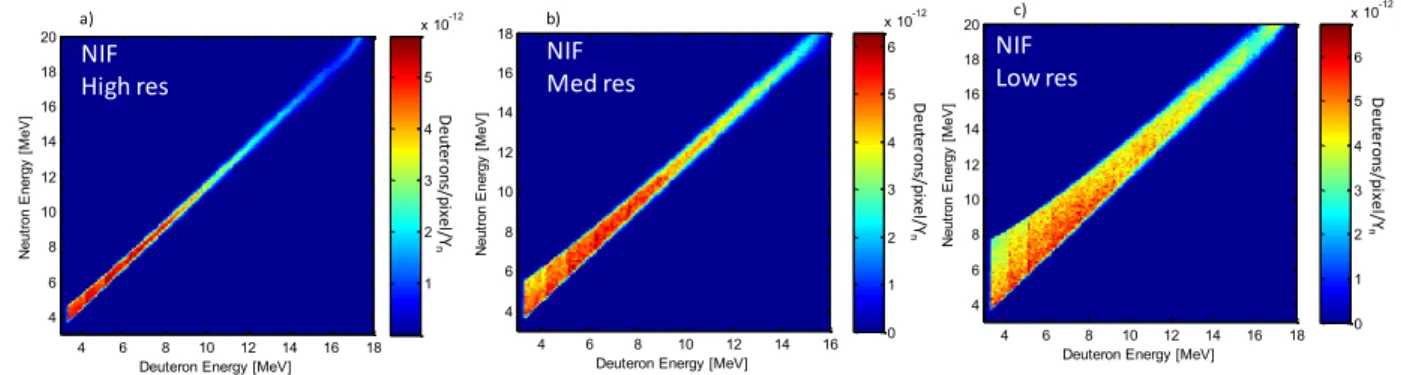
Figure 4-28 OMEGA MRS foil area and thickness ... 4-70 Figure 4-29 NIF MRS foil area and thickness ... 4-71 Figure 4-30 n-d elastic scattering cross-section ... 4-72 Figure 4-31 MRS magnet aperture ... 4-73 Figure 4-32 Illustration of NDI foil holder signal interception ... 4-74 Figure 4-33 Measured and simulated signal distributions due to interception ... 4-74 Figure 4-34 Measured and simulated signal distributions for transmission function ... 4-75 Figure 4-35 Transmission as a function of deuteron energy for the OMEGA MRS ... 4-76 Figure 4-36 Response matrices for the OMEGA MRS ... 4-77 Figure 4-37 Comparison of OMEGA MRS measured data to response matrices ... 4-78 Figure 4-38 Response matrices for the NIF MRS ... 4-78 Figure 4-39 Comparison of NIF MRS measured data to response matrices ... 4-79 Figure 4-40 CR-39 neutron-interaction processes ... 4-80 Figure 4-41 Measurements of neutron background in OMEGA target bay ... 4-81 Figure 4-42 Simulated OMEGA MRS neutron background ... 4-82 Figure 4-43 Measured and simulated OMEGA MRS neutron background ... 4-83 Figure 4-44 Simulated NIF target bay neutron background ... 4-84 Figure 4-45 Simulated NIF MRS neutron background ... 4-85 Figure 4-46 OMEGA MRS Signal to background ... 4-87 Figure 5-1 OMEGA MRS primary neutron yield compared to nTOF yield ... 5-90 Figure 5-2 NIF MRS primary neutron yield compared to activation yield ... 5-91 Figure 6-1 Schematic illustration of the three staged-etch process ... 6-94 Figure 6-2 Ethanol bulk-etch rate (BER) as a function of etch temperature ... 6-95
1-13
Figure 6-3 Calculated pre and post-bulk etch deuteron energies ... 6-98 Figure 6-4 Magnetic stirring unit and beaker used in the CR-39 bulk-etch process ... 6-99 Figure 6-5 Relative coincidence coordinate distribution ... 6-100 Figure 6-6 Random coincidence background ... 6-101 Figure 6-7 Illustration of neutron interaction in the CR-39 ... 6-102 Figure 6-8 Number of neutron-induced coincidences as a function of fluence ... 6-103 Figure 6-9 Number of intrinsic background coincidences as a function of bulk etch depth .... 6-104 Figure 6-10 D3He-proton coincidence data example ... 6-106 Figure 6-11 Background reduction factor and statistical uncertainty for the DSn yield for OMEGA and NIF MRS using the CCT ... 6-108 Figure 7-1 CPS1, CPS2, and OMEGA MRS diagnostic locations. ... 7-111 Figure 7-2 An image of a cryogenic implosion ... 7-111 Figure 7-3 MRS DSn data with KO-p and KO-d measurements for an OMEGA implosion .. 7-112 Figure 7-4 Authentication of the MRS DSn data with KO-p and KO-d measurements using a variety of implosion types ... 7-113 Figure 7-5 LILAC simulation of a cryogenic DT implosion ... 7-114 Figure 7-6 LILAC simulated fuel ion temperature and ρR ... 7-115 Figure 7-7 MRS measured recoil deuteron spectra for three cryogenic DT implosions on OMEGA ... 7-116 Figure 7-8 Triple picket laser-pulse shapes used to implode the cryogenic DT capsules at OMEGA ... 7-116 Figure 7-9 Illustration of target offset impact on laser irradiation ... 7-117 Figure 7-10: ρR from CPS compared to ρR inferred from MRS ... 7-118 Figure 7-11 MRS measured recoil deuteron spectra for three cryogenic THD and DT implosions on the NIF ... 7-119 Figure 7-12 Laser pulses used to drive the implosions described in Figure 7-11 ... 7-120
1-14
Figure 7-13 DT equivalent yield plotted as a function of DSR to illustrate the improvement in ITFX during the ignition campaign ... 7-121 Figure 8-1 Modeled and measured neutron spectra for the tt reaction ... 8-124 Figure 8-2 MRS measured recoil deuteron spectrum and best DSn fit ... 8-126 Figure 8-3 MRS measured tt neutron spectrum compared to different levels of n+5he(GS) ... 8-127 Figure 8-4 The n+5he(GS) to n+n+4he reaction branching ratio at ICF reactant energies compared to higher energy accelerator data ... 8-128 Figure 9-1 dd proton spectrum measured with the CPS in an OMEGA DT implosion ... 9-133 Figure 9-2 tt neutron spectrum from OMEGA DT implosion ... 9-134 Figure 9-3 Measured Ydd/Ydt Ytt/Ydt reaction yield ratios as a function of ion temperature compared
to expectations assuming a constant fuel density ratio ... 9-135
Figure A-1 Illustration of a collision between two particles ... 149
Figure A-2 Angular and energy differential scattering cross-sections for 14MeV neutrons scattering off C-12 ... 153
Figure A-3 Angular and energy differential elastic scattering cross-section for 14 MeV neutrons scattering off H, D, and T ... 155
Figure A-4: Angular differential n,d elastic scattering cross-sections for 14.17MeV and 5.6MeV neutrons ... 155
Figure A-5 The scattered neutron spectrum from the interaction of 14MeV DT neutrons with the equimolar DT and CH plastic shells in ICF implosions ... 157
Figure B-6 Cross-sections and S-factors for the DT, TT, and 3He3He reactions ... 159
Figure B-7 Cross-sections and S-factors for additional reactions of interest ... 160
Figure B-8 Plot of the reactant energy distribution of a Ti=5keV TT fusion burn ... 161
Figure B-9 Plot of the reactant energy distribution for several reactions at various Ti’s ... 162
Figure B-10 Comparison between the numerical and analytic <σv> for resonant reactions.... 163
Figure B-11 Accelerator electron screening for D3He, DT, and TT reactions ... 164
1-15
Figure F-13 Example DSn spectrum fit to MRS recoil deuteron data ... 185
Figure F-14 Example TTn spectrum fit to MRS recoil deuteron data ... 186
Figure G-15 Front panel of the coincidence counting program ... 188
Figure G-16 Flow diagram describing the coincidence counting program algorithm ... 189
Figure H-17 Laser pulse shape and simulated burn profile for an exploding pusher ... 191
Figure H-18 Simulated ion temperature profile for an exploding pusher ... 191
Figure H-19 Simulated ion density profile for an exploding pusher ... 192
Figure H-20 Simulated pressure profile for an exploding pusher ... 192
Figure H-21 Simulated acceleration and velocity profiles for an exploding pusher ... 193
Figure H-22 Laser pulse shape and simulated burn profile for an ablative implosion ... 194
Figure H-23 Simulated ion temperature profile for an ablative implosion ... 195
Figure H-24 Simulated ion density profile for an ablative implosion ... 195
Figure H-25 Simulated pressure profile for an ablative implosion ... 195
Figure H-26 Simulated acceleration and velocity profiles for an ablative implosion ... 196
Figure H-27 Laser pulse shape and simulated burn profile for a cryogenic implosion ... 197
Figure H-28 Simulated ion temperature profile for a cryogenic implosion ... 198
Figure H-29 Simulated ion density profile for a cryogenic implosion ... 199
Figure H-30 Simulated pressure profile for a cryogenic implosion ... 199
1-16
1 - Introduction
Since the first people looked toward the sky, the power and wonder of the sun and stars, mystified humankind. Littered across a black canvas, twinkling stars rotated in familiar patterns, until the sun rose and banished the darkness of night. For thousands of years, people turned to religion and philosophy to help make sense of these celestial wonders. Even the great physicist Sir Isaac Newton, who was able to connect the laws of gravity on the ground to the celestial motion of planets and stars in our solar system, credited the source of the sun’s energy to that of the divine.1 The sun’s mysteries lingered. In 1862, Lord Kelvin used a faulty estimate of the sun’s age to argue against Charles Darwin’s theory of evolution. Darwin estimated that the earth must be more than ~300 million years old, an estimate that was based on the erosion of the English Weald. This was a critical piece of his theory, as biological evolution required such long time scales. Kelvin, on the other hand, believed that the sun was powered by gravitational energy of primordial meteorites (as he realized no chemical reaction could suffice) and could not be more than a few tens of millions of years old. As Kelvin’s argument was troubling to Darwin, he removed his discussion of time scales from the final editions of his book On the Origin of the Species.2 It turns out though that Darwin’s lower bound for the age of the earth was correct, as we now know the solar system formed some four billion years ago. Through evidence in the evolution of biological systems and geological erosion, both Darwin and Kelvin had unintentionally revealed that the current understanding of physics was insufficient to explain the apparent age of the sun. Something was missing.
The first piece of the puzzle emerged in 1905, when Einstein showed that mass and energy are equivalent through the famous equation E=mc2. 3 A few years later in 1920, Aston measured the mass of the helium nucleus and found it weighed less than the sum of its constituents mass (two neutrons and two protons).2 Immediately following, in that same year, Eddington realized that this difference in mass is the energy source of the sun, which fuses hydrogen into helium.2, 4 Eddington could not, on the other hand, explain how the hydrogen nuclei overcome the Coulomb barrier and fuse into helium. This was instead provided by Gamow and his colleagues, who formulated a theory for quantum tunneling, which Atkinson and Houtermans recognized in 1929 to be the way for hydrogen nuclei to overcome the Coulomb barrier and fuse into helium in the center of the sun.5 Three years later, fusion of light isotopes were first observed by Oliphant.6 All this work laid the foundation to Bethe’s seminal paper “Energy production in stars” in 1939,7 for which he was awarded the Nobel Prize in 1967.
1.1Nuclear Energy
According to Einstein’s famous equation E= mc2, the energy released in the fusion process of light ions is simply related to the difference in mass between the reactants and fusion product(s). This mass difference is typically several MeV per nucleon (proton or neutron), making the energy released in fusion several orders of magnitude higher than in chemical reactions, which are fractions of eV/atom.8 The underlying physics that dictates this mass difference is the strong
1-17
nuclear force, which increases the binding energy per nucleon with increasing mass number of the nucleus (A) for elements up to A=56 (Iron-56).9 For elements heavier than Iron-56, the binding energy per nucleon starts to decrease due an increasing effect of the Coulomb repulsion. This means that breaking apart a heavier nucleus into lighter ones produces energy as well, which is called nuclear fission. This process can occur spontaneously if the nucleus is unstable enough. In Figure 1-1, the binding energy per nucleon9 is plotted for the known range of elements. One striking feature is that the binding energy per nucleon is relatively flat (8-9 MeV/nucleon) for mass numbers above A~50.
Figure 1-1: Binding energy per nucleon (MeV/A) as a function of mass number of the nucleus (A).9 This curve illustrates that nuclear fusion of lighter elements, or nuclear fission of heaver elements, releases energy equivalent to the increased binding energy of the newly formed more stable nucleus or nuclei. As shown by the figure, the most stable element is 56Fe.
1.2 Stellar nucleosynthesis
The formation of heavier nuclei through fusion is called nucleosynthesis. This process was initiated by the primordial big bang, which was responsible for the production of neutrons, protons, helium, and trace deuterium and lithium. All other nuclei are formed in stellar nucleosynthesis in stars either through the proton-proton (pp) cycle, CNO cycle, or through neutron capture.10 The sun contains mostly hydrogen, which is gravitationally confined and supported by the heat and pressure generated by the thermonuclear-fusion process in its core. The pp cycle, which is the dominating reaction sequence in middle-aged yellow dwarf stars like our sun,10 produces helium-4 from four hydrogen nuclei (protons) through a variety of intermediate reactions. Table 1-1 summarizes the important reactions in the pp cycle, which consists of four branches through which the hydrogen nuclei produce helium. Of particular interest is the neutrino emission along each branch, because a solar neutrino is the only direct observable of the sun’s burning core. Other types of radiation emitted from the core are not directly observed, as they undergo numerous collisions before they reach the surface of the sun, which takes ~105 years.11 For many years, the solar
0 1 2 3 4 5 6 7 8 9 10 0 100 200 B indi ng E ner gy per N uc leon [M eV /A ]
Mass number (A)
Fusion
Fission
4He
1-18
nucleosynthesis models could not explain the solar neutrino flux, prompting doubts about the models and reaction cross-sections, until neutrino flavor oscillation was discovered to be source of the discrepancy.10
Table 1-1: Important reactions in the solar pp cycle, which is the main reaction sequence in yellow dwarf stars like our sun. In the pp cycle, four hydrogen nuclei (protons) fuse together through a variety of intermediate reactions to become one helium-4 nucleus. There are four branches that protons can follow to become a helium-4 nucleus. The reaction Q value for each reaction is indicated along with the pp-cycle branch.10 It is noteworthy that the neutrino emission from each branch is the only direct observable that can be used to diagnose the sun’s burning core, which makes solar neutrinos important to understanding
stellar nucleosynthesis.
1.3 Realization of thermonuclear energy on earth
From a net-energy production point of view, the most viable method for achieving fusion is to heat the fuel to high enough temperatures for significant fusion reactions to occur. This method is called thermonuclear fusion, which is the process that takes place in stars (the other method involves accelerators that produce “beam-target” fusion in cold solid targets. This method is not useful for energy purposes, as substantial amount of energy is transferred to the cold target by Coulomb scattering). By heating the fuel, the energy losses through Coulomb scattering are greatly reduced, as the Coulomb scattering just redistributes the energy among the ions rather than acting as a loss mechanism. Temperatures required for significant thermonuclear-fusion reactions to occur are in the keV range (1 keV= 1.16×10⁷ Kelvin), at which the fuel is in a plasma state.
Several criteria exist for a viable fuel in a future thermonuclear-fusion reactor. The most important ones are: low-Z ions must be used to reduce the Coulomb repulsion and probability for Coulomb scattering to a minimum; low-Z ions must be used to reduce the X-ray emission losses (fusion of higher-Z ions requires higher temperatures, which results in increased X-ray emission losses); and finally the fusion reactions need to be exothermic and thus release substantial amount
Reaction Branch Q (MeV)
p + p → D + +β + ν e I-IV 0.4 D + p → He3 + γ I-IV 5.5 He3 + He3 → α + 2p I 12.9 He3 + He4 → Be7+ γ II 1.6 Be7 + -β → Li7+ ν e II 0.9 Li7 + p → 2 α II 17.4 Be7 + p → B8+ γ III 0.1 B8 → Be8 + β + ν e III 17.0 Be8 → 2α III 2.9 p + He3 → α + +β + ν IV 18.8
1-19
of energy. Reactions that fit these criteria involve the isotopes of hydrogen and helium, i.e., deuterium (D), tritium (T), and helium-3 (3He). Table 1-2 summarizes the most important reactions involving these elements. Among these reactions, the DT reaction is the most promising one due to its highest cross-section at temperatures that can be readily achieved (see Figure 1-3). The DT reaction releases a total kinetic energy of 17.6 MeV carried by an alpha particle and a neutron.
Table 1-2: Most important reactions in a thermonuclear-fusion experiment. The Q value for each reaction is also shown. Due to its relatively high cross section at temperatures readily achieved, the DT reaction is the most promising candidate for thermonuclear ignition.
Figure 1-2 shows the cross-sections for the reactions in Table 1-2 as a function of center-of-mass (CM) energy of the reactants. The figure also shows a few reactions in the pp cycle shown in Table 1-1. As illustrated in Figure 1-2, the DT cross-section is the highest at CM energies below ~100 keV, which is partly due to the resonance at ~64keV12 (see Appendix A for a discussion of differential cross sections in the CM and laboratory systems). Due to the small cross-section for the pp reaction, stars like our sun burn slowly, producing energy for billions of years.
Reaction Q (MeV) D + T → α + n 17.6 D + D → T + p 4.0 D + D → n + He3 3.3 T + T → α + 2n 11.3 T + T → n + He5 10.4 D + He3 → α + p 18.4
1-20
Figure 1-2: Reaction cross-sections as a function of center of mass (CM) energy in keV for commonly encountered fusion reactions, including those in the first branch of the solar pp cycle13 [ENDF/B-VII.0 evaluated data (except pp which is generally regarded as too low to measure)].14 The DT reaction is significantly higher at lower energies because of a resonance (~64keV),12 making it an attractive reaction for controlled thermonuclear fusion. The pp reaction15 is so much lower than the other reactions that it was multiplied by 1016 to fit on the graph.
To determine the power produced in a thermonuclear-fusion experiment, the first step is to calculate the reaction rate (R), which is a function of the reactant densities (n1 and n2) and the reactivity of the plasma 〈𝜎𝑣〉8 i.e.,
𝑅 =1 + 𝛿𝑛�𝑛�
��〈𝜎𝑣〉. (1-1)
Here, δ12 is the Kronecker delta used to prevent double counting of particles when n1 and n2 are the same reactant nuclei, and 〈𝜎𝑣〉 is the cross section (σ) (shown in Figure 1-2), averaged over all relative velocities (𝑣 = |𝑣⃑�− 𝑣⃑�|) of the reactants, i.e., 〈𝜎𝑣〉 = ∫ 𝑣 𝜎(𝑣)𝑓�(𝑣⃑�)𝑓�(𝑣⃑�)𝑑𝑣⃑�𝑑𝑣⃑�.8 The reactivity can also be expressed as
〈𝜎𝑣〉 = �� �� � � ��/�∫ 𝜎(𝐸) 𝐸 𝑒��/�𝑑𝐸 � � . (1-2)
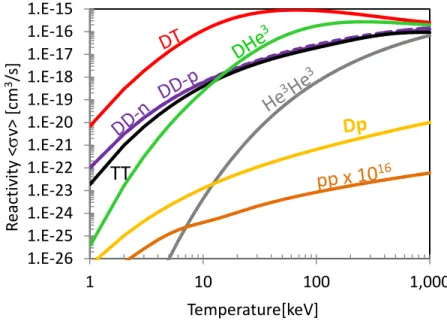
Here, E is the CM energy of the reactants. Equation (1-2) can be evaluated analytically15 or numerically for a specified plasma ion temperature. Figure 1-3 shows the Maxwellian averaged reactivity as a function of the plasma ion temperature for the cross-sections shown in Figure 1-2. As expected, the DT reaction has the highest reactivity, making it the most likely candidate for the first ignition experiment and for the first-generation thermonuclear reactor.
1.E-18 1.E-16 1.E-14 1.E-12 1.E-10 1.E-08 1.E-06 1.E-04 1.E-02 1.E+00 1 10 100 1,000 10,000 Re ac tion C ros s-se cti on [ba rn] CM energy [keV]
TT
pp x 10
161-21
Figure 1-3: Maxwellian averaged reactivities as a function of ion temperature for reactions shown in Figure 1-2. [ENDF/B-VII.0 evaluated data (except for the pp reaction, which is generally regarded as too low to measure)].13, 14
As the Q value listed in Table 1-2, represents the energy released in a fusion reaction, the fusion power density (fusion power produced per unit volume) is determined by the reaction rate times the Q value, i.e.,
𝑃/𝑉 = 𝑄 ����
�����〈𝜎𝑣〉 . (1-3)
Deriving the ignition condition for a fusion plasma can be done by balancing fusion power with the power losses, such as Bremsstrahlung and thermal conduction (or pdV expansion). Often referred to as the Lawson’s criterion, the ignition condition is presented as a minimum product of density and confinement time (at some optimal temperature) at which the alpha heating can overcome the energy losses. Lawson’s criterion states that nτ > 2×10¹⁴
s/cm3 at ~20keV.16 Recent references8, 17 have presented the ignition criterion as a product of the plasma pressure and the energy-confinement time requirement (equivalent to a nτΤ criterion), illustrated by Equation (1-4).
𝑃𝜏 > 8 𝑎𝑡𝑚 𝑠 (1-4)
This expression indicates that a fusion plasma, or the energy in a fusion plasma, must be confined on a time-scale long enough for significant fusion reactions to occur or 𝜏 ~�
�< 𝜎𝑣 >. 16
The sun’s enormous mass m~2×1030 kg gravitationally confines the burning plasma by tremendous gravitational pressure balanced by the internal pressure.10 The very long-energy confinement time in the sun is essential for a self-sustained burn, because the cross section for the pp reaction is extremely small, resulting in an extremely long average time between pp reactions. For thermonuclear fusion to be practical on earth, different confinement schemes must be applied. The most promising are magnetic confinement fusion (MCF), which uses powerful magnetic fields to
1.E-26 1.E-25 1.E-24 1.E-23 1.E-22 1.E-21 1.E-20 1.E-19 1.E-18 1.E-17 1.E-16 1.E-15 1 10 100 1,000 Re ac tiv ity < σv> [c m 3/s ] Temperature[keV]
TT
1-22
confine the plasma, and Inertial Confinement Fusion (ICF) where the plasma is confined by its own inertia over a short period of time. MCF will not be discussed further in this thesis but the interested reader is referred to several excellent textbooks on the subject.8, 18
1.4 Historical remarks on Inertial Confinement Fusion (ICF)
During World War II, when the first fission weapon was developed under the code name “Manhattan project,” Teller and others realized that a fission bomb could potentially be used as a primary driver to implode a secondary thermonuclear-fusion package (which was initially called the “Super”). In 1949, when former Soviet Union detonated their first fission bomb, President Truman ordered an accelerated development of the thermonuclear-fusion bomb. This led to the United States’ first test of a thermonuclear bomb on November 1, 1952. The Soviets were not far behind, as demonstrated by their first test in 1953.
The foundation of thermonuclear weapons rests on the concept of ICF, but to utilize the energy released for peaceful purposes (as an energy source), the energy output must be reduced roughly ten million times. This requires a radically different implosion driver, as the fission bomb cannot be appropriately scaled down.
With the realization of the first laser in 1960,16 it was not long after when researchers at the Lawrence Livermore National Laboratory (LLNL) recognized that a laser could be potentially used as a driver for ICF. The first unclassified paper on ICF was written by Nuckolls in 1972,19 in which he described a system where several lasers are used to implode a 1-mm sized spherical capsule to high densities and temperatures for significant thermonuclear fusion to occur. The main concepts of ICF and many of the original issues that were identified in that paper are still relevant today. However, that paper did predict that ignition would be achieved with a 1kJ driver (predictions today are ~1 MJ).16, 19, 20 After Nuckolls paper, a substantial ICF program was established at LLNL. In 1976, the Argus laser was built to study laser-plasma interactions, and in the following year, the Shiva laser was built to demonstrate target compression using laser drivers. The results of these efforts led to the development of the NOVA laser in 1985, at which the first fully integrated indirect-drive experiments began. The experience gained from the NOVA effort paved the way for a larger MJ laser facility known as the NIF,21 which was completed in 2009. In parallel with the LLNL program, the Laboratory for Laser Energetics (LLE) at the University of Rochester started an ICF program in the 1970s. The ZETA laser, built in 1978, was a six laser-beam prototype of the OMEGA 24 system, which was completed in 1980. OMEGA 24 was built to study spherical direct-drive compression of ICF capsules. The OMEGA-24 system was upgraded in 1996 to the OMEGA-60 system to achieve better uniformity and to validate the direct-drive approach to achieving ignition.22 Much of the data obtained and described in this thesis were taken at OMEGA and the NIF. As these ICF laser facilities produce temperatures that are hotter than the core of sun and densities that are ~1000 times higher than solid density, specially designed diagnostics are required to probe these extreme conditions.
1-23
1.5 Thesis Overview
This thesis discusses a novel neutron spectrometer, called the Magnetic Recoil Spectrometer (MRS),23-25 for diagnosing ICF-capsule implosions at OMEGA and the NIF. The primary objective with MRS is to measure the absolute neutron spectrum from which fuel assembly (areal density), ion temperature, and neutron yield (or “fusion energy” output) can be directly determined. Information about these parameters is essential for understanding the implosion performance. The MRS was first built, installed, and commissioned on OMEGAin 2007 to comprehensively test the technique and to bring a required diagnostic to the OMEGA cryogenic program.26 In addition, the MRS has been uniquely used on OMEGA to address fundamental nuclear and plasma-physics questions, as discussed in this thesis. Another MRS was implemented and performance qualified on the NIF in 2010 to support the National Ignition Campaign (NIC).
Chapter 2 introduces the basic concepts of ICF. It also discusses OMEGA, the NIF, and the diagnostics used on these facilities.
Chapter 3 describes the nature of the ICF neutron spectrum and the information about the implosion that is carried by the spectrum. The principles of how charged particle data from low-ρR implosions can be used to validate the MRS data are also discussed.
Chapter 4 describes the basic principles of the MRS, and it elaborates in detail about the modeling of the MRS response function. This chapter also discusses measurements and modeling of the neutron background around the MRS and the optimal polyethylene-shielding design for the diagnostic on OMEGA and the NIF. This effort involved detailed characterization of the response functions for the different MRS configurations, using the Geant4 code; characterization of the fluence and spectrum of background neutrons at the MRS; and the design of the polyethylene shielding around both MRS systems. This work will be submitted to Rev. Sci. Instrum. in the paper D.T. Casey et al.
Chapter 5 presents measurements of the absolute primary DT neutron yield conducted with the MRS. These results are contrasted to other measurements at OMEGA and the NIF. This work will be submitted to Rev. Sci. Instrum. in the paper D.T. Casey et al. .
Chapter 6 describes the coincidence counting technique (CCT) that was developed to reduce the background in the MRS data (on both OMEGA and the NIF) to the required level for measurements of weak features in the emitted ICF-neutron spectrum, such as the down-scattered neutron (DS-n) component. The principle, implementation, and validation of the CCT are in particular discussed in this chapter. It also discusses the statistical uncertainty of the DS-n measurements at OMEGA and the NIF when utilizing the CCT. As an array of CR-39 is used as detectors in the MRS, the principal sources of background are neutron-induced tracks and intrinsic tracks (defects in the CR-39). Using the CCT, it was demonstrated that this type of background is reduced by a couple of orders of magnitude, which well exceeds the requirement for the DS-n measurements at both facilities. This work was published in the paper D.T. Casey et
1-24
Chapter 7 describes the MRS measurements of the DS-n spectrum, from which the areal density
(ρR) is inferred and used to diagnose cryogenic DT implosions at OMEGA and the NIF.26 As there are currently no other ways to diagnose ρR values larger than ~200 mg/cm2 at OMEGA,25the ρR
data obtained with the MRS have been essential for understanding how the assembly of the fuel
occurs and for guiding the cryogenic program at OMEGA to ρR values up to ~300 mg/cm2 .26, 28 The MRS on the NIF has also provided data that have been critical to the progress of the NIC towards the goal of achieving thermonuclear ignition and net energy gain. Recent data obtained with the MRS in September 2011 indicate that the implosion performance, characterized by the Experimental Ignition Threshold Factor (ITFX),29 has improved about 50× since the first cryogenic shot a year earlier. This work has been published in the following papers: J.A. Frenje et al., Rev. Sci. Instrum. 82, 073502 (2008);24 J.A. Frenje et al. Phys. Plasmas 16, 042704 (2009);30 V.N. Goncharov et al., Phys. Rev. Letters 104, 165001 (2010);28J.A. Frenje et al., Phys. Plasmas 17, 056311 (2010);25 and T.C Sangster et al., Phys. Plasmas 17, 056312 (2010).26
Chapter 8 discusses the use of the MRS for novel studies of the T(t,2n)4He reaction, which is an important mirror reaction to the 3He(3He,2p)4He solar fusion reaction. The first high-resolution measurements of the TT neutron spectrum using high-energy-density-laboratory plasmas are presented in this chapter. As these spectra were obtained for a low average TT reactant energy of ~23 keV, which is the same as the solar peak reactant energy for the 3He+3He reaction, the results provided important nuclear-physics implications for the 3He(3He,2p)4He solar fusion reaction. This work will be submitted to Phys. Rev. Letters in the paper D.T. Casey et al.
Chapter 9 discusses measurements of the D(d,p)T (DD) and T(t,2n)4He (TT) reaction yields and how they compare to measurements of the D(t,n)4He (DT) reaction yield in an ICF implosion. From these measurements, it was concluded that the DD yield is anomalously low and the TT yield is anomalously high relative to the DT yield, an observation most likely caused by stratification of the fuel in the implosion core. This effect may be present in ignition experiments planned on the NIF, potentially resulting in a more restrictive ignition threshold. This work was accepted for publication in Phys. Rev. Letters in the paper D.T. Casey et al.
Chapter 10 summarizes the thesis and presents some concluding remarks.
Appendix A discusses nuclear cross-sections and provides the relationships between center-of-mass and laboratory reference frames. Appendix B discusses the astrophysical S-factor parameterization of cross-sections, the reactant energy distributions for thermonuclear reactions, and the effects of electron screening. A summary of the down-scattered neutron data obtained at OMEGA is provided in Appendix C and at the NIF in Appendix D. Appendix E is a summary of the TT neutron data obtained at OMEGA. Appendix F describes the fitting algorithm used with MRS data. Appendix G provides a description of the coincidence counting analysis code, which was developed to process data according to the techniques described in Chapter 6. Appendix H discusses hydrodynamic simulations31 of several OMEGA implosions relevant to this thesis.
2-25
2 - Inertial Confinement Fusion (ICF)
This chapter focuses on the concepts of ICF. Section 2.1 derives the ideal ignition conditions. In Section 2.2, different ICF-drivers are discussed. Section 2.3 elaborates on the challenges involved in achieving ignition. Section 2.4 provides details about the OMEGA laser facility, and section 2.5 discusses the NIF, which is the premier operational facility for ICF implosion experiments. A brief discussion of the diagnostic techniques for diagnosing the implosion is discussed in Section 2.6.
Additional reading on the physics of ICF can be found in the book “The physics of Inertial Fusion” by Atzeni and Meyer-ter-vehn.16 In addition, a review of the principles of ICF ignition and a comparison to MCF can be found in the paper by Betti et al.17, and a thorough discussion of ignition at the NIF can be found in the paper by Lindl et al.32, 33
2.1 Ideal ignition condition in ICF
In ICF, the energy-confinement time is essentially the time it takes for the burning core to disassemble itself. The disassembly time scales as: 𝜏~ 𝑅 3𝐶⁄ �, where R is the fuel radius and Cs is the speed of sound. The fuel has typically a radius of ~50 µm and temperature of ~10keV, which corresponds to Cs ~ 108 cm/s, resulting in a confinement time τ of ~10 ps. It will be shown later that
τ is linearly proportional to the ρR (see Equation (2-2)), which can be determined experimentally.
For this reason, the ρR parameter is of critical importance in ICF. The ρR is typically expressed as
𝜌𝑅 = � 𝜌 𝑑𝑟�
� (2-1)
Here, ρ is the fuel density. The relationship of ρR to the energy-confinement time
(Equation(2-2)) is shown by first expressing pressure in terms of ion density n and temperature T (𝑃 = 2𝑛𝑇), and mass density 𝜌 in terms of n (𝜌 = 𝑛/𝑚�), where 𝑚� is the average ion mass (𝑚�=4.2×10⁻²⁴ g for equimolar DT). Next, by using the confinement time 𝜏~ 𝑅 3𝐶⁄ �, and Cs ~ 3×10⁷T1/2 (where T is given in keV) gives:16
𝑃𝜏~ 2𝑛𝑇𝑅 3𝐶⁄ �~23 𝜌𝑅 𝑇/𝑚�𝐶� (2-2)
Incorporating Equation (2-2) into Equation (1-4) results in the inequality ρR > 0.3g/cm2, which is coincidentally near the range of the 3.5 MeV alphas that must be stopped (a necessary condition) to setup a self-sustaining burn.17 In other words, achieving highest possible ρR is a prerequisite for an
effective burn or high burn fraction (fb) of the fuel. fb in an ICF implosion can be derived from the reaction rate equation (Equation (1-1)) and expressed as
2-26
𝑓
�=
�����/���� �. (2-3)Here, it is assumed that the plasma is at a temperature of ~10 keV. Equation (2-3) shows that efficient burn requires high compression and high ρR. For example, to burn 1/3 of the available DT
fuel in a high gain implosion, the required ρR is ~3g/cm2, which is an order of magnitude higher than the alpha particle range.
Ignition and self-sustaining burn occur when plasma self-heating (energy deposited from alpha particles) exceeds all energy loss mechanisms. The energy loss mechanisms in ICF are somewhat different from those in MCF. For example, thermal conduction and Bremsstrahlung loss, used in the derivation of Equation (1-4), are less important than the pdV expansion loss in an implosion.16,
17, 34
These energy losses are treated by Betti et al.17 who used 1D simulations to determine a power-law fit of the measurable burn-averaged 𝜌𝑅 (in g/cm2) and ion temperature Ti (in keV) necessary to achieve ignition (shown in Equation (2-4)).
𝜌𝑅 � ��
�.� �
�.�
> 1 . (2-4)
Equation (2-4) shows that high ρR and high Ti are required simultaneously to achieve ignition. For more details, the interested reader is referred to the papers by Zhou et al.34 and Betti et. al.,17 who describes an alternative analytical derivation of this ignition condition. Other references also discuss the required conditions for ignition both generally and in indirect-drive and fast ignition.16,
32, 33
Betti et al.17 have also extended this ignition condition to 3D by using measured yield (Y3D)
over calculated clean yield (Y1D), which embodies 3D effects, such as Raleigh-Taylor (RT) mix
that reduces the radius of the hot spot. However, this assumes that the 3D effects explain the discrepancy between the simulation and experiment. The underlying physics that govern ignition can be studied at ρR’s and Ti’s lower than this requirement. This can be done by using energy-scaled hydrodynamic implosions,28, 32, 34, 35 which is important as few laser facilities have the potential of achieving ignition. Smaller laser facilities can therefore be used to study ignition conditions without actually igniting an implosion. Figure 2-1 shows a curve (black arrow) of a hydro-equivalent-implosion scaling with increasing laser energy (EL). The starting point (black
data point) is the energy-scaled implosion at ρR~0.3g/cm2 and Ti~3.5keV that is obtained for a laser energy of EL ~23kJ typically used on OMEGA. This implosion will marginally ignite in 1D
for a ρR~1.0g/cm2 and Ti~4.0keV when the laser energy is EL~0.7MJ (this energy will be readily
achieved on the NIF when operated in the polar-direct drive (PDD) configuration). To reach ignition, it is clear from Equation (2-4) that high compression and thus high ρR is required. Highest
possible compression is achieved through an adiabatic (or isentropic) compression, which obeys 𝜌 𝜌⁄ = (𝑃 𝑃� ⁄ )� �/� relationship, where 𝜌 and 𝑃 are the final density and pressure, respectively.16 In contrast to isentropic compression, which in principle can lead to arbitrarily high compression, shock-induced compression is limited to 𝜌 𝜌⁄ < 4 because the remainder of the � shock energy is lost to heating the plasma (raising the entropy) rather than compressing it. A common measure of compressibility (or the entropy) in an ICF implosion is the adiabat (α), which is defined in Equation (2-5) as the pressure (P) divided by the Fermi-degenerate pressure (Pdeg ∝
ρ5/3
2-27 𝛼 =𝑃𝑃
���. (2-5)
In an isentropic compression, α is kept to a minimum, resulting in highest possible compression though pdV work. In principle, isentropic compression can be achieved through a carefully shaped continuously rising laser pulse, designed to gently compress without launching strong shocks. However, these continuous laser pulses have proven problematic to experimentally implement.28 As an alternative, nearly isentropic compression can also be achieved through a sequence of carefully timed shocks using a multi-picket or multi-step laser pulse.16, 28, 29, 32, 33 This is done by carefully timing a sequence of shocks to reach high compression.
Figure 2-1: 1D-marginal ignition (red solid curve) as a function of ρR and ion temperature Ti (Equation (2-4)). These
numbers are burn averaged ρR and Ti values required for self-sustained burn of the DT fuel in an implosion. The
black data point represents an energy-scaled implosion, producing a ρR of ~0.3g/cm2 and Ti~3.5keV for a laser
energy of EL ~23kJ. These numbers are the current goal of the cryogenic campaign at OMEGA.26 The arrow shows
a hydro-equivalent energy scaling34 (described in more detail in the text) to a laser energy of EL~0.7MJ28 at which
the implosion is predicted to marginally ignite at a ρR of ~1.0g/cm2
and Ti~4.0keV. This laser energy will be readily
achieved at the NIF operated in polar-direct-drive configuration.
2.2 ICF drive configurations
There are two main implosions schemes in ICF, which drive the capsule to high compression; namely direct-drive and indirect-drive, as illustrated in Figure 2-2. In the direct-drive scheme, the laser beams directly illuminate the capsule in a spherical geometry, and in the indirect-drive scheme, laser beams irradiate a cylindrical hohlraum, which produces x-rays that irradiate and implode the capsule. Direct-drive has better energy coupling to the capsule than indirect-drive, while indirect-drive has better symmetry and reduced sensitivity to the Raleigh-Taylor instability than direct drive.
2-28
Figure 2-2: The two main implosion scenarios in ICF are direct-drive (a) and indirect-drive (b). In direct drive, the laser beams directly irradiate the capsule and in indirect drive, the laser beams produce x-rays in a cylindrical hohlraum, which irradiate the capsule. Unless otherwise specified, all experiments described in this thesis were performed using the direct-drive configuration (the only exception are cryogenic experiments at the NIF discussed in Chapter 7, which utilized indirect-drive).16, 32
In both direct and indirect-drive, the implosion process can be described as follows: the driver illuminates the capsule, ablating the outer part of the capsule shell, while the remaining shell compresses and eventually starts imploding inward. In the initial phase of the implosion, the shell accelerates, followed by a coasting phase and a deceleration phase. The implosion decelerates from the increasing internal pressure, and if some of the shell remains, it eventually stagnates at which time the peak fuel density and temperature have been achieved. At this time, the core temperature and density are high enough for thermonuclear-fusion reactions to occur. The internal pressure (tens of Gbar) will subsequently disassemble and quench the burn. Figure 2-3 illustrates the main phases of the implosion process.16, 32
Figure 2-3: Illustration of the three main phases of the capsule-implosion process. Lasers or x-rays irradiate the capsule, ablating away the outer part of the shell. The remaining inner part of the capsule implodes inward, compressing and heating the core. A series of carefully timed shocks, coalesce at the inner surface of the high-density shell and propagate to the center of the implosion where they heat the hotspot just before stagnation, providing for significant fusion reactions to occur. A burn wave, supported by the DT alphas, then propagates through the main fuel.
2-29
2.3 Challenges in ICF
The ICF community is currently preparing to conduct the first credible ignition attempts at the NIF, and the word attempt is chosen to emphasize the challenges involved in these efforts. Issues such as, energy coupling, shock-timing, drive asymmetries, and hydrodynamic instabilities, must all be understood before ICF thermonuclear ignition can be realized. Understanding laser-plasma interactions is essential to efficiently deliver energy from the laser to the capsule. When the laser interacts with the capsule, it deposits energy at a critical density (also referred to as the critical surface), which is some distance away from the ablation front. The energy transport from the critical surface to the ablation front therefore relies on electron heat conduction. Laser-plasma instabilities can cause some of that energy to be reflected, reducing the capsule performance or producing hot electrons that deposit their energy past the ablation front, pre-heating the main part of the fuel and preventing effective compression. To understand how the energy flows from the critical surface to the ablation front, the electron heat conduction must be well understood. Recently, non-local heating models have been developed, which have improved the simulations of energy transport and subsequent mass assembly.36 Comparisons between simulated and measured ρRs in implosions have been used to benchmark the energy-transport models.
Understanding shock timing is an essential prerequisite for achieving maximum compression in an implosion experiment. Poorly designed shocks, both in terms of timing and strength, may result in excessive shock heating, which raises the adiabat and severely limits the compression. Carefully shaped continuous laser pulses have also proven very difficult to implement due to the formation of a strong shock after a steepening of the compression wave that is not predicted in simulations.16 One way to address this issue is to use a series of laser pickets before the main drive instead of a continuous low-adiabat laser pulse. These multi-shock laser pulses, which accurately launch the shocks, have been designed at OMEGA28 and the NIF33 (OMEGA and the NIF are discussed in the next sections) to compress the capsule. The optimal design of a laser-pulse shape is determined from a combination of efforts, such as direct measurements of the shock-timing37 using VISAR,37 and in fully integrated cryogenic experiments26, 38 using measurements of ρR.
Hydrodynamic instabilities, such as the Raleigh-Taylor (RT) instability, must be considered as well in ICF. The RT instability occurs when the interface of two fluids, with different densities, accelerates toward the heavier fluid, which causes perturbations to grow in time. The RT instability threatens the implosion during the acceleration of the shell by the lighter ablator pushing the denser shell, and during the deceleration of the shell by the lighter fuel just before stagnation. Defects in the capsule and non-uniformities in the drive will cause RT growth, causing the cold shell-material spikes to quench some of the burning core and reduce (or eliminate) the effective hot spot. In severe cases, the RT instability can tear the shell apart and significantly truncate the implosion. The RT instability is primarily driven by high-mode non-uniformities, such as capsule imperfections and speckle pattern in a single laser-beam intensity (in the case of direct drive), while compression asymmetries are driven primarily by the overall laser-drive asymmetries. For example, capsule offsets due to vibration of the positioning system can lead to significant asymmetric laser drive, which reduces the compression and generates large compression asymmetries. These asymmetries can be probed by measuring the implosion ρR at different lines-of-sight using different diagnostics.
2-30
These physics challenges must be overcome before the implosion will ignite. As decades of experimental and theoretical work have significantly improved our understanding of these and other challenges, we are now in the position to finally start exploring conditions for ignition in an ICF implosion.
2.4 The OMEGA laser facility
The OMEGA laser facility at the LLE at the University of Rochester is a 351nm, 30kJ, 60 beam laser, which is capable of running in both direct and indirect drive.22 The recently upgraded facility includes the OMEGA-EP laser, which is capable of delivering 1kJ in 1ps for advanced radiography and fast-ignition experiments. The OMEGA-EP laser operates independently but can also be directed into the OMEGA chamber for integrated experiments.39 A large fraction of the experiments described in this thesis were performed at the OMEGA laser facility.
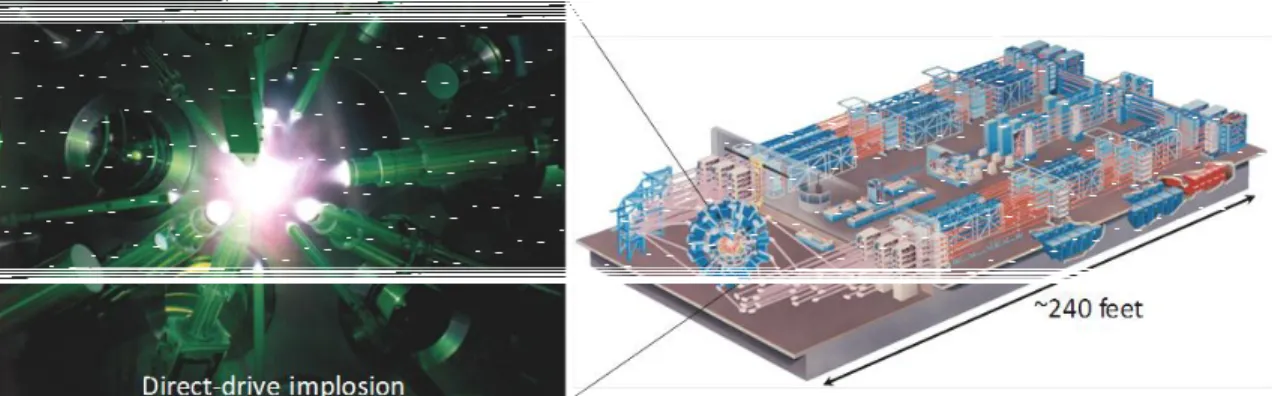
Figure 2-4 A diagram of the OMEGA laser facility at the Laboratory for Laser Energetics (LLE).22 This 60 beam, 30kJ laser system implodes capsules in a spherical target chamber. An image of a direct-drive implosion is shown to the left (Images taken by LLE).
The spherical target chamber, which is made of aluminum, has a 1.56m inner radius with 92 laser and diagnostic ports. A schematic illustration of the chamber is shown in Figure 2-5. The laser ports are shown in red and the diagnostics ports relevant to this thesis are labeled. The ten-inch-manipulator (TIM) is a generic insertion module used to place diagnostics at precise locations inside the target chamber. The CPS1 and CPS2 diagnostics are the magnet based charged particle spectrometers discussed further in Chapter 3. The Magnetic Recoil Spectrometer (MRS), which is highlighted in yellow, is the diagnostic used for most of the data discussed in this thesis.
2-31
Figure 2-5: Schematic drawing of the OMEGA target chamber, illustrating laser and diagnostic ports. The red circles are the laser ports and the yellow port is for the MRS. The location of the CPS diagnostics and TIMs are also labeled. (Diagram from LLE)
2.5 The National Ignition Facility (NIF)
The NIF, at the Lawrence Livermore National Laboratory (LLNL), is a 192 beam, 1.8MJ laser facility (see Figure 2-6), designed to achieve ignition and energy gain using the indirect-drive scheme (Polar-direct drive40 and future direct-drive upgrade capabilities also exist).41 The NIF target chamber is 5m inner radius with a wall thickness of 60cm (50cm of borated Gunite and 10cm of aluminum). A schematic of the NIF facility, and an image inside the target chamber is shown in Figure 2-6. The ports for the laser beams (marked red) and diagnostics are schematically shown in Figure 2-7. The port for the MRS is marked yellow. The Diagnostic Inserter Manipulator (DIM) has the same function at the NIF as the TIMs have at OMEGA. It is worth noting that there are only three DIMs on NIF.
TIM3 TIM5 TIM6 TIM1 TIM4 CPS1 CPS2 TIM2 XPHC XPHC XPHC MRS
2-32
Figure 2-6: The National Ignition Facility (NIF) at the Lawrence Livermore National Laboratory is the most energetic laser in the world. This laser was built to demonstrate thermonuclear ignition and energy gain in a laboratory.21 The NIF is a 1.8MJ laser with 192 laser beams, which are primarily configured in the indirect-drive configuration but can also be pointed in polar-direct-drive configuration (Images from LLNL).40, 41
Figure 2-7: A schematic of the NIF target chamber with important locations highlighted (i.e. the MRS and DIM locations). Each red spot is a quad containing 4 laser beams. The MRS is located on the 77-324 line-of-sight, and the foil is inserted by the 90-315 DIM (Diagram from N. Izumi, LLNL). Because the NIF is an indirect-drive facility, the lasers irradiate the inside of the hohlraum from the top and bottom of the chamber.
~200 m
Person
Inside the NIF chamber
90 135.5 150 30 44.5 0 0 60 120 180 240 300 5 35 65 95 125 185 215 245 305 335 DIM 90-315 DIM 0-0 64 116 77 DIM 90-78 CRYO TARPOS MRS
2-33
Fully integrated target physics experiments began at the NIF in 2009. The first cryogenic THD implosion was conducted in September 2010, and the first cryogenic DT experiment was conducted in June 2011. At the time of writing this thesis, the first ignition attempt at the NIF was imminent (<1yr).
2.6 ICF Diagnostics
Diagnosing of an ICF implosion is critical for interpreting experimental success and for gaining insights of the underlying physics governing the implosion performance. At OMEGA, diagnostics such as X-ray, neutron, gamma-ray, and charged-particle techniques have been developed during decades of experiments. X-ray diagnostics are used to image the implosion using framing cameras and CCDs (or films),42 to probe electron densities and temperatures in different regions of the implosion through the use of spectral measurements, and to determine X-ray bang time.42 Nuclear-reaction yield, Ti, ρR, and bang time are measured by neutron diagnostics,25, 43 which include techniques such as scintillator neutron time-of-flight (nTOF),44 activation,45 MRS,24, 25 and streak-camera based particle temporal diagnostics.46 Gamma rays can also be used for burn history and bang-time measurements.47 Likewise, charged-particle diagnostics are used in the determination of reaction yields, ion temperature, and ρR.48 Magnetic spectrometers, range filters,48 radio-chromic film, and CVD (chemical-vapor-deposition) diamond detectors measure the charged particle emission49 and in some cases spectra from implosions. Protons are also used for temporal measurements of the nuclear bang-time and burn width. Simulations are often used to predict the yield of a certain experimental configuration but rarely come close to predicting the actual yield observed in experiments. To fully diagnose an implosion, these different types of diagnostics are typically used simultaneously. The next chapter is devoted to charged-particle and neutron measurements.