HAL Id: hal-00296141
https://hal.archives-ouvertes.fr/hal-00296141
Submitted on 9 Feb 2007
HAL is a multi-disciplinary open access
archive for the deposit and dissemination of
sci-entific research documents, whether they are
pub-lished or not. The documents may come from
teaching and research institutions in France or
abroad, or from public or private research centers.
L’archive ouverte pluridisciplinaire HAL, est
destinée au dépôt et à la diffusion de documents
scientifiques de niveau recherche, publiés ou non,
émanant des établissements d’enseignement et de
recherche français ou étrangers, des laboratoires
publics ou privés.
precipitation and lightning activity of a
pyro-cumulonimbus
D. Rosenfeld, M. Fromm, J. Trentmann, G. Luderer, M. O. Andreae, R.
Servranckx
To cite this version:
D. Rosenfeld, M. Fromm, J. Trentmann, G. Luderer, M. O. Andreae, et al.. The Chisholm firestorm:
observed microstructure, precipitation and lightning activity of a pyro-cumulonimbus. Atmospheric
Chemistry and Physics, European Geosciences Union, 2007, 7 (3), pp.645-659. �hal-00296141�
under a Creative Commons License.
and Physics
The Chisholm firestorm: observed microstructure, precipitation and
lightning activity of a pyro-cumulonimbus
D. Rosenfeld1, M. Fromm2, J. Trentmann3, G. Luderer4,*, M. O. Andreae4, and R. Servranckx5
1Institute of Earth Sciences, The Hebrew University of Jerusalem, Israel 2Naval Research laboratory, Washington, D.C. 20375, USA
3Institute for Atmospheric Physics, University of Mainz, Germany 4Max Planck Institute for Chemistry, Mainz, Germany
5Canadian Meteorological Centre, Meteorological Service of Canada, Montreal, Canada *now at: Umweltbundesamt, Dessau, Germany
Received: 14 August 2006 – Published in Atmos. Chem. Phys. Discuss.: 9 October 2006 Revised: 23 January 2007 – Accepted: 6 February 2007 – Published: 9 February 2007
Abstract. A fire storm that occurred on 28 May 2001 and devastated the town of Chisholm, ∼150 km north of Ed-monton, Alberta, induced a violent fire-invigorated cumu-lonimbus cloud. This pyro-cumulonimbus (pyro-Cb) had overshooting tops of 2.5–3 km above the tropopause, and injected massive amounts of smoke into the lower strato-sphere. Fortunately, this event occurred under good cov-erage of radar, rain gauge, lightning and satellite measure-ments, which allowed in-depth documentation of the event, and gave us an opportunity to study the cloud top morphol-ogy and microstructure, precipitation and cloud electrifica-tion of the pyro-Cb.
The combination of heat and smoke created a cloud with extremely small drops, which ascended rapidly in violent updrafts. There appeared to be little freezing up to the ho-mogeneous freezing isotherm level of −38◦C. A cloud with
such small and short-lived highly supercooled drops is inca-pable of producing precipitation except for few large grau-pel and hail, which produced the observed radar echoes and charged the cloud with positive lightning. The small cloud drops froze homogeneously to equally small ice particles, for which there is no mechanism to aggregate into precipita-tion particles, and which hence remain in the anvil. The lack of significant precipitation implies that only a small fraction of the smoke is scavenged, so that most of it is exhausted through the anvil to the upper troposphere and lower strato-sphere.
Comparisons with other cases suggest that a pyro-Cb does not have to be as violent as the Chisholm case for precipita-tion to be strongly suppressed. However, this level of con-vective vigor is necessary to create the overshooting updraft that injects the smoke into the lower stratosphere.
Correspondence to: D. Rosenfeld
(daniel.rosenfeld@huji.ac.il)
1 Introduction
Pyro-Cumulonimbus (pyro-Cb) are clouds that feed directly from the heat and smoke of a large fire. Pyro-Cb are the most extreme form of microphysically continental clouds, i.e., clouds with large concentrations of small drops that are slow to coalesce into rain drops. This is so for two main reasons:
1. Smoke from vegetation fires produces large concentra-tions of cloud condensation nuclei (CCN) that, when in-gested into clouds, induce high concentrations of small drops (Warner and Twomey, 1967; Hallett et al., 1989; Rogers et al., 1991).
2. The large amounts of heat generated by forest fires with their high fuel density produce very strong updrafts at cloud base, which produce a sufficiently large vapor su-persaturation to nucleate a large number of the smoke particles into cloud drops.
In this study we explore the physical nature – mainly the mi-crostucture, precipitation and electrification – of this most extreme form of microphysically continental cloud. The combination of these observations with simulation studies of the same storm (Luderer et al., 2006; Trentmann et al., 2006) provide new insights to the respective roles of the heat and smoke in shaping the properties of the pyro-Cb. An impor-tant inference is that much of the smoke that enters cloud base is exhausted from cloud top without being scavenged due to the suppressed precipitation.
In intense cases of pyro-Cb, the large amount of heating yields clouds with the features of severe convective storms, including large hail and tornados, as documented for the Jan-uary 2003 firestorm in Canberra, Australia (Fromm et al.,
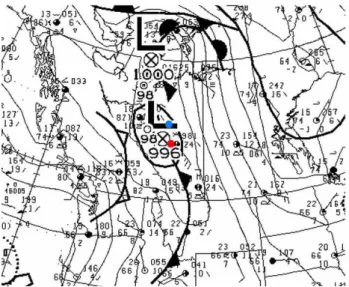
Fig. 1. Surface weather analysis valid at 00:00 UTC, 29 May 2001 and showing the location of the Stony Plain (Edmonton) radiosonde station (red dot) and the Chisholm fire (blue dot). The Carvel radar is 14 km to the west of the radiosonde station. Source: Digital archives of the Canadian Meteorological Centre, Meteorological Service of Canada.
2006). The intense updrafts overshoot into the lower strato-sphere, and transport into there large amounts of smoke that have major impacts on the aerosol burden in this region (Fromm et al., 2005, 2006). These carbonaceous aerosols probably induce an enhancement of both reflectance and ab-sorption of solar radiation, and hence may have a radiative impact at and below the injection height.
Based on satellite imagery, Total Ozone Mapping Spec-trometer (TOMS) aerosol index (AI), and profiles of aerosol extinction, the Chisholm pyro-Cb appears to have been com-parable in its extreme character with the Norman Wells (Fromm et al., 2005) and the Canberra pyro-Cbs (Fromm et al., 2006). In all three cases, the TOMS AI attained values between 25 and 32, the largest ever recorded. The Chisholm AI plume (Fromm et al., 20071) was the greatest of these. Such large values of AI occur when the plume is optically opaque in the UV (and likely in the visible), highly absorb-ing, and high in altitude. Such high AI values were first doc-umented by Fromm et al. (2005) for smoke plumes of pyro-Cb.
The morning following the convective “blowup,” both the Norman Wells and Chisholm plumes took on the unique sig-nature of gray reflectivity in the visible and cold tempera-tures in the 11 µm IR (i.e., brightness temperature <−40◦C). Moreover, both the Norman Wells and Chisholm pyro-Cbs in convective maturity displayed visible plumes above the anvil 1Fromm, M., Shettle, E., Torres, O., Diner, D., Khan, R.,
Servranckx, R., and Vant Hull, B.: The stratospheric impact of the Chisholm pyrocumulonimbus, Part I: the nadir-viewer story (TOMS, MODIS, MISR), in preparation, 2007.
Fig. 2. A picture of the pyro-Cb taken to the NW from a fire fighter airplane at 01:30 UTC, shortly after the major explosive growth of the cloud started. Credit: Alberta Government.
cloud tops in the lowermost stratosphere that persisted for days. The downstream effect of the Norman Wells and Can-berra pyro-Cbs was gauged as a 2-fold (CanCan-berra) to 5-fold (Norman Wells) increase in zonal average lower stratospheric aerosol optical depth (AOD) at 1 µm, and detectable aerosol increased at potential temperatures greater than 400 K. Ac-cording to Fromm et al. (2007)1the Chisholm stratospheric impact in terms of zonal average AOD was on the order of the Canberra injection. Smoke layers from the Chisholm fire were observed as high as 450 K, which corresponds to an al-titude of about 18 km in this case.
Precipitation-forming processes in tropical clouds ingest-ing smoke from forest fires were observed to be suppressed up to the −10◦C isotherm level (Rosenfeld, 1999; Rosenfeld and Woodley, 2003). In situ measurements in pyro-Cb in the Amazon showed that they had much smaller drops than other clouds, even those developing in ambient heavy smoke (An-dreae et al., 2004), and hence precipitation was expected to be suppressed to an even greater extent. Unfortunately, no in situ aircraft measurements are available in pyro-Cb above the 0◦C isotherm level.
Aircraft measurements revealed that cloud droplets that ascend in microphysically continental clouds at rates >30 m s−1can remain liquid all the way to the homogeneous freezing isotherm of −38◦C, and produce little precipitation
other than large hailstones (Rosenfeld et al., 2006) even when smoke and heat from fires are not involved.
Here we study a major firestorm that created a violent pyro-Cb, which fortunately occurred under good coverage of radar, rain gauge, lightning and satellite measurements that allow us to reach some insights. This firestorm occurred near Chisholm, about 150 km to the north of Edmonton, Alberta, Canada. This location is marked on the synoptic map shown in Fig. 1 as a blue dot. Strong south-southeast winds ahead of an approaching cold front created a rapidly expanding fire
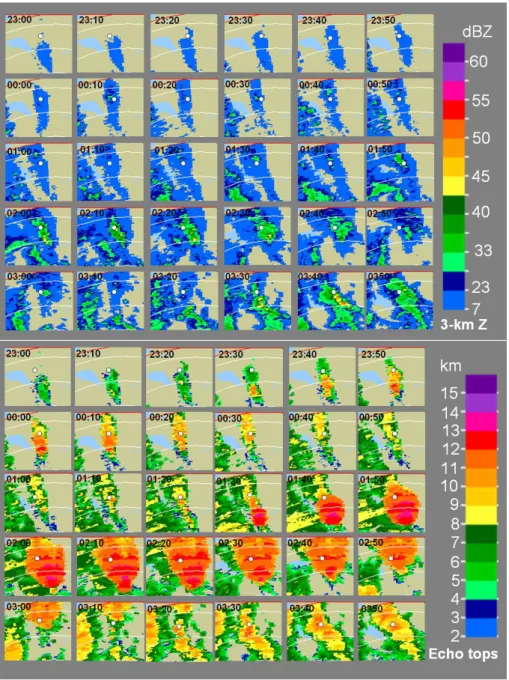
Fig. 3. Radar images of the time evolution of the Chisholm pyro-Cb, for the 5 h starting at 23:00 UTC of 28 May 2001. The upper part shows the low level reflectivity [dBZ] and the lower part shows the echo tops [km]. The radar horizon at the range of 200 km is at a height of 4.5 km. Each panel is 95×100 km. The range circles are of 200 and 240 km to the north of the radar. The high echo tops are dominated by the pyro-Cb until 03:00, after which after rain clouds replace it. The white circle in the middle is the location of the rain gauge of Marten Hills. The lakes in the overlay map are colored light blue in all the figures of radar images. Animation of the radar echo top heights is available here: http://www.atmos-chem-phys.net/7/645/2007/acp-7-645-2007-supplement.zip.
on the 28 May 2001. The combination of heat from the fire, increasing winds and decreased atmospheric stability just ahead of the frontal passage produced an explosive pyro-Cb, shown in Fig. 2 (Luderer et al., 2006; Trentmann et al., 2006).
According to the report on the Chisholm fire prepared by the local officials in 2001 (ASRD, 2001), more than 50 000 ha of forest burned in the time span from 23:00 UTC
of 28 May 2001 until 06:00 UTC of 29 May. Most of the burning probably occurred before the arrival of the frontal rain band at 03:00 UTC. With a fuel consump-tion of 7.6 kg m−2 and a specific combustion energy of 18 700 kJ kg−1, the sensible heat release during the inten-sive phase of the Chisholm fire was 71×109MJ. The heat release was calculated at 200 kW m−1of head fire intensity, for a fire front 25 km long (ASRD, 2001). For comparison,
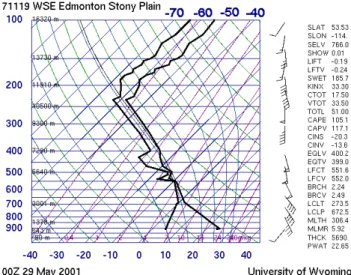
Fig. 4. The Edmonton sounding on 29 May 2001, 00:00 UTC.
the explosive yield of TNT, the standard unit in which nu-clear yields are expressed, is 4.2×10⁹MJ per million ton (MT) of TNT. This means that the Chisholm fire was about equivalent to 17 large hydrogen bombs with a yield of 1 MT. The Hiroshima bomb had about 12–15 kT, and therefore the Chisholm firestorm would be equivalent to about 1200 of such explosions, at a rate of 3–5 such explosions per minute. Even though the energy release from the fire is enormous, model simulations suggest that the energy released from condensation and freezing of water in the convective cloud dominates the overall energy budget of the pyro-convection (Trentmann et al., 2006; Luderer et al., 2006). There is a positive correlation between the energy release from the fire and the injection height as found from observations (Lavoue et al., 2000), which is explained by a positive feedback be-tween sensible heat flux and latent heat release (Luderer et al., 2006).
The development of the pyro-Cb is shown in Fig. 3 as a radar time sequence of 3-km reflectivity and echo top heights. The location of the radar is marked as a red dot in Fig. 1. The sequence shows three phases:
1. Until 01:20 UTC of 29 May 2001: The pyro-Cb is iso-lated and pulsating with new feeder towers every 15– 20 min reaching similar intensity, with echo tops not ex-ceeding 12 km (phase-1 pyro-Cb).
2. 01:30–03:00: The explosive phase when the leading edge of the cloud band of the cold front approaches and merges with the pyro-Cb. Echo tops reach up to 14 km, which is an overshoot of up to 3 km above the tropopause (phase-2 pyro-Cb).
3. After 03:00: The precipitating frontal clouds take over and help diminish the fire.
2 Cloud top height
The firestorm was fanned by strong south-easterly winds ahead of a cold front that approached from the west. The pyro-cloud reached its peak explosive development at 02:00 UTC on 29 May 2001, the arrival time of the leading edge of the frontal cloud band at the firestorm. The sound-ing in the pre-frontal air mass indicated a tropopause height of 11 000 m with a temperature of −58◦C. The sounding was taken 150 km to the south (upwind) 2 h before the peak of the pyro-Cb, so that it was quite representative (Fig. 4). Based on European Centre for Medium-Range Weather Forecasts (ECMWF) data, Trentmann et al. (2006) located the dynami-cal tropopause for the Chisholm fire at an altitude of 11.2 km. The smoke was injected into the lower stratosphere well above the tropopause at a height that could not be quantified previously (Fromm and Servranckx, 2003). The height of the stratospheric intrusion of the smoke is of major interest, be-cause it affects the longevity of the smoke in the stratosphere as well as its chemical and physical impacts. It is also an in-dicator of the extent of the overshoot of the cloud top above the tropopause, which is in turn a measure of the vigor and the updraft velocity of the pyro-Cb.
The overshooting nature of the cloud top well above the tropopause was estimated by multiple methods. A new anal-ysis of the Chisholm pyro-Cb’s impact on the stratosphere Fromm et al. (2007)1found that the smoke plume at mid-day (∼19:00 UTC, 11:00 local) on 29 May resided at altitudes as high as 15 km. Two methods were used to provide constraints on plume height – back trajectory analysis and stereographic cloud height from the Multi-angle Imaging Spectroradiome-ter (MISR) (Diner et al., 1988). The trajectories were initi-ated at the time and location of MISR stratospheric smoke observations to confirm the passage over the Chisholm pyro-Cb during active convection (00:00–03:00 UTC). Moreover the plume characteristics, in terms of smoke “color” and in-frared brightness temperature (similar to Fig. 5 of Fromm and Servranckx, 2003) of Terra MODIS (simultaneous with MISR) showed that portions of the plume were smoky and opaque at tropopause-level brightness temperatures.
3 Cloud top temperature
A NOAA-AVHRR overpass occurred at 02:20 UTC (Fig. 5), fortuitously very near the time of the maximum intensity of the pyro-Cb. The AVHRR image shows clearly the mush-room cloud overshooting at its center, as indicated by the shadow at point B in Fig. 5. The image shows that the cloud reached its maximum height at the overshooting top between C and D, and sloped down towards its periphery at A and F. The plume on top of the convection between B and D in the transect shown in Fig. 5 is reminiscent of the plume fea-tures described by Setvak et al. (2003) on top of vigorous deep convection. Considering the similarity of the visible
B H G F A C D E 0 0.2 0.4 0.6 0.8 1 1.2 -70 -60 -50 -40 -30 -20 -10 -116 -115.5 -115 -114.5 -114 -113.5 0.65 μm Reflectance
3.7 μm reflectance 10.8 12.0 μm B.Tempμm B.Temp
R e fl e c ta n c e B rig h tn e s s T e m p e ra tu re [ o C ]
Longitude [degrees west]
A H G F F B C D E
Pahse-2 Pyro-Cb, Chisholm 2001 05 29 02:20 NOAA15 B, E: Anvil top at -62 to -66oC
C,D: Stratospheric overshoot to the -52oC isotherm
H: Ambient anvils at -40oC
I: Drifted old anvil of the Phase-1 Pyro-Cb at -60oC
I
K L
J
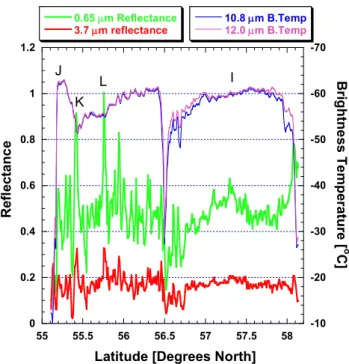
Fig. 5. Analysis of the cloud top structure of the Chisholm pyro-Cb and adjacent clouds, based on the NOAA-AVHRR overpass on 29 May 2001, 02:20 UTC. The image is an RGB composite where the visible channel modulates the red, 3.7 µm reflectance modulates the green, and 10.8 µm brightness temperature modulates the blue (after Rosenfeld and Lensky, 1998). The cloud marked with I is the remnant of phase-1, which is an earlier and weaker pulse of the same pyro-Cb (see Figs. 7 and 9), that drifted downwind. The southernmost cloud is the pyro-Cb at the peak of phase-2. The vertical line corresponds to the cross section shown in Fig. 6. The inset shows the variation of cloud top parameters (visible and 3.7 µm reflectance, 10.8 and 12.0 µm brightness temperatures) along the line A-H across the pyro-Cb. The outlines of the lakes are shown as thin red lines overlay in all the figures of satellite images.
and 3.7 µm reflectances of the filament on top of the anvil (streaming north-northeast from point C), this filament likely originated from the overshooting top of the cloud.
The inset line graph shows the cloud top properties along the cross section A–H. According to Inoue (1987), the actual cloud top temperature nearly equals the cloud top thermal brightness temperature only when the brightness temperature difference (BTD) between the 10.8 and 12.0 µm channels is very small, within a fraction of a degree. A BTD>1◦C is observed only at the edge of the mushroom cloud, indicating its thinning there, whereas BTD remains near zero at areas A–E, suggesting very dense and opaque cloud matter near the cloud top. The emissivity of such ice clouds at these wavelengths is close to unity, and hence the brightness tem-perature can be regarded as representing the actual cloud top temperature.
The cloud top temperature toward the periphery (for in-stance, points A, B, E of Fig. 5) is −60 to −62◦C, in agree-ment with the sounding temperature of −59.7 to −60.5 at 1300–1600 m above the tropopause. Moving along the A-F transect toward the interior of this active convection-cloud top, it is reasonable to expect that the ascending cloud would cool adiabatically below the ambient stratospheric tempera-tures and thus lower than the cloud-periphery temperature.
However, the opposite is observed, probably due to strong mixing of the cloud top with the ambient warmer air above the tropopause. Specifically, the temperature increases when approaching the visibly highest point at C, reaching −52◦C there. The closest ambient temperature to that above the tropopause is −53.7◦C which occurs at a height of 14 km,
implying an overshoot of 3 km above the tropopause. The warmest point occurred at point C of Fig. 5, where model calculations (Luderer et al., 20072; Trentmann et al., 2006) suggest that it represents dynamically warmed stratospheric air that descended downwind of the leading edge of the over-shooting cloud. However, this explanation is less likely to fully explain point K of Figs. 5 and 6, which is as warm as point C, but represents an actively overshooting tower. This is evident by the bright spot (the spike in 0.65 µm reflectance in Fig. 6) at point K, which strongly reflects the sunlight from the WNW side of the overshooting tower. Point C is indeed close to the downshear side of the tower so that dynamic heating may be expected there, but the “warm” temperature 2Luderer, G., Trentmann, J., Hungersh¨ofer, K., et al.: The role
of small scale processes in troposphere-to-stratosphere transport by pyro-convection, Atmos. Chem. Phys. Discuss., in preparation, 2007.
0 0.2 0.4 0.6 0.8 1 1.2 -70 -60 -50 -40 -30 -20 -10 55 55.5 56 56.5 57 57.5 58 0.65 μm Reflectance 3.7 μm reflectance 10.8 μm B.Temp 12.0 μm B.Temp R e fl e c ta n c e B rig h tn e s s T e m p e ra tu re [ o C ]
Latitude [Degrees North]
J K
L I
Fig. 6. A south-north cross section through the two pulses that con-stituted the two phases of the pyro-Cb, shown in Fig. 5. The new and more vigorous cloud phase-2 cloud is the left (south). The up-shear and the region just downwind the peak of the overshooting top are marked with a conspicuous pair of cold and warm points at 55.3 N and 55.4 N (between J and K), respectively. The elevated overshooting part appears as a warm anomaly between K and L. At this time the old anvil of the phase-1 Pyro-Cb lost these features, as seen near point I.
(−54◦C) at point K on the upshear side (i.e., the side of the new growth) of that overshooting small tower makes dy-namic warming a less likely explanation.
The temperature of the upwind side of the shoulder of the cloud (points B and J) decreases to a minimum of −66◦C, well below any ambient temperature in the upper tropo-sphere and lower stratotropo-sphere seen in the soundings, where the lowest temperature is −61◦C (Fig. 4). This can be inter-preted only as exposure of the core of the fresh overshoot-ing updraft to the view of the satellite sensor, which adia-batically cools below the ambient temperature at the over-shooting heights. Assuming an equilibrium temperature of −59◦C at the tropopause, the cloud element in B is 700 m above the tropopause. A shadow is cast on this point by a cloud tower that overshoots to even greater height. Ac-cording to the length of the shadow and the illumination and viewing geometry, the central tower extends to an additional 1800±300 m, where 300 m represents an uncertainty of one pixel for the length of the shadow. This brings the height of the top of the overshooting cloud to about 2500 m above the tropopause and perhaps more, if the −66◦C reflects a mixture of the overshooting cloud temperature in point A of Fig. 5 and the ambient air. The south-north cross section shown in
Fig. 6 replicates these features, but does not cut through the points of the most extreme values anywhere at the cloud top. The radar showed echo top heights of 12–13 km, with a single point reaching 14 km during the scans of 01:50 and 02:20 UTC (see Fig. 3). The radar is located at Carvel, 53.5603◦N 114.1439◦W (decimal degrees) at an elevation of 748 m above sea level (see location as the red dot on the map in Fig. 1). It has a wavelength of 5.33 cm and beam width of 1.1 degrees. The radar minimum detectable signal at the range of the pyro-Cb was about 8 dBZ, which corre-sponds to the detection of very light rain or moderate drizzle. Hence the echo-top cloud-height determination is conserva-tive if the spectrum of topmost particles includes smoke or small smoky cirrus particles.
In conclusion, all the methods of cloud top height measurements consistently show a cloud top height of about 13.5 km, which is an overshoot of 2.5 km above the tropopause. The uncertainty in the measurements could al-low for an overshoot of 3 km, but no more than that.
4 Cloud microstructure and precipitation-forming pro-cesses
Smoke particles from forest fires serve as good CCN, caus-ing the clouds to contain larger number concentrations of smaller drops (Kaufman and Fraser, 1977; Andreae et al., 2004). Smoky clouds were previously observed to manifest suppressed warm rain processes (Rosenfeld, 1999; Andreae et al., 2004). This preserves much cloud water to be lifted to heights where it becomes highly supercooled and available for the formation of large hailstones (Andreae et al., 2004). In fact, soot-blackened hailstones were the only precipitation reported to fall from the Canberra firestorm (Fromm et al., 2006).
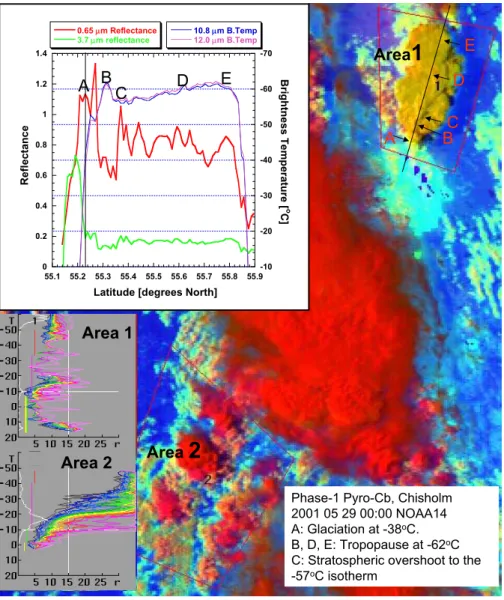
According to the satellite analysis of the first phase py-roCb shown in Fig. 7, the smoke had a dramatic impact on the cloud microstructure. To start with, the pyro-Cb anvil appears yellow in our false-color representation, whereas the anvils of the ambient smoke-free clouds appear red. The yel-low color is contributed by the high intensity of green, which represents the high reflectance in the 3.7 µm channel caused by the extremely small size of the cloud ice particles. This is quantified by the plot of cloud top temperature (T) vs. indi-cated effective radius (re)for the cloud tops within area 1 in
Fig. 7, shown in the upper inset T-regraph of that figure.
The T-rerelations for the pyro-Cb (Area 1 of Fig. 7) show
extremely small rewith median values not exceeding 11 µm
well above the homogeneous freezing isotherm of −38◦C. These values are well below the precipitation threshold of about 12–14 µm (Rosenfeld and Gutman, 1994), indicat-ing lack of significant precipitation-formindicat-ing processes in the pyro-Cb. This supports the suggestion that most cloud water remains supercooled up to the homogeneous freezing level. Clouds in which a large fraction of the water reaches the
0 0.2 0.4 0.6 0.8 1 1.2 1.4 -70 -60 -50 -40 -30 -20 -10 55.1 55.2 55.3 55.4 55.5 55.6 55.7 55.8 55.9 0.65 μm Reflectance
3.7 μm reflectance 10.8 12.0 μm B.Tempμm B.Temp
R e fl e c ta n c e B ri g h tn e s s T e m p e ra tu re [ o C ]
Latitude [degrees North]
Area 1
Area 2
Area
2
Area
1
A
A
B
B
C
C
D
D
E
E
Phase-1 Pyro-Cb, Chisholm 2001 05 29 00:00 NOAA14 A: Glaciation at -38oC.
B, D, E: Tropopause at -62oC
C: Stratospheric overshoot to the -57oC isotherm
Fig. 7. Analysis of the cloud top microstructure of the phase-1 Chisholm Pyro-Cb and adjacent clouds, based on the NOAA-AVHRR overpass on 29 May 2001, 00:00 UTC. The colors are as in Fig. 5. A cross section shown in the upper inset reveals similar features as in Fig. 5. The pyro-Cb is the bright yellow cloud in Area 1. Area 2 represents ambient clouds that are not affected by the smoke. The lower two inset graphs show the relations between the cloud top temperature (T) and the indicated cloud top particle effective radius (re), using the method
of Rosenfeld and Lensky (1998). The colors represent various percentiles of refor the same T, where the green is the median. Note the
dramatically reduced reof the pyro-Cb compared to the ambient clouds.
homogeneous freezing level still in liquid form were already observed in much less extreme convection (Rosenfeld and Woodley, 2000) as well as in severe hailstorms (Rosenfeld et al., 2006). This can happen only when precipitation pro-cesses of both warm and mixed phases do not have time to progress and deplete the cloud water during the limited time that the cloudy air ascends from cloud base to the homoge-neous freezing level. This is likely to be the case in a pyro-Cb for the following two reasons: (1) the dense smoke com-bined with a strong updraft at cloud base causes the nucle-ation of extremely high concentrnucle-ations of very small cloud drops, which are slow to coalesce and to freeze; (2) the strong updraft induced by the heat of the fire leaves only little time for the precipitation forming processes to progress.
In contrast, the smoke-free clouds in area 2 are still quite microphysically continental, according to the classification of Rosenfeld and Lensky (1998). But in these clouds, re
increases with height or with decreasing T to re>14 µm at
T<−20◦C, indicating the dominance of mixed phase pre-cipitation forming processes above that level. The indi-cated re of the anvil reaches the saturation value of 35 µm,
which indicates the dominance of relatively large ice crys-tals. In contrast, the value of re=11 µm at the anvils of
the pyro-Cb is consistent with a composition of homoge-neously frozen small cloud droplets. To further separate the respective roles of updrafts and aerosols in the formation of the extremely small cloud drops that mostly freeze homoge-neously, much weaker pyro-Cb clouds without overshooting
1
1
2
2
3
3
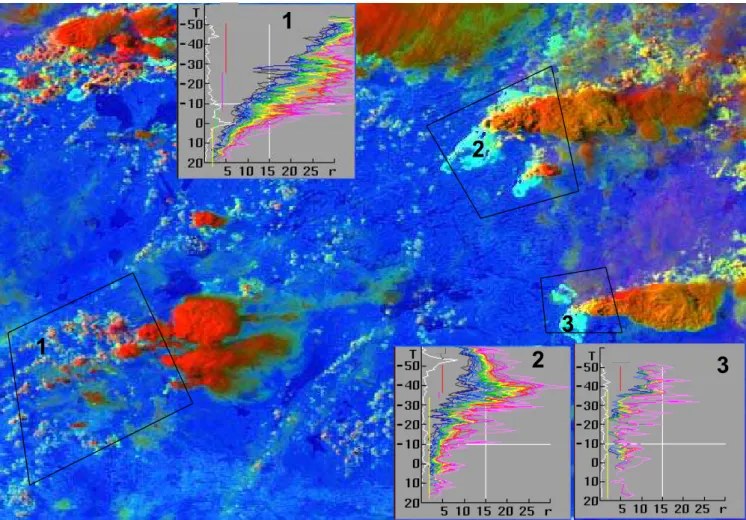
Fig. 8. Analysis of cloud top structure of two pyro-Cbs in Canada at 55◦N 105◦W and at 57◦N 105◦W and adjacent clouds, based on the NOAA-AVHRR overpass on 27 June 2002, 23:59 UTC. The T-reof a natural Cb (Area 1) and of the two pyro-Cb clouds (Areas 2 and 3)
show a similar microstructure as for the clouds in the Chisholm event. Cloud 3 is capped at −50◦C and is apparently not overshooting at the time of the image. However it does have extremely small reup to the homogeneous freezing level of −38◦C, where the drops must freeze
into ice particles with apparently very small indicated re. The reof the unperturbed cloud exceeds the precipitation threshold of ∼15 µm at
the −10◦C isotherm level.
tops were analyzed in Fig. 8. This pyroconvective episode occurred in Manitoba and Saskatchewan in June 2002. The pyro-Cb in areas 2 and 3 of Fig. 8 are not nearly as vigor-ous as the Chisholm case, but have similarly small cloud top particle effective radius, whereas the ambient cloud in Area 1 has a much greater effective radius.
These observations alone cannot separate the relative im-portance of the high updraft velocities at cloud base and the smoke aerosol in explaining the extremely small cloud drops. However, Luderer et al. (2006) simulated this pyro-Cb with and without aerosol emissions from the fire. Their results suggest that the reduced size of the small droplets is indeed mainly caused by the high aerosol burden and not by the dy-namics (compare their Figs. 7a and b). Without the smoke aerosols, but with the enhanced updraft velocity due to the heat from the fire, the size of the small hydrometeors is sub-stantially larger. The effect for the larger hydrometeors,
how-ever, is not as straightforward. Spectral bin models are re-quired in order to provide more accurate insights in the fu-ture.
The combined observations and simulations show the dominant role of the smoke particles in creating the ex-tremely small cloud drops that mostly freeze homogeneously, thereby effectively suppressing precipitation-forming pro-cesses.
The cross section shown in Fig. 7 for the phase-1 Chisholm pyro-Cb has features similar to those in Figs. 5 and 6 for the phase-2 pyro-Cb, suggesting overshooting tops, but of lesser magnitude; the 00:00 UTC temperature minimum was −61◦C as compared to −66◦C at 02:20 UTC. The height in the sounding where the ambient temperature is similar to that of the anvil top at 00:00 UTC is about 12.5 km, which is about 1.5 km above the tropopause (see Fig. 4). We note that the radar echo-top sequence in Fig. 3 is consistent with the
AVHRR 29 May 2001 00:00 UTC
Echo tops
3-km reflectivity
A
B
B
A
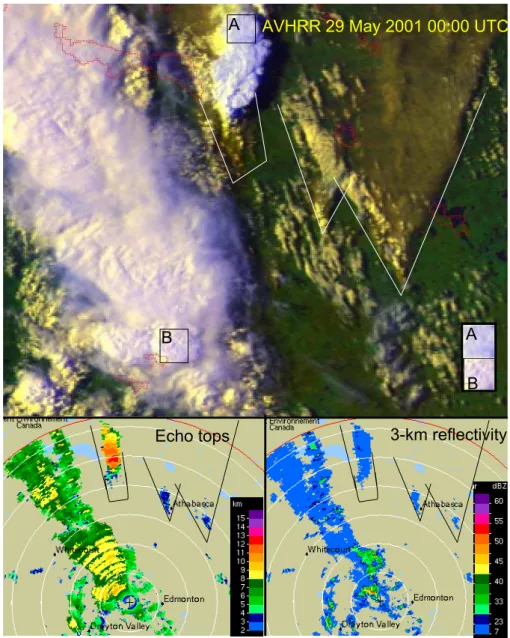
Fig. 9. Satellite and radar images of the smoke, clouds and precipitation of the Chisholm pyro-Cb and adjacent clouds on 29 May 2001, 00:00 UTC. The AVHRR image is a composite of red for the visible, green for the 0.8 µm, and inverted blue for the 10.8 µm temperature. The smoke is seen originating and fanning from three locations, marked by the lines on the radar images. The smoke itself creates radar echoes, probably reflected from the flying ash. The echo tops of the pyro-Cb are by far the highest, but the intensity of the low level precipitation echoes is much weaker than that of other less vertically developed smoke-free clouds. The smoke darkened the top of the Pyro-Cb, as can be seen by comparing the brightness of a smoky cloud area (A) with smoke-free cloud (B). The comparison is facilitated by the copies of the two cloud patches at lower right part of the image.
satellite imagery, which fortuitously was at the time of the peaks in both phases 1 and 2.
The smoke feeding into the cloud is more absorbing in the visible light than the cloud drops. The condensation of water on the smoke particles and the formation of a smoky cloud thus results in a sharp increase in visible reflectance at the height of the water cloud base level (see the bright small clouds within the marked dark heavy smoke plumes in the eastern half of Fig. 9). This is also the case for the
3.7 µm reflectance, and causes the retrieved reof the darker
pure smoke to appear with large re, (see refor T>10◦C in the
T-regraph for area 1 in Fig. 7, which comes from the area to
the south of point A of area 1) while in reality the smoke particles are much smaller than the cloud droplets. On the other hand, the smoke-laden top of the pyro-Cb cloud (for reference, see area A in Fig. 9) appears darker in the visi-ble light than the smoke-free cloud (area B of Fig. 9), sim-ilar to the pyro-Cb cluster in Fig. 6 of Fromm et al. (2005).
Fig. 10. Histogram of the visible reflectance levels at the flat part of the anvil top of a normal (red line) and pyro-Cb (black line). The histograms correspond to areas A and B from the pyro-Cb and normal Cb in Fig. 9, respectively. The reflectance values are in relative units ranging between 0 and 255. Note the significantly lower reflectance of the pyro-Cb.
Quantitatively, the 0.65 µm reflectance is smaller by more than 10% in the smoky cloud as compared to the smoke-free clouds (see histograms in Fig. 10).
Figure 9 also shows clearly that plumes or clouds of mostly pure smoke, which could not have produced precipi-tation, do in this case produce radar echoes (see the two fan-ning plumes spreading from fires southeast of Chisholm in Fig. 9). The echo tops and 3-km reflectivity indicate weak, low-topped returns from these plumes. Figure 11 shows that, according to the radar, the smoky cloud from the Chisholm fire rises rapidly to more than 13 km with very weak reflec-tivities of ∼25 dBZ, which translates to negligible precipita-tion rate. More intense precipitaprecipita-tion echoes develop only 10– 20 km further downwind, just below the homogeneous freez-ing isotherm, which is at an altitude of 8.5 km. The lack of enhanced echoes above that height is consistent with the sug-gestion that there is little aggregation of the extremely small ice particles, which are probably formed as homogeneously frozen small cloud drops. The suppressed precipitation in the pyro-Cb is evident also in the radar images of Fig. 9, where the echo tops of the pyro-Cb are by far the highest, but the intensity of the low level precipitation echoes is much weaker than that of other less vertically-developed smoke-free clouds.
The differences in the radar echoes between pyro-Cb and deep non-pyro convection can be evaluated also by track-ing the time evolution of the radar echoes of the most in-tense pyro-Cb and “normal” Cb that were observed in the radar sequence shown in Fig. 3 and the animation therein. The tracked normal Cb is the one just to the right of the lower right corner of the text box in Fig. 5. This is a tropopause-deep Cb spawned along the cold front ∼40– 60 km north-northwest of Carvel radar, which then moved north to ∼120 km away at 02:20 UT. The tracked pyro-Cb is
the one that peaked at 02:20 UT. The tracked echo top height and peak low level reflectivity are shown in Fig. 12, which show that the pyro-Cb produced much smaller reflectivity de-spite its greater vertical development. The time required for development of maximum precipitation echo intensities was more than double for the pyro-Cb in spite its greater vigor. Both observations are indicative of suppressed precipitation processes in the pyro-Cb.
Figure 13 provides additional evidence that the main pre-cipitation did not occur at the main updraft and overshooting tower, but rather downwind of that region. The location of the most intense radar echoes in the cloud at 02:20 UTC is marked by the red circles in Fig. 13, which are located to the north-northwest of the upshear part of the overshooting tower. The temperature of the overshoot was considerably warmer than the lower background anvil (see Fig. 13b), as al-ready shown in Sect. 3, indicating their deep penetration and mixing into the stratosphere. The reflectivities of these visi-bly vigorous towers (see Fig. 13a) are <20 dBZ. The whole upshear part of the anvil produced similarly weak echoes, indicating only small particles such as ice crystals and possi-bly large pieces of ash, char or debris created by the firestorm and lofted with the violent updrafts. The 20 dBZ echo top of the maturing parts of the anvil descended downwind, indicat-ing the slow gravitational deposition of the precipitation size particles.
5 Electrical activity
The Canadian Lightning Detection Network (CLDN) con-sists of 81 sensors that detect lightning over most of Canada, from its southern boundary to approximately 65◦N in the far
west and 55◦N in the far east, and offshore to about 300 km. It is owned by Environment Canada and operated by Global Atmospherics, Inc. The CLDN uses a mix of 26 Improved Accuracy from Combined Technology/Enhanced Sensitivity (IMPACT/ES) sensors and 55 Lightning Position and Track-ing System (LPATS-IV) time-of-arrival (TOA) sensors. The individual sensors pick up information about lightning events such as the location relative to the sensor, the time of the event using Global Positioning System (GPS) time, the am-plitude and polarity (Burrows et al., 2002; Orville et al., 2002).
The recorded lightning activity shows that lightning oc-curred in both the ambient clouds and the pyro-Cb, but with distinct differences (Fig. 14). The pyro-Cb is characterized by a high density of high-intensity, positive lightning, while most lightning produced in the ambient clouds has nega-tive polarity. This observation supports the hypothesis of Williams et al. (2005), who proposed that (1) the flash rate increases with increasing updraft speed and (2) inverted po-larity in thunderstorms (leading to positive lightning) is the results of a high liquid water content in the mixed phase re-gion of the cloud.
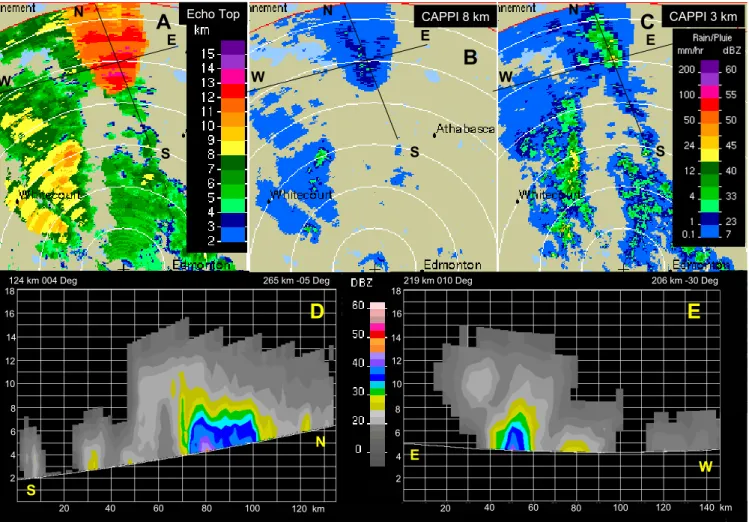
W E
A
S S S W E W E 265 km -05 Deg 18 16 14 12 10 8 6 4 2 20 40 60 80 100 120 km 20 40 60 80 100 120 140 km 124 km 004 Deg 18 16 14 12 10 8 6 4 2 219 km 010 Deg 206 km -30 Deg S N W EA
B
C
D
E
Fig. 11. Radar views of the echoes reflected from the phase-2 Pyro-Cb (the red area at the upper left panel) and the ambient precipitation, at 29 May 2001, 02:20 UTC. The radar is located at Edmonton, with 40 km range rings. The range limit is at 256 km. The panels are (A): echo top height [km]; (B): Reflectivity at height of 8 km [dBZ]; (C): Reflectivity at height of 3 km [dBZ] or lowest scanned level at the ranges where the radar horizon >3 km; (D): North-south vertical cross section between N and S; (E): East-west cross section between E and W.
Positive lightning is known to occur mainly in two situa-tions:
1. Severe convective storms (large hail and tornadic storms) in areas with a gradient of dew point from trop-ical (i.e., cloud base temperatures 20◦C) to drier condi-tions (Carey et al., 2003a, b).
2. Pyro-clouds that ingest smoke from forest fires (Jung-wirth et al., 2005).
The Chisholm firestorm produced a cloud that could be clas-sified as a “severe storm.” Similar firestorms have been docu-mented to produce tornados (Fromm et al., 2006). Therefore, both causes might be operative here.
Positive lightning has already been observed in less vio-lent pyro-Cb in Canada. Jungwirth et al. (2005) wrote that strong relations were observed between burned areas and the frequency of positive lightning at the Mackenzie River Basin in northwest Canada. Kochtubjada et al. (2002) suggested
that positive lightning strokes were probably responsible for igniting the fires, because positive cloud to ground flashes are typically more energetic and their current persists longer than for negative flashes (Latham and Williams, 2001). Latham (1991) documented that a large prescribed fire in Canada caused a pyro-Cb that had produced exclusively 21 positive cloud to ground flashes, whereas other thunderclouds in the vicinity, which did not ingest smoke, produced tens of nor-mal negative flashes. A similar situation was reported in Florida. Quoting from the web site of the COMET outreach program that existed at that time: “It is worth noting that
negative flashes started approximately 85% of the lightning fires between 25 May and 4 July 1998; however the ratio of fires to flashes was higher for positive flashes across the state (238 flashes were within 800 m of 192 fire locations)”.
It might well be that the positive lightning induced by smoke ignited new fires that emitted even more smoke, thus driving a positive feedback loop.
7 8 9 10 11 12 13 14 15 20 25 30 35 40 45 50 55 1:10 1:30 1:50 2:10 2:30 2:50 3:10 Htop Control Htop Pyro Zmax Control Zmax Pyro H m a x [k m ] Z m a x [d B Z ] Time
Fig. 12. The radar tracked evolution of the pyro-Cb and the strongest non-pyro Cb nearby. The peak low level reflectivity (red) and echo top heights (blue) are shown for the pyro-Cb (solid lines) and for the strongest ambient Cb (broken lines). Note the much smaller reflectivity of the pyro-Cb despite its greater vertical devel-opment. Also note that the time for reaching maximum reflectivity of the pyro-Cb is 50 min after its appearance on the radar screen, whereas the reflectivity of the non-pyro Cb peaked already after 20 min. Both effects are indicative of suppressed precipitation pro-cesses in the pyro-Cb.
Vonnegut et al. (1995) reviewed several more similar re-ports, and concluded that the charge generation and sepa-ration mechanism in the cloud, rather than that connected to the fire, was responsible for the resulting anomalous behavior of the lightning. This conclusion was reinforced by Latham (1999), but no specific mechanism was identified. Jungwirth et al. (2005) proposed a mechanism that connects the chemi-cal composition of the smoke to the positive charging.
An alternate and newer explanation for the role of aerosols in charge reversal can be related to their impact of suppress-ing the precipitation in the cloud, leavsuppress-ing greater amount of supercooled cloud water at greater heights and lower temper-ature (Rosenfeld, 1999, 2000; Williams et al., 2002; Andreae et al., 2004). It has been shown in laboratory studies that the charging of the ice hydrometeors becomes positive un-der such conditions, i.e., when large amounts of supercooled cloud water, in excess of 2 g m−3, are present (Takahasi and Miyawaki, 2002). Therefore, the smoke might lead to posi-tive charging (Jungwirth et al., 2005).
6 Discussion
According to the T-reanalysis, the Chisholm pyro-Cb had an
extreme microphysically-continental microstructure, where small cloud droplets reach the homogeneous freezing level
and produce very small ice particles that form the anvil. We suggest that such a cloud would be very inefficient at ducing precipitation, because of the lack of warm rain pro-cesses and the very slow riming of ice crystals that nucleate in the updrafts. This suggestion is consistent with the model simulations of Leroy et al. (2006), who showed that adding large concentrations of CCN to a microphysically continen-tal cloud suppresses the formation of both water and ice hy-drometeors by such mechanisms. The occurrence of positive lightning in the pyro-Cb is an additional indication of the abundance of highly supercooled water in a vigorous cloud (Lang and Rutledge, 2006). The few large hydrometeors that form can grow to large graupel or hail and thereby create large radar reflectivities, owing to the dominant effect of the size of the hydrometeors on the strength of the reflectivity, without correspondingly high rain intensity. Large ash, char, and debris fragments may also contribute to the observed radar signals.
Fortunately, a rain gauge (Marten Hills) with hourly mea-surements was located just under the most reflective and tallest part of the pyro-Cb. The location of that rain gauge is shown as the white circle in the radar images in Fig. 3. The rain gauge showed no precipitation before 01:00 UTC. It recorded only 0.5 mm between 00:00 and 01:00 UT, and an additional 8.1 mm under the explosive pyro-Cb between 01:00 and 02:00. The rain gauge was located at the downs-hear side of the pyro-Cb, which coincided fortuitously with the area of the most intense low level radar echoes. This is a notably small amount of precipitation from such an intense storm. The pyro-Cb had much smaller low-level reflectivi-ties than the ambient non pyro-Cbs, despite of having taller echo tops (see Fig. 11). These observations demonstrate the strong suppression of precipitation in the pyro-Cb compared to a neighboring Cb that formed without interactions with the fire and smoke. The main cloud band of the cold front might have ingested smoke when passing over the site, but if this occurred, it was when these clouds were already pre-cipitating, and the smoke could not have stopped precipi-tation that was already underway. Furthermore, this smoke could have been scavenged by the rain. In contrast, the lack of significant precipitation in the pyro-Cb means that only a small fraction of the smoke was scavenged, so that most of it was exhausted through the anvil to the upper troposphere and lower stratosphere. This is in agreement with previous measurements (Radke et al., 2001) showing that most of the smoke was scavenged only from precipitating clouds.
The microphysical inferences presented here are in good agreement with the results of Luderer et al. (2006), who used a cloud resolving model with a two-moment bulk micro-physical scheme for a numerical simulation of the Chisholm pyro-convection. According to their study, cloud droplets re-main very small with droplet mean radii smaller than 10 µm within the updraft region. Freezing is efficiently suppressed up to the level of homogeneous freezing. As a result of the very large updraft velocities leaving insufficient time for
AVHRR 0.65 μm AVHRR 10.8 μm
Echo Tops > 40 dBZ Echo Tops > 30 dBZ
Echo Tops > 20 dBZ Echo Tops > 8 dBZ
A
B
C
D
E
F
km km
km km
Fig. 13. The relations between radar and cloud features of the phase-2 Pyro-Cb at 02:20 UTC. The AVHRR visible (A) and thermal IR (B) images are mapped on the same geographical grid as the radar echo top maps at thresholds of 40, 30, 20 and 8 dBZ (C–F). The red circles mark the areas of the most intense radar echoes >40 dBZ, shown in (C). Note that this area of strongest reflectivities is downwind of the upshear edge of the overshooting tower.
precipitation formation and the large droplet number concen-trations at cloud base, the development of precipitation-sized hydrometeors is delayed until some 30 km downwind of the fire. A model sensitivity study suggests that in the case of the Chisholm fire the high updraft velocity was mainly re-sponsible for the delayed development of precipitation. The simulated maximum penetration height of 12.1 km is slightly less than the cloud top height derived from the analysis of
satellite and radar data (Sect. 3), suggesting that the intensity of small scale overshooting tops was underestimated in the model.
Inspection of satellite analyses of the T-re relations of
all the other extra-tropical pyro-Cbs for which satellite data were available (for example, those shown in Fig. 8, which likely contributed to the stratospheric smoke docu-mented by Jost et al., 2004) provided very similar retrieved
53 53.5 54 54.5 55 55.5 56 56.5 57 -117 -116.5 -116 -115.5 -115 -114.5 -114 -113.5 -113 < -50 KA -50 - -25 KA -25 - 0 KA 0-25 KA 25-50 KA 50-100 KA >100 KA L a ti tu d e Longitude
Lightning Strenth and Polarity Chisholm Pyro-Cb, 23:00-03:00 UT
Fig. 14. The lightning strength [kiloAmpere] and polarity in the area that includes the pyro-Cb during the peak hours of the firestorm, 28 May 23:00–29 May 03:00 UTC. The lightning strokes with normal polarity (negative) are shown in blue, and the positive lightning strokes are shown in red, except for black squares that represent the strongest positive flashes. The Pyro-Cb can be clearly seen as the red aggregate of positive lightning.
microphysical profiles. This includes the case of the Can-berra firestorm, for which a similar T-re was published
(Fromm et al., 2006). Other cases that were looked at oc-curred in Siberia, the USA, and Canada.
Comparisons with these other cases suggest that a pyro-Cb does not have to be as violent as the Chisholm storm for pre-cipitation to be strongly suppressed (see Fig. 8). However, such convective vigor is necessary to create a strong over-shooting updraft that injects the smoke into the lower strato-sphere. The deep overshooting features on the top of the explosive Chisholm pyro-Cb are not as common with other pyro-Cb. These features are more characteristic of extreme severe storms, such as those that produce large hail and tor-nados (Setvak et al., 2003). This supports the suggestion that a combination of severe contamination of the cloud with a violent updraft is a recipe to inject large amounts of that con-tamination, whether being smoke or volcanic ash, into the stratosphere.
Acknowledgements. We thank B. Kochtubajda, E. Lapalme and
M. Tremblay of the Meteorological Service of Canada for the lightning data, radar data and images. This research was partially supported in part by the Max Planck Society of Germany, by the
Alexander von Humboldt-foundation (through a Feodor Lynen fellowship for J. Trentmann), and by the Helmholtz Association (Virtual Institute COSI-TRACKS). We also acknowledge the support of the European Community- New and emerging science and technologies (contract No.12444(NEST) – ANTISTORM). Edited by: A. Stohl
References
Andreae, M. O., Rosenfeld, D., Artaxo, P., Costa, A. A., Frank, G. P., Longo, K. M., and Silva-Dias, M. A. F.: Smoking rain clouds over the Amazon, Science, 303, 1337–1342, 2004.
ASRD: Final Documentation Report – Chisholm Fire (LWF-063), Forest Protection Division, ISBN 0-7785-1841-8, Tech. rep., Al-berta Sustainable Resource Development, 53 p., 2001.
Burrows, W. R., King, P., Lewis, P. J., Kochubajda, B., Snyder, B., and Turcotte, V.: Lightning Occurrence Patterns over Canada and Adjacent United States from Lightning Detection Network Observations, Atmosphere-Ocean, 40, 59–81, 2002.
Carey, L. D., Petersen, W. A., and Rutledge, S. A.: Evolution of cloud-to-ground lightning and storm structure in the Spencer, South Dakota, tornadic supercell of 30 May 1998, Mon. Wea. Rev., 131, 1811–1831, 2003a.
Carey, L. D., Rutledge, S. A., and Petersen, W. A.: The relationship between severe storm reports and cloud-to-ground lightning po-larity in the contiguous United States from 1989 to 1998, Mon. Wea. Rev., 131, 1211–1228, 2003b.
Diner, D. J., Beckert, J. C., Reilly, T. H., Bruegge, C. J., Conel, J. E., Kahn, R., Martonchik, J. V., Ackerman, T. P., Davies, R., Gerstl, S. A. W., Gordon, H. R., Muller, J.-P., Myneni, R. B., Sellers, R. J., Pinty, B., and Verstraete, M. M.: Multiangle Imaging Spectro-Radiometer (MISR) description and experiment overview, IEEE Trans. Geosc. Rem. Sens., 36, 1072–1087, 1988.
Fromm, M., Bevilacqua, R., Servranckx, R., Rosen, J., Thayer, J. P., Herman, J., and Larko, D.: Pyro-cumulonimbus injection of smoke to the stratosphere: Observations and impact of a super blowup in northwestern Canada on 3–4 August 1998, J. Geo-phys. Res., 110, D08205, doi:10.1029/2004JD005350, 2005. Fromm, M., Tupper, A., Rosenfeld, D., Servranckx, R., and McRae,
R., Violent pyro-convective storm devastates Australia’s capital and pollutes the stratosphere: Geophys. Res. Lett., 33, L05815, doi:10.1029/2005GL025161, 2006.
Fromm, M. D. and Servranckx, R.: Transport of forest fire smoke above the tropopause by supercell convection, Geophys. Res. Lett., 30, 1542, doi:10.1029/2002GL016820, 2003.
Hallett, J., Hudson, J. G., and Rogers, C. F.: Characterization of combustion aerosols for haze and cloud formation, Aerosol Sci. Technol., 10, 70–83, 1989.
Inoue, T.: A cloud type classification with NOAA 7 split-window measurements, J. Geophys. Res., 92, 3991–4000, 1987. Jost, H.-J., Drdla, K., Stohl, A., et al.: In-situ observations of
mid-latitude forest fire plumes deep in the stratosphere, Geophys. Res. Lett., 31, L11101, doi:10.1029/2003GL019253, 2004.
Jungwirth, P., Rosenfeld, D., and Buch, V.: A possible new molecu-lar mechanism of thundercloud Electrification, Atmos. Res., 76, 190–205, 2005.
Kaufman, Y. J. and Fraser, R. S.: The Effect of Smoke Particles on Clouds and Climate Forcing, Science, 277, 1636–1639, 1977.
D.: Summer convection and lightning over the Mackenzie River basin and their impacts during 1994 and 1995, Atmosphere-Ocean, 40, 199–220, 2002.
Lang, T. J. and Rutledge, S. A.: Cloud-to-ground lightning down-wind of the 2002 Hayman forest fire in Colorado, Geophys. Res. Lett., 33, L03804, doi:10.1029/2005GL024608, 2006.
Latham, D. J.: Lightning flashes from a prescribed fire influenced cloud, J. Geophys. Res., 96, 17 151–17 157, 1991.
Latham, D. J.: Space charge generated by wind tunnel fires, Atmos. Res., 51, 267–278, 1999.
Latham, D. and Williams, E. R.: Lightning and Forest Fires, in: For-est Fires – Behavior and Ecological Effects, edited by: Johnson, E. A. and Miyanashi, K., Academic Press, New York, 2001. Lavou´e, D., Liousse, C., Cachier, H., Stocks, B. J., and Goldammer,
J. G.: Modeling of carbonaceous particles emitted by boreal and temperature wildfires at northern latitudes, J. Geophys. Res., 105, 26 871–26 890, doi:10.1029/2000JD900180.
Leroy, D., Monier, M., Wobrock, W., and Flossmann, A. I.: A nu-merical study of the effects of the aerosol particle spectrum on the development of the ice phase and precipitation formation, At-mos. Res., 80, 15–45, 2006.
Luderer, G., Trentmann, J., Winterrath, T., Textor, C., Herzog, M., Graf, H.-F., and Andreae, M. O.: Modeling of biomass smoke injection into the lower stratosphere by a large forest fire (part II): Sensitivity studies, Atmos. Chem. Phys., 6, 5261–5277, 2006, http://www.atmos-chem-phys.net/6/5261/2006/.
Orville, R. E., Huffines, G. R., Burrows, W. R., Holle, R. L., and Cummins, K. L.: The North American Lightning Detection Net-work (NALDN) – First Results: 1998–2000, Mon. Wea. Rev., 130, 2098–2109, 2002.
Radke, L. F., Ward, D. E., and Riggan, P. J.: A prescription for controlling the air pollution resulting from the use of prescribed biomass fire: clouds, Int. J. Wildland Fire, 10, 103–111, 2001. Rogers, C. F., Hudson, J. G., Zielinska, B., Tanner, R. L., Hallett,
J., and Watson, J. G.: Cloud condensation nuclei from biomass burning, in: Global Biomass Burning: Atmospheric, Climatic and Biospheric Implications, edited by: Levine, J. S., pp. 431– 438, MIT Press, Cambridge, Mass., 1991.
Rosenfeld, D.: TRMM observed first direct evidence of smoke from forest fires inhibiting rainfall, Geophys. Res. Lett., 26, 3105– 3108, 1999.
Rosenfeld, D.: Suppression of rain and snow by urban and industrial air pollution, Science, 287, 1793–1796, 2000.
near the tops of potential rain clouds by multispectral analysis of AVHRR data, Atmos. Res., 34, 259–283, 1994.
Rosenfeld, D. and Lensky, I. M.: Satellite-based insights into pre-cipitation formation processes in continental and maritime con-vective clouds, Bull. Am. Meteorol. Soc., 79, 2457–2476, 1998. Rosenfeld, D. and Woodley, W. L.: Deep convective clouds with sustained supercooled liquid water down to −37.5◦C, Nature, 405, 440–442, 2000.
Rosenfeld, D. and Woodley, W. L.: Closing the 50-year circle: From cloud seeding to space and back to climate change through precipitation physics, in: Cloud Systems, Hurricanes, and the Tropical Rainfall Measuring Mission (TRMM), edited by: Tao, W.-K. and Adler, R., pp. 59–80, AMS, 2003.
Rosenfeld, D., Woodley, W. L., Krauss, T. W., and Makitov, V.: The Structure of Severe Convective Storms in Mendoza, Argentina, J. Appl. Meteorol. Climatol., 45, 1261–1281, 2006.
Setvak, M., Rabin, R. M., Doswell, C. A., and Levizzani, V.: Satel-lite observations of convective storm tops in the 1.6, 3.7 and 3.9 µm spectral bands, Atmos. Res., 67-8, 607–627, 2003. Takahasi, T. M. and Miyawaki, K.: Reexamination of riming
elec-trification in a wind tunnel, J. Atmos. Sci., 59, 1018–1025, 2002. Trentmann, J., Luderer, G., Winterrath, T., Fromm, M., Servranckx, R., Textor, C., Herzog, M., Graf, H.-F., and Andreae, M. O.: Modeling of biomass smoke injection into the lower stratosphere by a large forest fire (part I): Reference simulation, Atmos. Chem. Phys., 6, 5247–5260, 2006,
http://www.atmos-chem-phys.net/6/5247/2006/.
Vonnegut, B., Latham, D. J., Moore, C. B., and Hunyady, S. J.: An explanation for anomalous lightning from forest fire clouds, J. Geophys. Res., 100, 5037–5050, 1995.
Warner, J. and Twomey, S.: The production of cloud nuclei by cane fires and the effect on cloud drop concentrations, J. Atmos. Sci., 24, 704–706, 1967.
Williams, E., Mushtak, V., Rosenfeld, D., Goodman, S., and Boc-cippio, D.: Thermodynamic conditions favorable to superlative thunderstorm updraft, mixed phase microphysics and lightning flash rate, Atmos. Res., 76, 288–306, 2005.
Williams, E., Rosenfeld, D., Madden, N., et al.: Con-trasting convective regimes over the Amazon: Implica-tions for cloud electrification, J. Geophys. Res., 107, 8082, doi:10.1029/2001JD000380, 2002.