HAL Id: tel-02944689
https://tel.archives-ouvertes.fr/tel-02944689
Submitted on 21 Sep 2020
HAL is a multi-disciplinary open access archive for the deposit and dissemination of sci-entific research documents, whether they are pub-lished or not. The documents may come from teaching and research institutions in France or abroad, or from public or private research centers.
L’archive ouverte pluridisciplinaire HAL, est destinée au dépôt et à la diffusion de documents scientifiques de niveau recherche, publiés ou non, émanant des établissements d’enseignement et de recherche français ou étrangers, des laboratoires publics ou privés.
2D/3D lensless imaging : prototype and applications
Ramona Corman
To cite this version:
Ramona Corman. 2D/3D lensless imaging : prototype and applications. Optics [physics.optics]. Université Paris-Saclay, 2020. English. �NNT : 2020UPASS042�. �tel-02944689�
2D/3D lensless imaging:
Prototype and applications
Thèse de doctorat de l'université Paris-Saclay
École doctorale n° 572 Ondes et Matière (EDOM)
Spécialité de doctorat: optique et photoniqueUnité de recherche : Université Paris-Saclay, CEA, CNRS, LIDYL, 91191, Gif-sur-Yvette, France. Référent : Faculté des Sciences d’Orsay
Thèse présentée et soutenue à Gif-sur-Yvette,
le 13 Mars 2020, par
Ramona CORMAN
Composition du Jury
Thomas GUSTAVSSON
Directeur de recherche, Université Paris-Saclay, CNRS Président
Olivier HAEBERLE
Professeur, Université de Haute-Alsace Rapporteur & Examinateur
Mona MIHAILESCU
Professeure, Politehnica University of Bucharest Rapporteur & Examinatrice
Mathieu DUCOUSSO
Ingénieur de recherche, Safran - Paris Examinateur
Oana NEDELCU
Ingénieure de recherche, IMT- Bucharest Examinatrice
Willem BOUTU
Ingénieur de recherche, Université Paris-Saclay, CEA Directeur de thèse
Guillaume DOVILLAIRE
Ingénieur de recherche, Imagine Optic - Orsay Invité
de
do
cto
ra
t
UP AS S0 42“The woman who follows the crowd will usually go no further than the
crowd. The woman who walks alone is likely to find herself in places no one
has ever been before.”
― Albert Einstein
Dedication
This dissertation is dedicated to the memory of my grandfather. He was my
inspiration to achieve a doctorate degree. This work is also dedicated to my
parents who always believed in my ambitions and thought me to work hard
for the things that I aspire to achieve. A special feeling of gratitude to my
soulmate. He has been a constant source of support and encouragement
during the challenges of PhD graduation and life.
Abstract
Biological imaging has made tremendous progresses these last decades. The latest developments concern manipulating and imaging single cells with nanometre spatial resolutions. A recent category of imaging techniques, called lensless microscopy, is very promising because they combine very good spatial resolutions in a large field-of-view, with simplicity of use and low cost, while operating on label free samples. In this thesis, two different lensless approaches are considered: digital in-line holography (DILH) and Fourier transform holography (FTH). In lensless imaging, the usual optical systems used to form the sample’s image are removed and replaced by numerical algorithms using the light spatial coherence properties.
Two imaging prototypes, built on these principles, are presented. They offer (sub-) micrometer scale resolutions, and offer the possibility to retrieve both spatial amplitude and phase information of the optical field. This allows for achieving pseudo-3D reconstructions of volumetric objects from a single 2D hologram. Both devices were first characterized with reference samples. In a second step, real applications, relevant to selected biological problems, were performed to assess the device’s performances towards high resolution, real time imaging and 3D.
This thesis objective is also to develop a new platform directly integrating in a single chip a microfluidics system for biological cell handling by dielectrophoresis and an optical mask for cell visualization by lensless microscopy. Its working principle is based on cell transport in a liquid media by microfluidics, cell separation in the microscope field of view by the electric field induced by specific electrodes, and simultaneous cell imaging by Fourier Transform Holography. The main advantage of such coupled electro-optical system for cell imaging and analysis are the improved control, the precision and sensitivity regarding cell morphology all together merged in a compact imaging platform. The capability of the platform can be extended to analysis of cells’ behaviour and morphologic deviation during the electrochemical processes of DEP.
A major challenge in microscopy field is to reduce the production costs. The two types of lensless microscopy presented in this thesis aims to introduce new imaging tools that allows scientists to obtain low-cost high-resolution images in label-free conditions. Additionally, the microfluidics chip is a first demonstration of a new integrated platform for cell live analysis into a single Lab-on-a-chip device.
Résumé
L’imagerie biologique a réalisé des progrès significatifs durant les dernières décennies. Les récentes innovations portent sur la manipulation et la visualisation de cellules uniques avec une résolution spatiale de l’ordre du nanomètre. Une technologie d’imagerie récente, l’imagerie «sans lentille », est particulièrement prometteuse car elle combine une bonne résolution spatiale, un champ de vision étendu, une simplicité d’utilisation, un coût abordable et la possibilité de travailler sur des échantillons exempts de marqueurs spécifiques. En imagerie sans lentille, le système optique classiquement utilisé pour constituer l’image de l’échantillon est remplacé par des algorithmes informatiques qui s’appuient sur les propriétés de cohérence spatiale de la lumière. Dans cette thèse, deux approches différentes de microscopie sans lentille sont considérées : l’holographie numérique en ligne et l’holographie par transformée de Fourier.
Deux prototypes d’imagerie, construits selon ces principes, sont présentés. Ils offrent une résolution de l’ordre du micron, ainsi que la possibilité de retrouver les informations relatives à l’amplitude spatiale et à la phase du champ optique. Cela permet la réalisation de reconstructions pseudo-3D d’objets volumétriques à partir d’un unique hologramme. Les deux dispositifs ont d’abord été caractérisés avec des échantillons de référence. Par la suite, des expériences d’applications ont été testées pour estimer la capacité des dispositifs à répondre à des problématiques concrètes dans le domaine de la biologie, grâce à la haute résolution, l’imagerie en temps réel et la reconstruction 3D. L’objectif de cette thèse est également de développer une nouvelle plateforme qui intègre, dans une puce microfluidique, d’une part un système permettant la manipulation de cellules par diélectrophorèse, et d’autre part un masque optique pour la visualisation des cellules par imagerie sans lentille. Le principe de fonctionnement est basé sur le déplacement des cellules en milieu liquide et la séparation des cellules dans le champ de vision du microscope en utilisant un champ électrique induit par des électrodes spécifiques. Le masque optique permet de définir le champ de vision du microscope et de créer les faisceaux de référence nécessaires pour l’imagerie par holographie par transformée de Fourier. Le principal avantage de ce système électro-optique pour l’imagerie cellulaire réside dans sa capacité à fournir une plateforme d’imagerie compacte qui regroupe précision et sensibilité. Les champs d’applications de cette plateforme sont variés. Une application concrète qui découle immédiatement des premières expériences présentées dans ce manuscrit serait l’analyse du comportement des cellules et de leurs modifications morphologiques lors d’un processus électrochimique de diélectrophorèse.
L’un des challenges majeurs dans le domaine de la microscopie est de réduire les coûts de fabrication. Les deux types de microscopes sans lentille présentés dans cette thèse visent à introduire dans le monde scientifique des outils d’imagerie permettant d’obtenir une haute résolution à un faible coût et sans marquage. Par ailleurs, la puce microfluidique est une première démonstration de plateforme intégrée pour l’analyse des cellules en temps réel dans un dispositif de type «
Lab-on-a-Author Contributions
Digital in-line holography for bio-applications
The acquisition and image reconstruction codes were taken over the previous PhD’s work and upgraded with the twin image correction algorithm by Joana Duarte (she summarized in her PhD manuscript the code). The demand of live experimental acquisition needs a user-friendly GUI interface that was developed with the help of W. Boutu. I adapted the setup for each experiments. I performed all the experiments and data analysis having in mind the biological requirements, using the in-line configuration (helpful discussions with H. Merdji, W. Boutu). The biological samples used were provided by several collaborators (see below). I proposed the collaboration with Fernando Muzzoppapa from CEA/I2BC for cyanobacteria motility analysis, topic that later drew Prof. Franck Chauvat’s interest after a project review at CEA where H. Merdji presented the results of my research. I build the setup necessary for the motility study with the help of H. Merdji.
I followed the sample protocol and prepared the samples in the following experiments: zebrafish embryos, cyanobacteria and some of U2OS cells (most of the samples received were already fixed in medium and there was no need of preparation).
A novel FTH microfluidic microscope for applications in biology
The concept of integrating FTH imaging with microfluidics came up as an answer of DILH limitations plus a strong background in microfluidics accumulated during my previous career. I proposed the collaboration with IMT Bucharest, with Oana Nedelcu who was in charge with the development of the device. The design for the chip was the result of numerous discussions with H. Merdji and W. Boutu for the optical part and O. Nedelcu for the microfluidics and electronics parts, while the final electrodes dimensioning resulted from simulations performed by IMT Bucharest. The fabrication was realized by IMT Bucharest. I modified the setup (helpful discussions with H. Merdji, W. Boutu) and adapted the in-line holography GUI to FTH with the help of W. Boutu. I performed the experiments assisted by O. Nedelcu. I analysed the data and I used a post-processing MATLAB code develop by Julien Samaan.
Together with H. Merdji, I summed up the whole idea in a proposal that was accepted in July 2019 (DIM ELICIT Ile-de-France IMAChip).
Author Contributions
Collaboration with biological Institutes
Cell culture of U2OS and HeLa
Pablo Radicella and Anna Campalans, Laboratoire de Recherche sur l’Instabilité du Génome (LRIG)
and Light Microscopy Platform, Institute of Molecular and Cellular Radiobiology Zebrafish embryos
Prof. Laure Bally-Cuif and Nicolas Dray, Institut Pasteur Dept. Developmental and Stem Cell
Biology
Cyanobacteria
Fernando Muzzoppapa,Institut de Biologie Intégrative de la Cellule (I2BC)
Prof. Franck Chauvat, Laboratory Biology & Biotechnology of Cyanobacteria (LBBC)
List of Figures
Table of Contents
DEDICATION ... III ABSTRACT ... V RESUME ... VII AUTHOR CONTRIBUTIONS ...IX
LIST OF FIGURES ... 6
LIST OF TABLES ... 12
MOTIVATION ... 14
1. INTRODUCTION ... 16
1.1. REVIEW OF ESTABLISHED MICROSCOPY TECHNIQUES ... 16
1.1.1 Florescent microscopy ... 17
1.1.2. Wide field microscopy ... 18
1.1.3. Confocal microscopy ... 19
1.1.4 Superresolution microscopy ... 21
1.2. XRAY IMAGING ... 22
1.2.1 Coherent diffractive imaging (CDI) ... 23
1.2.2. Xray Holography ... 27
1.3. LENSLESS IMAGING IN VISIBLE DOMAIN ... 28
1.4. CONCLUSION... 30
2. DIGITAL INLINE HOLOGRAPHY: PRINCIPLES AND SETUP ... 33
2.1 DIGITAL HOLOGRAPHY (DH) ... 33
2.1.1 Configurations ... 34
2.1.2 Digital Inline Holography, general concept ... 35
2.1.3 DH solutions in the industry ... 36
2.2 PRINCIPLE AND THEORY ... 36
2.2.1 Experimental setup ... 36
2.2.2 Backpropagation and reconstruction ... 38
2.2.3 Resolution and depth of field ... 40
2.3 ALGORITHMS ... 41
2.4 DEVELOPMENT OF THE MICROSCOPE PROTOTYPE ... 44
2.4.1 Presentation of the prototype ... 44
2.4.2 Calibration of the spatial resolution ... 45
2.5. CONCLUSION... 53
3. BIOMEDICAL APPLICATIONS ... 55
3.1. IMAGING OF ZEBRAFISH EMBRYOS... 55
3.1.1. Sample preparation protocol ... 56
3.1.2. Zebrafish embryo imaging – configuration 1 ... 56
3.1.3. Zebrafish embryo imaging – configuration 2 ... 57
3.2. LABELFREE CANCER CELL IMAGING (U2OS CELL) ... 58
3.2.1. Cell culture protocol... 60
3.2.2. Image acquisition and processing: high NA using lens ... 60
3.2.3. Image acquisition and processing: high NA using pinhole ... 62
3.3. INVIVO ANALYSIS OF CYANOBACTERIA MOTILITY (SYNECHOCYSTIS PCC 6803) ... 65
3.3.1. Sample preparation ... 66
-List of Figures
3.3.3. Synechocystis motility fixed in gelatine ... 69
3.4. EXTENSION DIH TO 3D VIEW ... 70
3.4.1. Theoretical aspects ... 71
3.4.2. Calibration and results using a 3D calibration sample ... 73
3.4.3. 3D reconstruction of a biosample ... 77
3.5. CONCLUSION ... 80
4. A NOVEL FTH MICROFLUIDIC MICROSCOPE AND APPLICATIONS IN BIOLOGY ... 83
-4.1.FOURIER TRANSFORM HOLOGRAPHY PRINCIPLES AND THEORY ...-83
4.1.1 General principle ... 83
4.1.2 Principle of image reconstruction ... 85
4.1.3 Resolution ... 86
-4.2.MICROFLUIDICS HOLOGRAPHIC CONFIGURATION ...-87
4.2.1 Cell handling in a nonuniform field: DEP and EP effects ... 88
4.2.2. Microfluidics in the context of FTH imaging ... 92
4.3 DESIGN AND FABRICATION OF MICROFLUIDIC CHIPS FOR LENSLESS MICROSCOPY ... 92
4.3.1 Pupil and nanoholes constrains ... 93
4.3.2 Design and simulation of the microfluidic part ... 94
4.3.3 Electrodes Design ... 95
4.3.4 Microfabrication procedure and assembly ... 100
4.4. FOURIER TRANSFORM HOLOGRAPHY CALIBRATION AND TESTS ... 102
4.4.1 Image reconstruction ... 104
4.4.2 Resolution ... 105
4.5. INTEGRATION AND TESTING THE ELECTROOPTOFLUIDIC PLATFORM ... 106
4.5.1. Preparation protocol ... 107 4.5.2. DEP experiment ... 108 4.5.3. Microfluidic FTH imaging ... 112 4.6. CONCLUSIONS ... 115 5. CONCLUSIONS ... 119 ANNEX A ... 123 A.1.1 INTERFERENCE ... 124 A.1.2 COHERENCE ... 125 A.1.3 DIFFRACTION ... 126 ANNEX B ... 129 ANNEX C ... 131 ANNEX D ... 135 ANNEX E ... 137 ANNEX F ... 139 ANNEX G ... 143 ARTICLES ... 145 BIBLIOGRAPHY ... 147
-List of Figures
List of Figures
FIG.1. 1. JELLY FISH AEQUOREA VICTORIA AND THE GFP PROTEIN, ADAPTED FROM NOBLE PRIZE IN CHEMISTRY
2008. ... 17
-FIG.1. 2. ILLUSTRATION OF THE RESOLUTION RAYLEIGH CRITERION IN FLUORESCENCE MICROSCOPY ADAPTED FROM CHRISTOPH CREMER AND BARRY R. MASTERS. ... - 18
-FIG.1. 3. (A) WIDE-FIELD EXCITES A COLUMN OF THE SAMPLE SECTION, WHICH CAUSES EMISSION FLUORESCENCE FROM BOTH INSIDE AND OUTSIDE THE FOCAL PLANE. OUT-OF-FOCUS FLUORESCENCE CONTRIBUTES TO DETAIL OBSCURITY, LIMITING THE DEPTH OF TISSUE THAT CAN BE IMAGED. (B) IN CONFOCAL MICROSCOPY, A PINHOLE PLACED JUST PROXIMALLY TO THE DETECTOR BLOCKS ALL OUT-OF-FOCUS LIGHT, ALLOWING FOR IN-OUT-OF-FOCUS FLUORESCENCE TO BE COLLECTED FROM THE SAMPLE AND DRAMATICALLY IMPROVES VISUAL DETAIL. ADAPTED FROM KIM ET AL. ... 19
-FIG.1. 4. IMAGES OF 15µM THICK MOUSE TISSUE REALIZED WITH 63X/1.4NA OIL OBJECTIVE IN BOTH A) WIDE FIELD AND B) A LASER SCANNING CONFOCAL MICROSCOPE. ... 20
FIG.1. 5. STIMULATED EMISSION DEPLETION (STED) ADAPTED FROM L. SCHERMELLEH ET AL, JCB. ... 21
FIG.1. 6. COMPARISON BETWEEN CONFOCAL RESOLUTION AND STED. ... 22
FIG.1. 7. SCHEMATIC PRINCIPLE OF CDI PRINCIPLE, REPRODUCED FROM. ... 24
FIG.1. 8. EXAMPLE OF EXPERIMENTAL SETUP OF PTYCHOGRAPHY. ... 24
-FIG.1. 9. COHERENT DIFFRACTIVE IMAGING (CDI) EXAMPLE OF WHOLE ESCHERICHIA COLI BACTERIA: A) DIFFRACTION PATTERN OF PLANE-WAVE CDI; B) CORRESPONDING IMAGE RECONSTRUCTION, REPRODUCED FROM SCHERMELLEH, AND PTYCHO-TOMOGRAPHYGRAPHY (C) 3D RENDERING OF MEASURED FROZENHYDRATED CHLAMYDOMONASCELLS CONFINED IN A GLASS MICROCAPILLARY, REPRODUCE FROM. ... 25
-FIG.1. 10. ILLUSTRATION OF THE PRINCIPLE OF COHERENT DIFFRACTIVE IMAGING (CDI) WITH SINGLE SHOT DATA FROM THE CEA HHG SOURCE. A COHERENT BEAM IS ILLUMINATING AN ISOLATED SAMPLE. A CCD DETECTOR RECORDS THE FAR FIELD DIFFRACTION PATTERN. AN ALGORITHM IS THEN USED TO RECONSTRUCT THE IMAGE OF THE SAMPLE, HERE WITH SUB-100 NM SPATIAL RESOLUTION27. ... 26
-FIG.1. 11. 3D DENSITY OF D. RADIODURANS. (A) DIRECT VOLUME RENDERING OF THE 3D EFFECTIVE MASS DENSITY OF FREEZE-DRIED D. RADIODURANS CELLS. (B) THE CELLS ARE SHOWN FROM ABOVE AND TURNED UPSIDEDOWN. (C) COMBINED DIRECT VOLUME RENDERING AND SURFACE RENDERING. ... 27
-FIG.1. 12. LENSLESS IMAGING SET-UPS. (A) GENERAL LENSLESS IMAGING EXPERIMENTAL SETUP BASED ON IN LINE-HOLOGRAPHY (B) EXAMPLE OF A LARGE FIELD OF VIEW (FOV) AND A RESOLUTION COMPARABLE TO THAT OF HIGH-MAGNIFICATION OBJECTIVE LENSES. (C) LENSLESS IMAGING IMPLEMENTED IN A COMPACT DEVICE (D) LENSLESS IMAGING INCORPORATED INTO A CAMERA PHONE HANDSET. MODIFIED FROM REFERENCE38. ... 29
-FIG.1. 13. LIVE CELL HOLOGRAPHIC TOMOGRAPHY-BASED ILLUSTRATION OF LIPID DROPLETS IN A) NONINFECTED AND B) B. BESNOITINONINFECTED BUVEC. ADAPTED FROM REFERENCE. ... 30
-FIG. 2. 1. THE HOLOGRAPHIC PRINCIPLE OF GABOR’S IN NATURE47. ... 34
-FIG. 2. 2. DIGITAL HOLOGRAPHIC MICROSCOPY: IN-LINE AND OFF-AXIS CONFIGURATION. THE SAMPLE IS REPRESENTED AS A YELLOW SPHERE. ... 34
-FIG. 2. 3. SCHEMA OF DIGITAL IN-LINE HOLOGRAPHY. 1 REPRESENTS THE ILLUMINATION SOURCE, 2 THE PINHOLE OR ASPHERICAL LENS TO INCREASE OF THE NUMERICAL APERTURE AND THE SPATIAL RESOLUTION, 3 THE SAMPLE THAT CAN BE MOVE USING NANOMETRIC STAGES AND 4 THE IMAGE SENSOR. ... 37
-List of Figures
FIG. 2. 4. GUI INTERFACE PLATFORM (LABVIEW): THE INTERFACE PERMITS TO CONTROL (LIVE) THE SAMPLE POSITION (1); THE BACK-PROPAGATION FUNCTION TOOLS OR FOCUSES OF THE SAMPLE (2); BOTH AMPLITUDE (3) AND PHASE (4) CAN BE RECONSTRUCTED; THE IMAGES CAN BE SAVE FOR POST-PROCESSING USING THE PANEL IN (5). ... 38 -FIG. 2. 5. BLOCK DIAGRAM OF THE RECONSTRUCTION ALGORITHM FOR IN-LINE HOLOGRAPHY (ADAPTED FROM
SAMAAN). ... 43
FIG. 2. 6. PICTURE OF THE LENSLESS MICROSCOPE PROTOTYPE. ... 45 FIG. 2. 7. OPTICAL IMAGE WITH THE RULER. ... 46 -FIG. 2. 8. HOLOGRAM AND AMPLITUDE RECONSTRUCTION OF THE OPTICAL RULER IN THE CASE OF
MAGNIFICATION M1.THE RECONSTRUCTION WITH TWIN IMAGE CORRECTION WAS OBTAINED AFTER N =30 ITERATIONS. ... 47 -FIG. 2. 9. PLOT PROFILE FOR THE RED LINE IN B WHICH REPRESENTS THE AMPLITUDE RECONSTRUCTION, AFTER
TWIN IMAGE CORRECTION, IN THE CASE M1 WITH Λ1 = 405 NM AND PIXEL SIZE ΔPIXEL= 0.5 µM. ... 48 -FIG. 2. 10. PLOT PROFILE FOR THE RED LINE IN B WHICH REPRESENTS THE AMPLITUDE RECONSTRUCTION, AFTER
TWIN IMAGE CORRECTION, IN THE CASE M1 WITH Λ2 = 637 NM AND PIXEL SIZE ΔPIXEL= 0.7 µM. ... 48 -FIG. 2. 11. HOLOGRAM AND AMPLITUDE RECONSTRUCTION OF THE OPTICAL RULER IN THE CASE OF
MAGNIFICATION M2. THE RECONSTRUCTION WITH TWIN IMAGE CORRECTION WAS OBTAINED AFTER N = 30 ITERATIONS. ... 49 -FIG. 2. 12. PLOT PROFILE FOR THE RED LINE IN B WHICH REPRESENTS THE AMPLITUDE RECONSTRUCTION, AFTER
TWIN IMAGE CORRECTION, IN THE CASE M2 WITH Λ1= 405 NM AND PIXEL SIZE ΔPIXEL= 0.48 µM. ... 49 -FIG. 2. 13. PLOT PROFILE FOR THE RED LINE IN B WHICH REPRESENTS THE AMPLITUDE RECONSTRUCTION, AFTER
TWIN IMAGE CORRECTION, IN THE CASE M2 WITH Λ2 = 637 NM AND PIXEL SIZE ΔPIXEL= 0.7 µM. ... 50 -FIG. 2. 14. HOLOGRAM AND AMPLITUDE RECONSTRUCTION OF THE OPTICAL RULER IN THE CASE OF
MAGNIFICATION M1. THE RECONSTRUCTION WITH TWIN IMAGE CORRECTION WAS OBTAINED AFTER N = 30 ITERATIONS. ... 51 -FIG. 2. 15. PLOT PROFILE FOR THE RED LINE IN B WHICH REPRESENTS THE AMPLITUDE RECONSTRUCTION, AFTER
TWIN IMAGE CORRECTION, IN THE CASE M2 WITH Λ1= 405 NM AND PIXEL SIZE ΔPIXEL= 0.6 µM. ... 51 -FIG. 2. 16. HOLOGRAM AND AMPLITUDE RECONSTRUCTION OF THE OPTICAL RULER IN THE CASE OF
MAGNIFICATION M2. THE RECONSTRUCTION WITH TWIN IMAGE CORRECTION WAS SIMULATED UNDER N = 30 ITERATIONS. ... 52 -FIG. 2. 17. PLOT PROFILE FOR THE RED LINE IN B WHICH REPRESENTS THE AMPLITUDE RECONSTRUCTION, AFTER
TWIN IMAGE CORRECTION, IN THE CASE M2 WITH 𝜆𝜆 = 405 NM AND PIXEL SIZE ΔPIXEL= 0.7 µM. ... 52 FIG. 3. 1. ZEBRAFISH STAGE SEQUENCES ADAPTED FROM. ... 56 -FIG. 3. 2. A) 6 HPF FULL ZEBRAFISH EMBRYO, B) DETAIL OF A 24 HPF ZEBRAFISH EMBRYO, C) DETAIL OF A 48
HPF DECHORIONATED EMBRYO, H) RECONSTRUCTED AMPLITUDE IMAGE OF A DECHORIONATED 48 HPF ZEBRAFISH EMBRYO AND CORRESPONDING ZOOMS OF DIFFERENT DETAILS: D) RELATIVE POSITION Z = 0 µM, THE RED ARROW IS A BONE STRUCTURE LINE, E) Z1 = 250 µM THE ARROW INDICATES THE CAUDAL FIN; F) Z2 = 500 µM THE RED LINE POINTS THE VEIN AND ARTERY WHILE IN G) AT SAME DISTANCE Z2 = 500 µM THE RED LINES ARE FOLLOWING THE DIRECTION OF INTERSEGMENTAL BLOOD VESSELS.THE GIVEN VALUES Z CORRESPOND TO THE RELATIVE BACK-PROPAGATION DISTANCE, I.E. TO THE RELATIVE DISTANCE
List of Figures
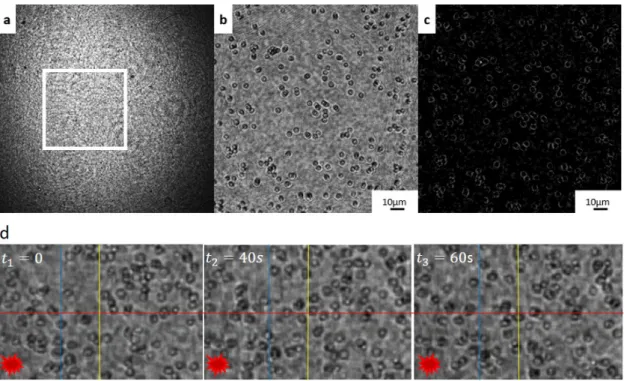
FIG. 3. 3. CELL CULTURE: A) IMAGE ACHIEVED WITH A 20X OPTICAL MICROSCOPE B) RECONSTRUCTED AMPLITUDE IMAGE OF A CELL CULTURE. THE FULL FIELD-OF-VIEW IS PRESENTED WITH THE CORRESPONDENT ZOOM INTO THE RED SQUARES IN THE CELLS REGION. ... 60 -FIG. 3. 4. RECONSTRUCTED AMPLITUDE IMAGE OF A CELL CULTURE A) WITHOUT TWIN IMAGE CORRECTION B)
WITH TWIN IMAGE CORRECTION AND THE CORRESPONDING PHASE IMAGES IN C. THE BOTTOM LINE IMAGES CORRESPOND TO ZOOMS INTO THE RED SQUARES OF A), B) AND C). THE SCALE BAR IS 50 µM. ... 61 -FIG. 3. 5. A), B), C) HOLOGRAM, D), E), F) RECONSTRUCTED AMPLITUDE IMAGE OF CELL CULTURE WITH
ACQUISITION SOFTWARE AND NO TWIN IMAGE CORRECTION G), H), I) RECONSTRUCTED AMPLITUDE IMAGE USING POST-PROCESSING DATA WITH TWIN IMAGE CORRECTION; H) IS A ZOOM INTO THE BLUE SQUARE REPRESENTED IN I).THE CAPITAL LETTERS CORRESPONDS TO CYTOPLASM (A), NUCLEAR ENVELOPE (B), AND THE NUCLEOLUS (C). ... 63 -FIG. 3. 6. ESTIMATION OF THE RESOLUTION ON THE NUCLEAR ENVELOPE: A) THE SAMPLE AND THE REGION
CHOSEN FOR CALCULATION TAKEN FROM FIG. 3. 5G THE CAPITAL LETTERS CORRESPONDS TO CYTOPLASM (A), NUCLEAR ENVELOPE (B), AND THE NUCLEOLUS (C); B) PROFILE PLOTS OF THE REGION MARKED IN A. - 64
-FIG. 3. 7. LEFT: OPTICAL IMAGE WITH SYNECHOCYSTIS SP. PCC 6803, ADAPTED FROM RIGHT: SCHEMATIC REPRESENTATION OF CYANOBACTERIA’ STRUCTURE... 65 FIG. 3. 8. SAMPLE PREPARATION FOLLOWING THE PROTOCOL OF CYANOBACTERIA FIXED IN GELATIN. ... 66 -FIG. 3. 9. CONFIGURATION USE FOR CYANOBACTERIA EXPERIMENT AND THEIR INTERACTION WITH THE LIGHT. . -
67
-FIG. 3. 10. RECONSTRUCTED HOLOGRAM FROM CYANOBACTERIA, IN A) AMPLITUDE AND B) PHASE; C) SCREENSHOTS AT DIFFERENT TIMES THAT SHOW THE MOVEMENT OF THE CELLS IN THE FLUID IN THE DIRECTION OF THE SOURCE OF LIGHT (THE RED STAR). ... 68 -FIG. 3. 11. A) HOLOGRAM, RECONSTRUCTED HOLOGRAM FROM CYANOBACTERIA, IN B) AMPLITUDE AND C)
PHASE; D) SCREENSHOTS AT DIFFERENT TIMES THAT SHOW THE MOVEMENT OF THE CELLS IN THE GELATIN IN THE DIRECTION OF THE SOURCE OF LIGHT (THE RED STAR). THE TRACKING OF THE MOTION OF BACTERIA CAN ALSO BE VIEWED IN THE VIDEO, SEE LINK. ... 69 -FIG. 3. 12. PRINCIPLE OF BACK-PROPAGATION SLICING. THE HOLOGRAM IS BACK-PROPAGATED IN THE OBJECT PLANE AND DEPENDING ON THE NUMERICAL APERTURE OF THE COLLECTED PATTERN ON THE DETECTOR THE DEPTH OF FOCUS WILL VARY INVERSELY PROPORTIONAL TO IT. A HIGH NA WILL CREATE A THIN DOF (OR 2D SLICE) AND A LOW NA WILL ELONGATE THE DOF. ... 72 -FIG. 3. 13. ILLUSTRATION OF THE 3D CALIBRATION TARGET. TO BE MORE REPRESENTATIVE WE DEFINE EACH
PLAN WITH A DIFFERENT COLOR. IN INSET, AN IMAGE OF THE POLYMERIC MICROSPHERES (IMAGE FROM THE MANUFACTURER). ... -73 -FIG. 3. 14. ILLUSTRATION OF THE FREE SPACE PROPAGATOR IN DIFFERENT PLANES USING ONE HOLOGRAM. 1-THE SAMPLE IS LOCATED UNDER A COHERENT ILLUMINATION. 2- ONE HOLOGRAM IS ACQUIRED. 3- BY USING THE SLICING FUNCTION BASED ON FRESNEL PROPAGATION (HZ) WE CAN EXTRACT IMAGES FOR EACH
PLAN ΔZI. ... 74
-FIG. 3. 15. THE EXPERIMENTAL HOLOGRAM FROM THE 3D CALIBRATION TARGET (LEFT), AND THE REFERENCE SIGNAL WITHOUT THE SAMPLE (RIGHT). THE ACQUISITION TIME IS 100MS. ... 75 -FIG. 3. 16. DEMONSTRATION OF 3D IMAGING WITH DIH. A) THE HOLOGRAM IN FULL FIELD OF VIEW. THE WHITE SQUARE REPRESENTS THE AREA SHOWN IN B; B) THE RECONSTRUCTION OBTAINED FROM HOLOGRAM A) IN THE THREE SUCCESSIVE PLANES. ... 75 -FIG. 3. 17. A) ZOOM INTO EACH MICROSPHERE MARKED -FIG. 3. 16 -B WHEN ON FOCUS (I.E. AT THE APPROPRIATE PROPAGATION DISTANCE). B) THE SAME MICROSPHERES, BUT AS RECONSTRUCTED FOR THE PROPAGATION
List of Figures
DISTANCE THAT PUT PARTICLE 1 INTO FOCUS. THE ZOOM FACTOR WAS REDUCED IN ORDER TO SEE THE INTERFERENCE RINGS AROUND THE OUT OF FOCUS MICROSPHERES. ... 76 FIG. 3. 18. OPTICAL IMAGE OF 10µM DIAMETER MICROSPHERES, OBJECTIVE 20X. ... 76 -FIG. 3. 19. U20S CELLS OBSERVED WITH AN OPTICAL MICROSCOPE. THE FIRST IMAGE REPRESENTS THE SAMPLE
THAT WILL BE IMAGED WITH OUR DIH MICROSCOPE. IN THE SECOND IMAGE, WE CAN SEE AN AREA WITH A GROUP OF CELLS. ... 77 -FIG. 3. 20. A) THE EXPERIMENTAL HOLOGRAM OF THE DIH; B) THE AMPLITUDE RECONSTRUCTION WITH TWIN
IMAGE CORRECTION, AFTER N = 10 ITERATION, RESPECTIVELY C) THE PHASE RECONSTRUCTION ... 78 -FIG. 3. 21. SLICING OF THE RECONSTRUCTED AMPLITUDE OF THE CELL DISPLAYED IN -FIG. 3. 20-B. SLICES ARE
RECOVERED AT DIFFERENT FOCAL POINTS ΔZI(µM) RANGING FROM 0 TO 8 µM. ... -79
-FIG. 3. 22. 3D RECONSTRUCTION OF U2OS CELLS USING SLICING FUNCTION LEFT: THE SLICES USED FOR RECONSTRUCTION; RIGHT: THE 3D VIEW OF THE SAMPLE (SEE VIDEO LINK). ... 79 -FIG. 3. 23. A) CONFOCAL IMAGE OF U2OS CELLS TRANSFECTED WITH GFP-FUSIONS AND LABELED WITH
MITOTRACKER, RESPECTIVELY B) TRANSMISSION REPRESENTATION OF THE SAME SAMPLE. BOTH WITH A MAGNIFICATION FACTOR 60X... 80
FIG. 4. 1 ILLUSTRATION OF THE HOLOGRAPHIC SEPARATION IN FOURIER TRANSFORM HOLOGRAPHY. ... 87 -FIG. 4. 2. A SCHEME OF THE WORKING PRINCIPLE OF OUR EXPERIMENTAL PROTOTYPE OF LAB-ON-A-CHIP FTH
MICROSCOPE. ... 88 -FIG. 4. 3. EXAMPLE OF UNIFORM (A) AND NON-UNIFORM (B) ELECTRIC FIELD EFFECT ON ELECTRICALLY
CHARGED PARTICLES AND ON NEUTRAL POLARIZED PARTICLES (POSITIVE DEP), RESPECTIVELY97. .... 89 -FIG.4.4.POSITIVE DEP OF 557 NM DIAMETER FLUORESCENT LATEX SPHERES ON CASTELLATED ELECTRODES
WITH AN APPLIED SIGNAL OF 8 VOLTS PEAK-TO-PEAK AT 700 KHZ.THE SPHERES COLLECT AT THE HIGH FIELD REGIONS MARKED B,C. ... 90 -FIG. 4. 5 SCHEMATIC REPRESENTATION OF THE PHENOMENON OF ELECTROPORATION, ADAPTED FROM
LAKSHMANANET AL. ... 91 FIG. 4. 6 OPTICAL IMAGE OF A MICROFLUIDIC ELECTROPORATION DEVICE. ... 91 FIG. 4. 7 SCHEMATIC REPRESENTATION OF THE MICROFLUIDIC CHIP. ... 93 -FIG. 4. 8. BOTTOM VIEW OF THE GLASS LAYER WITH THE PATTERN OF THE FOV PUPIL AND NANOHOLES (THEIR
POSITION IS REPRESENTED BY THE SQUARES), REPRESENTED IN TRANSMISSION (PINK COLOUR MEANS FULL TRANSMISSION, WHITE MEANS NO TRANSMISSION). ... 94 -FIG. 4. 9. GENERAL PRINCIPLES DESIGN: A) 2-LAYER CHIP; B) DETAIL OF THE CENTRAL AREA; C) DETAIL OF THE
CHAMBER AND VISUALIZATION AREA. BLUE - FLUIDIC LAYER (IN SI); RED: FIELD OF VIEW AND NANOHOLES (IN GLASS);CYAN:ELECTRODES (METAL ON GLASS).NOTES: I)THE LINKS TO PADS ARE NOT REPRESENTED; II) THE DIMENSION OF THE NANOHOLES ARE CONVENTIONALLY EXAGGERATED; III) LIGHT CAN ONLY GO THROUGH THE RED PARTS; IV) THE SEMICIRCLE AROUND THE NANOHOLES REPRESENT OPENINGS BY ETCHING IN SILICON LAYER THAT ALLOWS THE LIGHT TO PASS THROUGH AND REACH THE DETECTOR. ... 94 FIG. 4. 10. CM FACTOR AS FUNCTION OF FREQUENCY. ... 95
-List of Figures
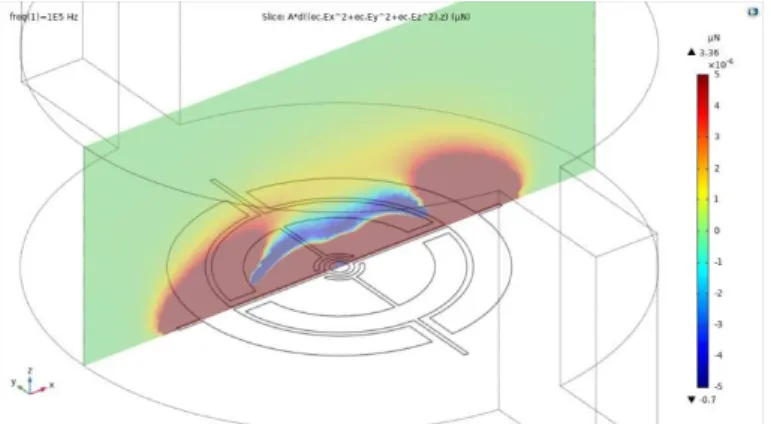
FIG. 4. 12 FDEP (Z COMPONENT MAGNITUDE). CROSS-SECTION VIEW ALONG (LEFT) AND ACROSS (RIGHT) THE INPUTOUTPUT CHANNEL... 97 -FIG. 4. 13 VECTOR REPRESENTATION OF THE DEP FORCES. CROSS-SECTION ALONG (LEFT) AND ACROSS (RIGHT)
THE INPUT-OUTPUT CHANNELS ASSOCIATED TO FIG. 4. 11 FIELD REPRESENTATION RESPECTIVELY (ARROW LENGTH IN LOGARITHMIC SCALE). ... 97 -FIG. 4. 14 CELLS TRAJECTORIES IN THE NEGATIVE DEP REGIME. POSITIONS REACHED AFTER 300 SECONDS.
INSET: INITIAL POSITIONS OF THE CELLS. ... - 97 FIG. 4. 15 OPTIMIZED DESIGN OF PLANAR ELECTRODES CONFIGURED ON A GLASS SUBSTRATE. ... 98 -FIG. 4. 16 CELLS TRAJECTORIES IN C1 CONFIGURATION IN NEGATIVE (LEFT) AND POSITIVE (RIGHT) DEP
REGIMES.POSITIONS REACHED AFTER 300 SECONDS AND AFTER 30 SECONDS, RESPECTIVELY. ... -99 -FIG. 4. 17 CELLS TRAJECTORIES IN C2 CONFIGURATION IN NEGATIVE (LEFT) AND POSITIVE (RIGHT) DEP
REGIMES. POSITIONS REACHED AFTER 300 SECONDS AND AFTER 30 SECONDS, RESPECTIVELY. ... 100 -FIG. 4. 18 CELLS TRAJECTORIES IN C4 CONFIGURATION IN NEGATIVE (LEFT) AND POSITIVE (RIGHT) DEP
REGIMES. POSITIONS REACHED AFTER 300 SECONDS AND AFTER 30 SECONDS, RESPECTIVELY. ... 100 -FIG. 4. 19. A) OPTICAL IMAGE OF THE ELECTRODES AND THE CHAMBER AND B-C) SEM IMAGES OF THE
NANOHOLES, WITH A DIAMETER OF C) 490 NM AND B) 1400 NM. IN D) A PICTURE OF THE FINAL DEVICE. THE TWO LARGE HOLES VISIBLE ON THE TOP SIDE ARE USED TO FILL THE CHAMBER WITH FLUID AND CELLS. ELECTRICAL WIRES (YELLOW AND BLACK) ARE CONNECTED TO THE PADS. NOTE: THE THREE ELECTRODES ARE NUMBERED A, B1, B2. ... 101 -FIG. 4. 20. THE EXPERIMENTAL DEMONSTRATION FOR THE TWO CASES: A. THE BEAM IS CENTRED WITH THE
PUPIL: A) THE RECORDED HOLOGRAM AND B) THE HOLOGRAPHIC RECONSTRUCTION OF A. ; B. THE BEAM IS CENTRED BETWEEN THE PUPIL AND ONE NANOHOLE: C) THE RECORDED HOLOGRAM AND D) THE HOLOGRAPHIC RECONSTRUCTION OF THE SIGNAL IN C. NOTE: THE RED AND YELLOW CIRCLES IN B SURROUNDS THE HOLOGRAMS (SOLID LINE) AND THEIR CONJUGATES (DASH LINE) FOR TWO DIFFERENT NANOHOLES. ... 103 -FIG. 4. 21. FINAL OBJECT RECONSTRUCTION: A) ZOOM INTO THE SAMPLE EXIT FIELD RECONSTRUCTED IN THE
PUPIL PLANE, CORRESPONDING TO Z = 0 µM. HERE, WE SELECTED THE TOP RECONSTRUCTION FROM IMAGE 4.19-D. B) MODULUS OF THE SAMPLE RECONSTRUCTION IN THE SAMPLE PLANE, I.E. AT Z = 400 ΜM; C) MODULUS OF THE SAMPLE EXIT WAVE AFTER BACK-PROPAGATION AT Z = 600 ΜM. THE TRANSVERSE SAMPLING STEP IS 0.5 ΜM. ... 105 -FIG. 4. 22 THE INITIAL WAVEFRONT (LEFT) USED FOR THE RECONSTRUCTION AND THE WAVEFRONT IN THE PLANE SAMPLE (RIGHT). ... 105 -FIG. 4. 23. RESOLUTION TEST OF THE SAMPLE (ELECTRODES). THE GRAPH IS A LINEOUT ALONG THE RED LINE ON THE GREY SCALE IMAGE, REPRESENTING THE HOLOGRAPHIC RECONSTRUCTION OF THE SAMPLE. ... -106 -FIG. 4. 24. OPTICAL IMAGE OF HELA CELLS AFTER TRYPSINISATION, OBTAINED WITH A 40X MAGNIFICATION.
THE CELL’S DIMENSION, MARKED BY THE BLACK LINE, IS 15µM. ... 108 -FIG. 4. 25 ELECTRODES CONNECTION: C1- BETWEEN A AND B1+B2 (B1 AND B2 CONNECTED TOGETHER).- 109
-FIG. 4. 26. MICROFLUIDIC CHIP FOR CELLS SEPARATION IN THE CIRCULAR REGION FOR HOLOGRAPHIC IMAGING. THE CELL ISOLATED UNDER A POSITIVE DEP IS HIGHLIGHTED BY A RED CIRCLE. FOUR PHASES OF DISPLACEMENT ARE PRESENTED IN: A: T=0S, B: T=4S, C: T=8S, D: T=18S. THE CELL IS ISOLATED AT T= 14S. THOSE IMAGES WHERE OBTAINED WITH AN OPTICAL MICROSCOPE WITH A 20X OBJECTIVE. ... 110 -FIG. 4. 27. OPTICAL MICROSCOPE IMAGE OF A N-DEP EXPERIMENT (20X OBJECTIVE). THE WHITE DOTTED CIRCLE
List of Figures
FIG. 4. 28. CELL HANDLING WITH P-DEP FOR 10VPP AND 20MHZ. THE CELL OF INTEREST IS MARKED WITH A RED SQUARE IN A TRANSMISSION IMAGE OBTAINED WITH A MICROSCOPE OBJECTIVE OF 10X. IN B), A MAGNIFIED IMAGE OF THE RED SQUARE, WITH A 40X MICROSCOPE OBJECTIVE. ... 112 FIG. 4. 29. EXPERIMENTAL RESULTS OF HELA CELL IMAGING WITH THE FTH MICROSCOPE. ... 113 -FIG. 4. 30. CELLS HANDLING WITH P-DEP FOR 10VPP AND 20MHZ. A) OPTICAL MICROSCOPE IMAGE, IN
TRANSMISSION AND 20X OBJECTIVE, WITH ABOUT 20 CELLS IN THE FIELD OF VIEW; B) HOLOGRAPHIC RECONSTRUCTION TAKEN ABOUT 10 MIN AFTER THE OPTICAL IMAGE, Z=450µM. ... 114 -FIG. 4. 31. EXPERIMENTAL RESULTS OF HELA CELLS IMAGING WITH THE FTH MICROSCOPE. A) THE HOLOGRAM DETECTED IN THE FAR FIELD BY THE CAMERA; B) AMPLITUDE OF THE FOURIER TRANSFORM OF A), WITH BOTH THE OBJECT AND ITS MIRROR CONJUGATE VISIBLE. C)ZOOM FROM IMAGE B) INTO THE RECONSTRUCTED FIELD IN THE PUPIL PLANE (Z=0µM). D) THE RECONSTRUCTION OF THE MODULUS IN THE SAMPLE PLANE: Z = 450ΜM. ... 115 -FIG. 4. 32. A) SIMULATIONS OF A MASK WITH FOV OF 150µM IN THE ELECTRODES REGION, RESPECTIVELY A
MASK OF 20µM WIDTH IN THE CHANNELS REGION. TWO NANOHOLES OF 1µM DIAMETER WHERE CONSIDERED AS FTH REFERENCES (THE POSITION OF THE NANOHOLES IS SURROUNDED BY THE RED CIRCLE); B) THE SIMULATION SHOWS THE HOLOGRAMS RECONSTRUCTION AND THEIR CONJUGATE. NOTE: IN THE FOV REGION A REPRESENTATION OF A CELL OF 15µM DIAMETER WAS CONSIDER AS AN ARTIFICIAL OBJECT FOR A SIZE REFERENCE. ... 116
-List of Tables
TABLE 3. 1. TYPICAL REFRACTIVE INDEX VALUES FOR VARIOUS ORGANELLES IN A CELL73,74,75. ... 59 -TABLE 4. 1 DIMENSIONS OF THE NANOHOLES (NHS) ON 5 VERSIONS OF THE CHIP. ... 102
-TABLE 4. 2. ELECTRICAL PROPERTIES OF THE CELLS AND BUFFER3940... 108 -TABLE 4. 3 APPLIED VOLTAGE IN C1 CONFIGURATION: BETWEEN A AND B1+B2 (B1 AND B2 CONNECTED TOGETHER). ... 111
-Motivation
The microscope's historical progress reveals a revolution in science and medicine and illustrates how it has become one of the most vital tools in medicine today. For a long time the sub millimetric world of microorganisms was inaccessible to humans and limited the medical progress and diagnosis. Only after the invention and refinement of the microscope did scientists manage to decipher many of the mysteries of this unknown micro universe. One such landmark was the first observation and drawing of bacteria realized by Anton von Leeuwenhoek in the early 1670s. Today’s microscopes produce striking images that impress with their forms and, apart from the esthetic aspect, offer invaluable information for many fields of application.
Microscopes are usually built around a common process: one or more lenses deflect the trajectory of the light rays coming from the object to be observed in order to create a magnified image, visible to the naked eye or on a detector. After the first demonstrations in the 17th century,
other methods to increase the resolution and contrast were developed. New improvements are still proposed nowadays. One such direction is to extend its use out of the limits of the visible part of the electromagnetic spectrum of light, towards the X-ray domain. However, although extraordinary progresses have been made, modern versions of those microscopes still use the same operating principle as the original ones.
Nevertheless, new operating principles have been proposed over the years in order to obtain ever better spatial resolutions, leading to major breakthroughs, such as fluorescence microscopy and super-resolution microscopy. X-ray microscopy, on the other hand, prompted the development of diffraction based imaging techniques that are at the heart of this work. However, as I saw during the formation that I attended during my PhD (FEBS Advanced Course Functional imaging of nuclear organization & signaling, advance microscopy - http://intranet.lcam-fnwi.nl/), not all biological problems can be addressed based on the distribution of fluorescence markers, for example. The objective of Chapter 1 is to give a brief overview about the evolution of the most used microscopy techniques from optical to the ones based on diffractive physics.
Diffraction based modern techniques, often called through the generic name of lensless microscopy, are the new hot topic of microscopy research. First developed for X-ray and electron imaging, the techniques suppress the objective optics to remove aberration sources and reach resolutions closer to the Abbe limits. Building up on those successes, lensless imaging is now being transposed back to the visible range. Emerging from the initial idea of Denis Gabor, holography represents one basis of these new microscopy approaches. Digital holography is based on the diffraction and interference phenomena. The light scattered by the sample is directly recorded by a spatial detector. Using this so-called hologram, a numerical algorithm then reconstructs the sample image with a resolution that is not any more limited by the objective quality. The main advantages of lensless techniques are their ability to reach nanometric spatial resolutions with label-free samples. Additionally, as the complete diffracted field is reconstructed, they can emulate many different types
Motivation
of visible microscopy in a single acquisition (dark and bright field, phase contrast…). Moreover, they allow pseudo-3D reconstructions of the samples without requiring destructive and time-consuming acquisition procedures.
This thesis aims to merge two major fields, lensless microscopy and biology, into a new ‘microscopy know-how’. The idea started in the LIDYL research laboratory in 2014 in the context of an ANR Project called « Nano-Imagine » (‘2D Nanoscale Lensless Imaging and wave front correction in imaging’), built around a strong collaboration between LIDYL (CEA Saclay) and the SME Company Imagine Optic (https://www.imagine-optic.com/). At that time, a first PhD student posed the basis of the apparatus. However, real applications relevant to bio-related problems were not yet addressed.
During this thesis, I improved the technology and tested its impact on cell imaging and analysis. I developed the instrument further on, with applications relevant to biologists in mind. Based on these preliminary studies, I could select digital in-line holography (DIH) as the lensless technique best fitted for most bio-related problems. Its main advantages are the large field of view for imaging which permits to test a wide range of samples (from single cell to embryos or tissue); the low dose of radiation that allows an in-vivo analysis and 3D image acquisition in single shot. The simplicity of digital in-line holography configuration brings easy handling, portability (easy to transport from one place to another) and low manufacturing costs. The technique, the microscope and its applicability are presented Chapter 2 and 3. Additionally in Chapter 3, I assess non-invasive 3D in-line holographic imaging and its impact on imaging reconstruction and cell analysis.
One key advantage of lensless microscopy is the ability for live imaging at high speed. This is of crucial importance for point of care applications, where speed and statistics are mandatory. However, in line holography presents drawbacks that could prevent those high profile applications. Therefore, in the last experiment of my PhD, I switched to Fourier Transform Holography (FTH), which the aim of integrating a microfluidics device to manipulate the samples directly in the prototype. This proposal uses the expertise in microfluidics that I accumulated during my master thesis. The concept is based on single cell analysis by coupling electric handling and measurements with digital holography, thus allowing imaging single cells with nanoscale resolutions. Compared to DIH, where the resolution is limited by various parameters (sensor pixel size, sample transparency, temporal and spatial resolution…), in the case of FTH microscopy the resolution is given by the holographic references necessary in the image reconstruction. The development of Lab-on-a-chip (LOC) systems allows the optimization of the production costs which contributes to cost-effective image tool and data analysis. With the help of LOC a low number of cells or molecules can be manipulated, detected or/and analysed which further leads to truly single-cell studies.
The successive steps of development and implementation of the microfluidic chip, together with the first preliminary imaging results, are presented Chapter 4.
1. INTRODUCTION
The microscopy evolution opened a large field of applications especially in biology. Major breakthroughs have been realized targeting better and better spatio-temporal performance of various microscopy modalities, such as classical optical microscopy and fluorescence microscopy. In the latter case, only selected biological problems can be addressed based on the compatibility and distribution of fluorescence markers. In many instances additional and complementary contrast properties are needed. Thanks to the large availability of lower cost, megapixel detectors and the progress in computing speed in the 2000s years, digital lensless imaging has emerged. This technique has the advantage, by definition, of being free of optical components, avoiding the drawbacks of aberrations which systematically deteriorate the final image.
Imaging by lensless technique is non-invasive and capable of operating on label free samples in a large field-of-view (FOV). A single acquisition is enough to record the amplitude and phase of the sample, which further allows real-time filming of biological processes when a sequence of image can be recorded using fast cameras. Another significant advantage of lensless imaging is the possibility to achieve 3D reconstruction of volume objects from a 2D image-hologram and to retrieve both amplitude and phase information of the optical field.
Here, we review some biological context and their standard imaging tools. I also introduce the development of lensless imaging and its 3D applications.
1.1. Review of established microscopy techniques
The discovery of the cell as the basic unit of life in the 17th century1 opened for scientists an
important field of investigation. Two major issues made the progress of their exploration harder: the dimension of the cells and their transparency. During the next centuries, these two difficulties led the researchers to build machines based on bulky lenses. Complex optical systems with aberration correction have been invented. By varying the type of lenses and light sources, five types of light microscopy can be defined: bright-field, dark-field, phase-contrast, differential interference, and fluorescence. In the late 20th century, fluorescent microscopy has been demonstrated expending
optical microscopy to fluorescence spectroscopy and fluorescent probes. Fluorescence or STED microscopy has been awarded. Fluorescence microscopy has allowed to image objects much smaller than the diffraction limit. Other techniques have allowed to break the diffraction limit such as multiphoton microscopy (or second harmonic generation imaging), confocal microscopy, super-resolution imaging, wide field, spin disk to cite a few.
Chapter 1. Introduction
In the next section we will present some of the currently most used techniques, their limitations and the importance of investigating new microscopy tools, such as lensless imaging.
1.1.1 Florescent microscopy
Florescent microscopy remains one of the most important standard technique applied in biological imaging, especially 3D cell imaging. The principle of fluorescence imaging is based on different molecules with fluorescent properties, so called fluorophores that are attached to the cell component that we aim to image. One of the most used fluorophore is Green Fluorescent Protein (GFP), which is a fluorescent protein from the Pacific jelly fish Aequorea Victoria, discovery that received Nobel Prize in Chemistry in 20082. From this basis many fluorescent proteins were developed to cover the
full visible spectrum of emissions3.
FIG.1. 1. JELLY FISH AEQUOREA VICTORIA AND THE GFP PROTEIN, ADAPTED FROM NOBLE PRIZE IN CHEMISTRY 2008.
These fluorescent proteins can for instance be fixed on microbeads or antibodies or can be directly expressed by genetically modified cells. Illuminated with a specific exciting wavelength λa,
a fluorophore absorbs the light and re-emits at a longer wavelength λe. Using a filter, this light can
be selected and re-imaged by standard microscopy to give a repartition map of the fluorophores. Each fluorophore emission is detected as a point source which creates the shape of the object or more precisely the intensity distribution. These shapes are called the point spread distribution. The smoother the shape, the more details can be identified in the image.
In Fig.1. 2 is illustrated the resolution given by the Rayleigh criterion. In the top images the diffraction pattern resulted from the emission of one single fluorescent molecule is represented, while
Chapter 1. Introduction
FIG.1. 2. ILLUSTRATION OF THE RESOLUTION RAYLEIGH CRITERION IN FLUORESCENCE MICROSCOPY ADAPTED FROM CHRISTOPH CREMER AND BARRY R. MASTERS4.
Imaging systems resolution in fluorescence microscopy are usually based on the Rayleigh criterion5, which marks the well know “diffraction limit resolution”. The formula that defines this
principle is:
𝑠𝑠𝑠𝑠𝑠𝑠𝑠𝑠 = 1.22𝑁𝑁𝑁𝑁𝜆𝜆 (1.1)
where λ is the wavelength of light and NA the numerical aperture of the optical system. The diffraction limit of the system represents the resolving distance between two points that are separated by the angle 𝑠𝑠. For instance, if we consider λ = 550nm, and the NA = 1.5 (corresponding to medium based on oil), the maximum resolution in this case is approximately 440 nm.
The principal advantage of this technique is its high signal to noise ratio. However, there are still lot of problems that results due to the fluorophores that causes damage in the image visualization. The three main techniques based on fluorescent emission are the wide-field microscopy, the confocal
microscopy and the super-resolution microscopy and their derivatives. We present them below, with
their main characteristics.
1.1.2. Wide field microscopy
Wide field microscopy refers to a basic concept of illumination in microscopy. The whole sample is illuminate with a specific wavelength that excites the fluorescent molecules in the bio-sample. This is a good advantage for producing 2D images of the specimen as the entire field can be captured at once. The typical setup uses two filters, one for excitation and one for emission, and a dichroic mirror. By only allowing light of specific wavelengths to pass, the filter cube reduces the ‘noise’
Chapter 1. Introduction
from the sample, ensuring a clear image is produced which only shows the fluorescence of specific fluorophores. In the Fig.1. 3A a schematic configuration of the optical part is presented.
However, the wide field and linear excitation implies that the florescent molecules that are out of focus will also be excited. Therefore, the out of focus emission represents a factor that reduces the resolution, and makes the production of 3D images sometimes unsuitable for this type of microscopy. Additionally, a post-processing step can be realized with deconvolution programs to improve the quality of the image by removing part of the blur.
1.1.3. Confocal microscopy
The most important advantage of this microscope is the ability to produce thin optically section, removing unwanted light above and below the focal plane. It can provide better contrast and allows 3D reconstruction by combining the data from a stack of images. Confocal scanning microscopy is the most common optical sectioning technique used for fluorescence imaging6. The configuration
scheme of the apparatus is presented in Fig.1. 3B.
FIG.1. 3. (A) WIDE-FIELD EXCITES A COLUMN OF THE SAMPLE SECTION, WHICH CAUSES EMISSION FLUORESCENCE FROM BOTH INSIDE AND OUTSIDE THE FOCAL PLANE. OUT-OF-FOCUS FLUORESCENCE CONTRIBUTES TO DETAIL OBSCURITY, LIMITING THE
Chapter 1. Introduction
The basic concept behind the confocal approach is that spatial filtering techniques are used to remove the light that is out of focus, by placing a pinhole as shown in Fig.1. 3B. The emitted light is detected by a photomultiplier tube (PMT) or an avalanche photodiode (APD) and the image is then constructed by mapping the detected light in dependence of the position of the scanning spot. The 3D volume is scanned by translating either the sample or the optical parts along the three directions. This modality of acquisition presents an important photo-toxicity for the sample since at each acquisition of a point in the volume, the exciting light passes through the whole culture.
One important problem of confocal is photobleaching, especially for sample with low signal. Photobleaching is a photochemical process which defines the alteration of the fluorophores, in other words the fluorophores are no longer able to fluoresce. This effect disturbs the correct observation of fluorescent molecules that are basically destroyed by the light exposure necessary to stimulate them. However, this effect has other applications such as study the motion of diffusion of molecules, but adapted microscopy techniques are needed. These techniques include FRAP (Fluorescence recovery after photobleaching) where observing the recovery after photobleaching can confirm the movements of certain molecules. FRET (Foster Resonance Energy Transfer) is another technique where the energy transfer between the two light-sensitive molecules can be used to determine the distance between two molecules.
FIG.1. 4. IMAGES OF 15µm THICK MOUSE TISSUE REALIZED WITH 63X/1.4NA OIL OBJECTIVE IN BOTH A) WIDE FIELD AND B) A LASER SCANNING CONFOCAL MICROSCOPE8.
The confocal has better resolution in comparison with the wide field technique, but it has the disadvantage of the harmful nature of high-intensity laser irradiation to living cells and tissues.
Chapter 1. Introduction
1.1.4 Super-resolution microscopy
Wide-field deconvolution and confocal microscopes are widely used in optical bio imaging, but recently several new technologies, collectively named super-resolution microscopy, have been developed. Super-resolution microscopy breaks the classical diffraction limit and shift the optical resolution down to macromolecular or even molecular levels9. Among those different techniques one
can cite PALM (PhotoActivation Localization Microscopy), STORM (Stochastic Optical Reconstruction Microscopy) or STED (Stimulated-Emission-Depletion fluorescence microscopy) for example.
I propose here to detail the STED method. STED microscope is a modified confocal laser microscope that uses a second laser10. The second laser has a longer wavelength and the beam has a
donut shaped (in Fig.1. 5 it is called STED pulse PSF). In the process of image acquisition the donut beam follow the excitation beam. Its role is to filter the excited fluorophores used for the final image11. Therefore, all the excited fluorophores that are in the centre of the donut beam (the hole in
donut) are able to emit fluorescence, while the others are ‘bleached’ back to the ground state. The resolution in this case is given by the hole in the centre of the donut, and can go beyond the diffraction limit.
FIG.1. 5. STIMULATED EMISSION DEPLETION (STED) ADAPTED FROM L. SCHERMELLEH ET AL, JCB12.
In the Fig.1. 6 a comparison between the two powerful microscopic tools is presented. In the STED image the lateral resolution is much higher whereas the longitudinal resolution (z) is just
Chapter 1. Introduction
FIG.1. 6. COMPARISON BETWEEN CONFOCAL RESOLUTION AND STED.
Super-resolution microscopy allows discrimination of single features at high spatial densities. STED microscopy is clearly suitable for the investigation of rapid dynamic processes beyond the diffraction limit. A potential drawback in STED is the very high intensity of the laser that could produce photobleaching or phototoxicity. If we compare with a conventional laser scanning confocal the power used is much higher.
1.2. X-ray imaging
Beside the compact imaging tools that are able to resolve most of the elements of a cell, X-ray microscopy has the power to look into the nanoscale domain and understand the functions of the organelles and proteins, thanks to X-rays short wavelengths. Additionally, the use of X-rays leads to chemical specificity, and the short pulse duration has already allowed time resolved studies of dynamics. X-ray microscopes are typically based on synchrotron-radiation sources, which makes them hard to access to. Nowadays many X-ray microscopes are available worldwide, such as the ones at Berkeley’s Advanced Light Source13 or the HERMES beamline at SOLEIL14.
However, while spatial resolutions of 1nm have been demonstrated, the resolution is typically around 25nm, limited by the signal to noise ratio15 and the performance of the X-ray lenses. An additional
constraint is the fact that for soft X-ray radiation, especially for the so-called water window range, especially useful for bio-imaging, vacuum experimental conditions are needed, which restricts a lot its applicability.
Moreover, the contrast in X-ray imaging is given by the interaction of the X-rays with the electron clouds. The larger the element atomic number, the higher the contrast. Since the biological samples are mostly constituted of low atomic number elements, a high flux of photons is necessary. This dramatically increases the dose received by the sample. Consequently, as biological matter is highly radiation sensitive, severe radiation damage may be induced16. To summarize, the limitation
Chapter 1. Introduction
produces radiation damage in most of the wet samples, and the difficulty to manufacture optics in the X-ray domain for high spatial resolution. A potential solution for these drawbacks is to remove the objective optics, and to replace them by numerical algorithms acting as virtual lenses. This is the basic idea behind the family of lensless imaging techniques called coherent diffraction imaging.
In the next section, we present a short overview and history of the lensless approach, starting from the X-ray techniques now largely in used for biological imaging to some derivatives that are developed nowadays in the visible regime (see section 1.3. Lensless imaging in visible domain).
1.2.1 Coherent diffractive imaging (CDI)
In coherent diffraction imaging (CDI), no lens is needed. One only needs to record the intensity of the diffraction pattern that emerges in the far field after the interaction of a spatially coherent light
beam with an isolated object on a high-resolution high-dynamic range pixelated detector as shown Fig.1. 7. The sample and the image sensor are positioned in the same axis perpendicular to the beam.
A highly coherent illumination source is required since the techniques is based on the interferences of the diffracted waves on the detector. A general explanation for readers that are not familiar with the phenomena could be find in Annex A. In no way does the diffraction pattern resemble the object itself but, given specific experimental conditions, a computer can convert this digitized image using a phase-retrieval approach. In this way, it is possible to create much better images than with conventional lens-based systems. No aberration lens distorts the magnified image, therefore the spatial resolution, limited only the highest frequencies recorded on the CCD, i.e. by the CCD numerical aperture, can be pushed down close to the diffraction-limit given by the source wavelength. CDI has some advantages compare to super-resolution microscopy. The final image is aberration-free (no lens is used to obtain it). Most importantly, the large penetration depth of X-rays makes the reconstruction of whole cells possible without the need of sectioning. Finally, CDI can lead to quantitative 3D imaging of the entire content of cells and cellular organelles.
Chapter 1. Introduction
FIG.1. 7. SCHEMATIC PRINCIPLE OF CDI PRINCIPLE, REPRODUCED FROM17.
Several variants of CDI have been proposed, the more common ones for biological imaging being ptychography18 and plane-wave CDI.
Ptychography is a derivate approach of coherent diffractive image to overcome the limitation of the finite size of the sample. The X-ray beam is scanned over the sample with a spatial overlap
between consecutive positions, while a diffraction pattern is recorded for every position (see Fig.1. 8). Ptychography extension to tomography, the so-called ptycho-tomography, is already
available at some synchrotron beamlines. While this kind of experiment is highly demanding (in term of experimental stability, total acquisition time and computational power), it has led to impressive 3D resolutions (Fig.1. 9c).
FIG.1. 8. EXAMPLE OF EXPERIMENTAL SETUP OF PTYCHOGRAPHY19.
Plane wave CDI simply follows the experimental scheme described before, and has already led to impressive results (Fig. 1.9 a, b illustrates one such use in bio-imaging). Collecting several 2D diffraction patterns at different angles of a single sample can lead to a tomographic reconstruction of the 3D image of the sample. However, this induces additional experimental constraints, the major one being linked to radiation induced damages. Nevertheless, this capability is already available in various synchrotron beamlines.
Chapter 1. Introduction
FIG.1. 9. COHERENT DIFFRACTIVE IMAGING (CDI) EXAMPLE OF WHOLE ESCHERICHIA COLI BACTERIA: A) DIFFRACTION PATTERN OF PLANE-WAVE CDI; B) CORRESPONDING IMAGE RECONSTRUCTION, REPRODUCED FROM SCHERMELLEH20, AND
PTYCHO-TOMOGRAPHYGRAPHY (C) 3D RENDERING OF MEASURED FROZEN-HYDRATED CHLAMYDOMONASCELLS CONFINED IN A GLASS MICROCAPILLARY, REPRODUCE FROM21.
CDI with short wavelength laser based sources: Since the first demonstration of CDI22, many
researchers have taken a large step in this direction using synchrotron radiation, free electron lasers (FEL) and laser high harmonic generation (HHG). Ultrafast lensless imaging has first been demonstrated using the FLASH FEL facility in Hamburg (Germany)23. In 2007, the group of Kapteyn and Murnane in Boulder Colorado (USA) has demonstrated a similar capability but in multi-shot using high harmonic generation from a 0.8-µm wavelength femtosecond table-top Ti:Sa laser system at a repetition rate of 1 kHz24. Using their powerful µJ yield harmonic source, driven by an 800 nm
high power terawatt laser system, the CEA group proved that single shot femtosecond studies were possible. They are one of the world leaders in this domain 252627. Experiments on ultrafast nanoscale
characterization of magnetic samples have also been performed. More recently28 29 30. Following
these results, CDI using HHG driven by new fibre laser sources has been demonstrated but at a relatively long XUV wavelength (λ=33nm)31. Future prospects focus on pushing nanoscale imaging
applications down to the nanolithography (13.5 nm) and the water window (2-4 nm) spectral ranges.
Attosecond coherent diffractive imaging: Imaging methods that combine attosecond temporal
with nanometre spatial resolution are currently out of reach. Coherent diffractive imaging is based on the diffraction by a sample of a quasi-monochromatic illumination with a coherence time that
Chapter 1. Introduction
demonstrated by CEA and collaborators using a discrete HHG spectral produced by a train of attosecond pulses32. To generalize the approach to broadband isolated attosecond sources a novel
method has been proposed by CEA. It is based on a numerical monochromatisation of the broadband diffraction pattern by the regularised inversion of a matrix, which depends only on the spectrum of the diffracted radiation. Experimental validations in the visible and hard X-rays has already validated the applicability of the method (Huijts et al, submitted to Nature Photonics, in review, https://arxiv.org/abs/1909.11345v1)33. Because of its generality and ease of implementation for
single attosecond pulses, we expect this method to find widespread applications in future attosecond technologies such as petahertz electronics, attosecond nanomagnetism or attosecond energy transfer.
FIG.1. 10. ILLUSTRATION OF THE PRINCIPLE OF COHERENT DIFFRACTIVE IMAGING (CDI) WITH SINGLE SHOT DATA FROM THE CEA HHG SOURCE. A COHERENT BEAM IS ILLUMINATING AN ISOLATED SAMPLE. A CCD DETECTOR RECORDS THE FAR FIELD DIFFRACTION PATTERN. AN ALGORITHM IS THEN USED TO RECONSTRUCT THE IMAGE OF THE SAMPLE, HERE WITH SUB-100 nm SPATIAL RESOLUTION29.
Computer stereo lensless imaging: At a nanometre scale, the ability to gain insights into the 3D properties of artificial or biological systems is often critical. This information is, however, difficult to retrieve as most techniques provide only two-dimensional projections along the imaging axis. Nowadays, intense ultrashort XUV and X-ray pulses allow realizing nanometre scale studies and ultrafast time-resolved 2D movies. Unfortunately, these existing methods are not easily extended to single shot 3D images. As a rule, a three-dimensional image of an object is generated mathematically from hundreds of individual images. This means a high expenditure of time, large amounts of data and high radiation sums. Our group at CEA has now succeeded in significantly accelerating this process by developing a method in which two twin images of an object can be taken with a single ultrafast acquisition from two different viewing directions, which are then combined to form a spatial image - similar to how the human brain forms a stereo image from the two slightly
Chapter 1. Introduction
different images of the two eyes. Computer-aided spatial vision is already established in the field of machine vision and robotics and is now demonstrated in the XUV and hard X-ray spectral ranges34.
1.2.2. X-ray Holography
In 1948 the Nobel Prize Laureate Denis Gabor proposed his famous ‘‘method of wave-front reconstruction’’ which opened the era of holography. The holography technique is presented in details in Chapter 2. The development of optical lasers enabled E. N. Leith and J. Upatnieks35 to
demonstrate the first wave-front reconstruction of a hologram with a reference beam. Since this first successful demonstration, the method of holographic reconstruction has found applications in many different fields of arts, science and technology. Holographic optical elements were used in laser design and investigations of optical semiconductor laser light properties. The full illumination of the specimen makes possible the 3D reconstruction of it recording several projection of the sample from different angles. Using X-ray illumination, holography can be a favourable technique due to the high resolution imaging. As in the case of CDI the sample is isolated. However, the sample may also suffer changes or damage during an experiment when positioned on a surface. There are only a few examples of holographic hard X-ray imaging applied to biological cells.
In the paper of M. Bartels et al36 present the 3D image reconstruction of unstained and
unsliced, freeze-dried cells of the gram-positive bacterium Deinococcus radiodurans (see Fig.1. 10) by tomographic X-ray propagation microscopy, i.e. projection tomography with phase contrast formation by free space propagation.
Chapter 1. Introduction
However, instead of ptychography tomography which involves scanning two translations and one rotation with correspondingly large overhead time, they used X-ray propagation microscopy, based on projection imaging with contrast formation by free space propagation. For the 3D imaging the advantages is the uses of the scanning based on only one degree of freedom (rotation axis). This produces less overhead time in data acquisition and imposes less restrictive requirements on mechanical accuracy and long-term vibrational stability.
In a recent study T. Gorkhover et al37 developed a new holographic method called in-flight holography. With this method, they were able to demonstrate the first X-ray holograms of nano-sized viruses that were not attached to any surface. In the new study, the authors superimposed scattered X-ray light from the virus with scattered X-ray light from a reference nano-sized sphere. The curvature in the superimposed images from the two objects provided depth information and details about the shape of the 450-nanometer-wide virus, the mimivirus. This technique greatly simplified the interpretation of the data. However, their large and expensive setups constitute a huge drawback, which limits their use to only a few X-ray free electron laser facilities in the world.
1.3. Lensless imaging in visible domain
In the 90s, Lensless imaging based on coherent diffraction was initially developed for application in the X-ray and UV spectral ranges because of the difficulty to produce lenses in these wavelength domains. In the beginning of 2000s years we have seen a rapid progress of processing computer clocks and faster graphic processor units. This has allowed to develop digital image processing and made possible to have an-all computed based microscope. After 2010 we have seen the emergence of the technique in the visible range and company have started to exploit the technique for microscopy. The advantage is that this lensless technique is label free and can provide high resolution (sub-micrometer) with a large field of view (FOV) equal to the size of the camera chip (~several mm2).
Lensless microscopy often utilizes an on-chip imaging geometry in which a transparent sample is placed on an image sensor array. This systems are based inexpensive high-resolution CMOS image sensors, combine with the computational power of laptops, tablets, smartphones, and other mobile devices38.
Chapter 1. Introduction
FIG.1. 12. LENSLESS IMAGING SET-UPS. (A) GENERAL LENSLESS IMAGING EXPERIMENTAL SETUP BASED ON IN LINE-HOLOGRAPHY (B) EXAMPLE OF A LARGE FIELD OF VIEW (FOV) AND A RESOLUTION COMPARABLE TO THAT OF HIGH-MAGNIFICATION OBJECTIVE LENSES. (C) LENSLESS IMAGING IMPLEMENTED IN A COMPACT DEVICE (D) LENSLESS IMAGING INCORPORATED INTO A CAMERA PHONE HANDSET. MODIFIED FROM REFERENCE38.
During the last decade, lens-free microscopy has been developed in a variety of systems and found lots of applications39 40 41 42. Most of the applications have been targeting biological
applications. The demand of miniaturization and portability made lensless microscopy attractive. It proposes also to overcome some of the limitations of fluorescence microscopy. Indeed, the resulting image depends on the optical path through the sample rays and allow to retrieve its local complex refractive index. The technique is label-free which opens a large variety of samples compared to fluorescent microscopy.
Although nanometric imaging techniques without 2D lenses are now under control, 3D imaging requires new developments. Digital in-line holography microscopy, Optical coherence tomography, Optical diffractive tomography are few methods that can perform 3D imaging.
For instance, one of the most recent device is created by Nanolive (https://nanolive.ch/). Their image techniques is based on light interference (holography) and for a higher magnification additionally they use an objective (dry objective, magnification x60, NA = 0.8). They had developed an innovative technology that allows living cells to be examined in a three-dimensional space without damaging them. This device extends the exploration of living cells from single cells to cell populations. It enables to investigate macro cellular dynamics like cell health, proliferation, movement and function. At micro level micro organelle dynamics and interactions such as mitochondrial network characterization could be monitored. Several application could be found for
Chapter 1. Introduction
FIG.1. 13. LIVE CELL HOLOGRAPHIC TOMOGRAPHY-BASED ILLUSTRATION OF LIPID DROPLETS IN A) NON-INFECTED AND B) B. BESNOITI-INFECTED BUVEC. ADAPTED FROM REFERENCE46.
In the classic microscopy tools, all dynamic studies of the intracellular content is made with the aid of fluorescent markers. That means that an additional step before imaging is made, the preparation of the sample. In lensless imaging, “virtual” colours can encode the spatial detail of a sample based only on the refractive index of the intracellular structure.
Such a compact and simple technology leads to numerous advantages in the microscopy applications:
- The absence of lenses or additional parts means robustness and ease of use.
- Such a device can handle incubator conditions, while being user-friendly for the experimenter;
- The absence of labels can remove the toxicity induce by these molecules; moreover a longer time of investigation could be proceed.
- The possibility to achieve 3D reconstructions from a simple hologram by numerically retrieving 2D slices.
1.4. Conclusion
In this chapter the most significant points in the microscope evolution were outlined. The importance of microscopy is crucial in the analysis and diagnosis of human diseases. We saw that the progression of these imaging apparatuses was focused on increasing the spatial resolution, which lead to machines based on bulky lenses. The optimization came with the discovery of the fluorescent