HAL Id: hal-01842496
https://hal.archives-ouvertes.fr/hal-01842496
Submitted on 18 Apr 2020HAL is a multi-disciplinary open access archive for the deposit and dissemination of sci-entific research documents, whether they are pub-lished or not. The documents may come from
L’archive ouverte pluridisciplinaire HAL, est destinée au dépôt et à la diffusion de documents scientifiques de niveau recherche, publiés ou non, émanant des établissements d’enseignement et de
Impact of the spatial distribution of high content of
carbon nanotubes on the electrical conductivity of glass
fiber fabrics/epoxy composites fabricated by RTM
technique
Delong He, Diana Salem, Jacques Cinquin, Gérard-Pascal Piau, Jinbo Bai
To cite this version:
Delong He, Diana Salem, Jacques Cinquin, Gérard-Pascal Piau, Jinbo Bai. Impact of the spatial dis-tribution of high content of carbon nanotubes on the electrical conductivity of glass fiber fabrics/epoxy composites fabricated by RTM technique. Composites Science and Technology, Elsevier, 2017, 147, pp.107 - 115. �10.1016/j.compscitech.2017.05.012�. �hal-01842496�
Impact of the spatial distribution of high
content of carbon nanotubes on the electrical
conductivity of glass fiber fabrics/epoxy
composites fabricated by RTM technique
Delong HE1, Diana Salem1, Jacques Cinquin2, Gérard Pascal PIAU2, Jinbo BAI1*
1Laboratoire Mécanique des Sols, Structures et Matériaux (MSSMat), CNRS UMR 8579, Ecole CentraleSupelec, Université Paris Saclay, Grande Voie des Vignes, 92290, Chatenay-Malabry, France
2Airbus Group Innovations, 12 Rue Pasteur, 92152 Suresnes Cedex, FRANCE
* Corresponding author:
Dr. Jinbo Bai, Email: jinbo.bai@centralesupelec.fr. Phone: +33 (0)1 4113 1316; Fax: +33 (0)1 4113 1460;
ABSTRACT
To incorporate high content of carbon nanotubes (CNTs) into a polymer matrix is greatly desired to obtain highly conductive structural composites, but it is difficult in practice to be realized due to increased resin viscosity along with dispersion difficulty. In this study, we demonstrate the production of carbon nanotubes (CNTs)-integrated glass fiber fabrics (GFF)/epoxy composites by resin transfer molding (RTM), in which the mass fraction of CNTs on GFF varies from 0 to as high as 8 wt.%. Three different methods were compared to load CNTs on GFFs, which include one-step in-situ CVD
growth, catalyst pre-deposited two-step CVD growth and CNT suspension casting. For each type of CNTs-GFFs, a series of RTM composites with varied CNT contents were prepared. And the impact of the CNT spatial distribution on the composite in-plane and through-plane electrical conductivities were compared at different CNT loading levels by subtracting contact resistance between the sample and the electrodes. It was found that the composites reinforced with one-step CVD-grown CNTs/GFFs show the best electrical conductivity among the three types of the composites studied, due to good CNT structure and their alignment on GF surface. A detailed discussion was made on the composite conductive behavior with the different CNTs/GFFs. This study helps to provide insight to the production of high-performance structural composites functionalized with high contents of CNTs at low cost.
KEYWORDS: A: Polymer-matrix composites (PMCs); Carbon nanotubes/Glass fibres;
B: Electrical properties; E: Chemical vapor deposition (CVD); Resin transfer molding (RTM)
1. Introduction
Nowadays glass fiber reinforced polymers (GFRPs) are one of the most widely used structural composite materials due to their excellent specific strength and stiffness for non-aerospace application. They are also used for aerospace in some specific parts due to their better impact resistance compared to carbon and the lowest cost of glass fibres [1, 2]. The development of numerous out-of-autoclave techniques promotes furthermore their applications in structural components due to the reduced manufacturing cost. In particular, resin transfer molding (RTM) is increasingly used to fabricate large-sized structural composites like radomes, boats, wind turbine blades, etc. The GFRPs are commonly electrical isolator due to the intrinsic insulating characteristics of glass fibers and polymer resins. Electrically conducting fillers are commonly added to develop conductive GFRPs, which are required for electrostatic dissipation and electromagnetic interference shielding [3-5]. With the increased use of a variety of electronics, the adjustable electrical conductivity is also usually needed to meet different application demands. Therefore, to achieve electrical conductivity-adjustable GFRPs is highly desired to accelerate their wide applications.
The conducting inclusions are commonly added into an insulating polymer matrix to modulate composite electrical conductivity. When the inclusion concentration is beyond a percolation threshold- Pc, a continuous conducting network is formed inside the insulating matrix, which turns the composites from an isolator to a conductor [6]. As compared with traditionally used metallic fillers, carbon fibers and carbon black [7], one
dimensional carbon nanotubes (CNTs) have been demonstrated to possess outstanding reinforcement efficiency both in mechanical, electrical and dielectric properties [8-10]. Their one-dimensional configuration and high aspect-ratio enable CNTs-reinforced polymer composites to percolate at very low CNT concentrations. It has also been reported that the GFRPs can be produced by RTM using resins charged with 0.3 wt. % CNTs, and the obtained composites possess improved mechanical and electrical properties [11, 12].Yet mass fraction of additives higher than 0.5 wt. % deteriorates the ease of RTM manufacturing process, due to significantly increased resin viscosity and CNT filtration phenomena [13]. Indeed, Gojny et al. and Fan et al. have demonstrated that a CNT content of 0.5 wt. % was too viscous to manufacture the CNT/epoxy/glass composite by conventional RTM [12, 14]. Moreover, the increased CNT agglomeration will also result in structure defects in final composites, and thus degrade the composite mechanical properties. Furthermore, the improvement of electrical conductivity of the composites with low CNT contents is not high enough for certain applications such as electromagnetic shielding.
Besides their mass (volume) fraction, the control over CNT alignment favors composite conductivity increase by reducing CNT contact resistance. Indeed, aligned CNT arrays have been proven effective in reinforcing the composite interlaminar shear strength and fracture toughness, by being inserted between two plies of fiber lamina [15-18]. Nevertheless, the application of these composites has not been realized yet due to the difficulty of scaled-up production of the CNT arrays. Instead, CNT orientation
could be controlled on microscopic substrates such as particles and fibers. It has been reported that CNT organization states could be modulated on ceramic particles by varying the CVD conditions such as temperature, carbon sources and catalyst precursor [19-21]. It has also been demonstrated that well-organized CNTs-microparticle hybrid structures possess superior multifunctional reinforcement, compared with randomly mixed CNTs and microparticles [22-25]. Vertically aligned CNTs shell has also been grafted on the surface of continuous fibers, which may significantly increase the conductivity of structural composites [26, 27]. However, the influence of different CVD synthesis methods on the conductivity of the composites produced by RTM has not been well understood.
In this study, we demonstrate the development of electrically conductive GFRP composites with high content of CNTs by RTM, and study the impact of CNT spatial distribution on the composite electrical conductivity. Three different ways, in-situ CVD growth or suspension casting, were compared to incorporate CNTs in GGFs reinforced epoxy composites. The evolution of composite conductivity as a function of CNT mass fraction and distribution was investigated. A detailed discussion about the conduction mechanism of each preparation method is also made in order to give an insight into efficiently manipulating CNTs in industrial composite structure manufacturing via low cost RTM.
The preparation of CNTs-reinforced GFRPs includes the following three steps, as schematically shown in Fig. 1. The first step is the selection of GGFs. In this study, one kind of S2 type GGF with an areal weight of 190 g m-2 was used as reinforcement, and each warp and weft yarn contain 200 filaments of around 9 m in diameter. The second step is to load CNTs on the GGFs. Here, in-situ CVD grafting and suspension casting are investigated comparatively. The last step is the injection of high temperature epoxy resin by RTM process which is then followed by curing.
Figure 1. Overview of the preparation of GFRP composites reinforced by
CNTs-modified glass fiber fabrics
2.1 Preparation of CNTs-GFF hybrids
The in-situ growth of CNTs on GGFs was carried out in a CVD quartz tube with an inner diameter of 100 mm, which was heated by an electrical resistance furnace (CARBOLITE®). A GFF band of 300 mm in length and 50 mm in width was put on a quartz plate support (400 mm in length × 90 mm in width) for CNT synthesis or deposition. Two different methods were used to directly synthesize CNTs on GGFs: (1)
one-step CNT growth by thermally depositing catalyst precursor-ferrocene (denoted as CM1.x) and carbon source, and (2) two-step CVD growth consisting of pre-deposition of iron catalyst particles on GF fabric surface and then CNT growth (denoted as CM2. x). For the comparison, one kind of CNTs-GFFs was also prepared by casting one suspension consisting of CNT in ethanol on the fabric surface (denoted as CM3.x).
2.1.1 Method CM1.x
The one-step CVD procedure is similar to the one that we presented in reference [27]. Briefly, a xylene solution containing 0.1 g ml-1 ferrocene was injected at a speed of 24 ml h-1. The gas flow rates used are as follows: carrier gas argon at 1.2 L min-1, reductive gas hydrogen at 0.3 L min-1 and carbon source acetylene at 0.3 L min-1. The growth of CNTs was done at 600 C. The varied growth times from 15 min to 30 min were used in order to have different CNT weight ratios on GFFs. After synthesis, the furnace was finally cooled down to room temperature under argon protective atmosphere (1 L min-1).
2.1.2 Method CM2.x
The two-step CVD method consists of pre-depositing a catalyst layer on the fabric and then growing CNTs. A solution containing 0.04 mol L-1 Fe(NO3)3 was prepared by dissolving Iron(III) Nitrate Nonahydrate-Fe(NO3)39H2O into a mixture of ethanol and polyethylene glycol (PEG-400) (1 :1). The solution was homogeneously casted on the fabric which was supported on the quartz plate. A calcination of 20 min was conducted at 400°C under air atmosphere inside the quartz tube to remove ethanol solvent and
PEG polymer chains, and to form nanosized Fe2O3 particles. Next, the GFFs with Fe2O3 particles were heated up to 600 °C under argon atmosphere (1.2 L min-1). Hydrogen at a flow rate of 0.3 L min-1 was then injected into the reactor for 10 min, in order to reduce Fe2O3 into iron. After the reduction, the CNT was grown by feeding C2H2 (0.3 L min-1) for varied times. The furnace was finally cooled down to room temperature under argon protective atmosphere (1 L min-1).
2.1.3 Method CM3.x
In this method, the CNTs carpets were first synthesized on the surface of a quartz plate at 800 C, as reported in our work [28]. The xylene solution containing 0.1 g ml-1 ferrocene was injected at a speed of 24 ml h-1. The gas flow rates used were as follows: carrier gas argon 1.2 L min-1, reductive gas hydrogen-H2 0.3 L min-1, and carbon source acetylene C2H2 0.3 L min-1. After 10 min growth, the reactor was cooled down to room temperature, and the CNTs were collected from the plate surface using a stainless blade. The powders were then added into ethanol solution, and dispersed during 2 hours by an ultrasonic bath (HF 45 kHz 100 W). The obtained CNT suspension was spread on the glass fiber fabric, which was naturally dried in air for 24 hours.
2.2 CNTs-GF/epoxy composite preparation
The composite samples were prepared by a RTM method developed at Airbus Group Innovation (AGI). The three kinds of the GFFs after growing or depositing CNTs by the previously mentioned methods were used as reinforcement. Each composite laminate contains 10 plies of the hybrid fabric bands with a length of 300 mm and a
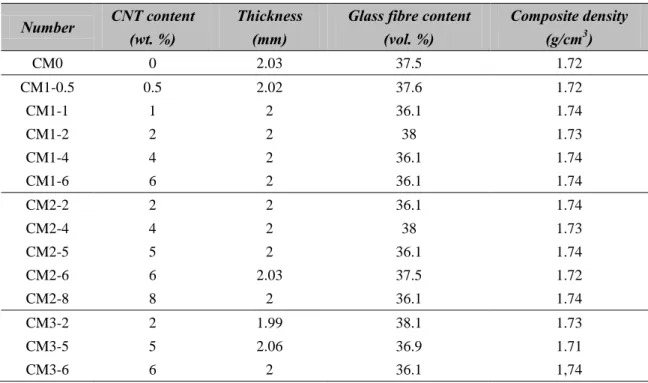
width of 50 mm. A high performance epoxy resin RTM6 from Hexcel was used as polymer matrix. Before the injection, a procedure of degasing of the resin was carried out for 30 minutes at 80 °C under vacuum. The curing was conducted according to the procedure developed by AGI, that is, 30 min at 135°C and 120 min at 180 °C. The heating and cooling rates used were 2 °C min-1. Table 1 presents the composite laminates containing varied CNT mass fractions.
Table 1 Composite laminates manufactured with S2 GFFs with CNTs
Number CNT content (wt. %)
Thickness (mm)
Glass fibre content (vol. %) Composite density (g/cm3) CM0 0 2.03 37.5 1.72 CM1-0.5 0.5 2.02 37.6 1.72 CM1-1 1 2 36.1 1.74 CM1-2 2 2 38 1.73 CM1-4 4 2 36.1 1.74 CM1-6 6 2 36.1 1.74 CM2-2 2 2 36.1 1.74 CM2-4 4 2 38 1.73 CM2-5 5 2 36.1 1.74 CM2-6 6 2.03 37.5 1.72 CM2-8 8 2 36.1 1.74 CM3-2 2 1.99 38.1 1.73 CM3-5 5 2.06 36.9 1.71 CM3-6 6 2 36.1 1,74
2.3 Electrical conductivity measurement
The electrical conductivity measurement in in-plane and through-plane directions was conducted using the four-wire methodology by a multimeter Agilent 34 420A, as schematically shown in Fig. 2. This connection helps to eliminate the electrical resistance of the wires. Two wires were used to introduce a direct current of 10 mA in the circuit, and the other two are used to measure the tension. According to the Ohm's
law, the circuit resistance Rmeasured can be obtained by Rmeasured = U/I. The real resistance of the composite sample Rcomposite can be got by subtracting from Rmeasured the two contact resistances R contact between the sample and the electrodes.
Rcomposite = Rmeasured - 2 Rcontact (1) Thus, we can have the electrical resistivity ρ of the composite by
ρ = Rcomposite•S/L, (2) where S is the section of the sample (m²), and L is the length of the sample (m). The electrical conductivity (S/m) is the inverse of the electrical resistivity σ= 1/ρ.
(a) (b) (c) 400 800 1200 1600 2000 2400 4 8 12 R2=0.9964 Resistance measured Linear Fit of Rx R x ( O h m ) L/S (1/m) Conductivity x= 190.5 S/m Rcontact= 0.5
Figure 2. (a) Schematic of in-plane electrical conductivity x measurement using a 4-wire method, (b) Schematic of the x measurement in different span lengths between
two electrodes, and (c) Rx-L/S curve obtained with the CM1-6 composite sample as an example.
The resistance measurement in X or Y direction has been conducted with different lengths on each sample as presented in Fig. 2a. This method allows eliminating the contact resistance and obtaining the real resistance of the composites. A graph of the measured resistance (Rx) versus Length /Section (L/S) was plotted in Fig. 2b, in which the inverse of the slope gives directly the conductivity of the composite sample measured (from equation 2) and the intersection of the linear regression with the Y axis gives the contact resistance at the points we measure the resistance on the sample. For example, the resistance of the composite CM1-6 has been measured at 6 different lengths which are varied from 15 to 65 mm, with a width 15 mm and a thickness of 1.9 mm. The current used was 10 mA. The obtained Rx-L/S curve is shown in Fig. 2c. From this curve, it can be found that the sample conductivity is as high as 190.4 S m-1.
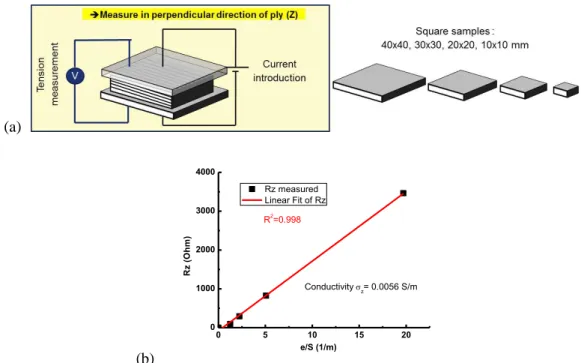
For the measurement of conductivity in the Z direction (z), the sample configuration was shown in Fig. 3a. The sample size was varied from 10 10 mm2 to 20 20 mm2, 30 30 mm2 and 40 40 mm2. We have plotted the evolution of the measured resistance (Rz) versus the sample thickness/ sample section (e/S), as demonstrated in Fig. 3b. The inverse of the slop also gives the Z direction electrical conductivity (z) of the sample. But in this configuration the extrapolation of the linear regression of the experimental points should pass through the point (0, 0) because the
thickness of the sample is constant and if we want e/S = 0 we will have an infinite sample section and then a measured resistance of 0. Thus, the point (0, 0) is not a measured point but a point added on the graph.
(a) (b) 0 5 10 15 20 0 1000 2000 3000 4000 Conductivity z= 0.0056 S/m R2=0.998 R z (O h m ) e/S (1/m) Rz measured Linear Fit of Rz
Figure 3. (a) Schematic of the measurement in through-plane direction with different
surface areas, and the dimensions may vary from sample to sample; (b) Rz-e/S curve obtained with the CM2-2 composite samples as an example.
2.4 Characterizations
Thermo-gravimetric analysis (TGA, NETZSCH STA 449 F3) was carried out in order to evaluate the mass fraction of CNTs grafted or deposited on GFFs. The chopped CNTs-GFFs were put into a Pt-Rh crucible, which was heated from 30 to 900 ºC at a rate of 10 ºC min-1 under an atmosphere of oxygen and nitrogen. The gas flow rate used was 20 mL min-1 for each of them. Scanning electron microscopy (SEM, LEO 1530
Gemini) was used to characterize CNTs and CNTs-GFF morphology, as well as the microstructure of the composites. For the composite samples, the fracture cross-sections were coated by a thin layer of gold in order to increase samples’ electron conductivity. Raman spectroscopy (Jobin Yvon) was also employed to investigate the graphitization degree of CNTs prepared by different methods.
3. Results and discussion
3.1 CNTs-GFF hybrids prepared by different methods
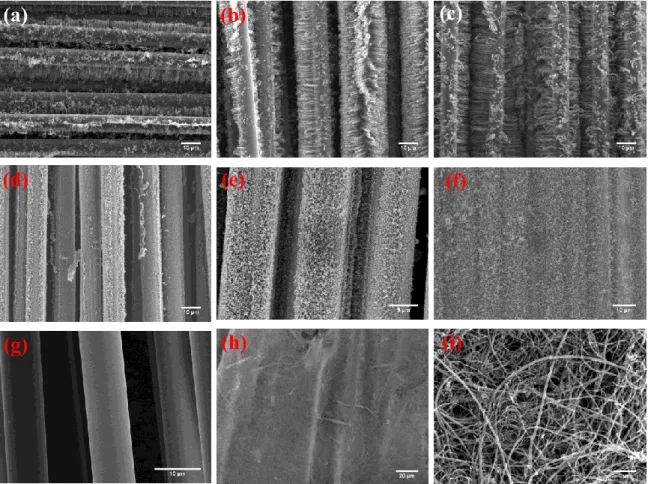
Figure 4 shows the SEM images of the CNTs-GFF hybrids prepared by the three different methods. It can be seen that the nanotube distribution and organization states on GFF vary as the preparation method. For the CNTs-GFF hybrids prepared by in-situ CVD growth (one-step and two-step methods), CNTs are aligned nearly vertically on the fiber surface. In both cases, the nanotube follows a bottom-up growth model [29, 30] that is the nucleation and growth of carbon nanotube took place at the surface of the fiber, even though two different catalyst particle formation ways are used. In the one-step CVD process, the iron catalyst nanoparticles were in-situ formed from thermal decomposition of ferrocene. In the two-step CVD process, iron particles are pre-formed from iron nitride oxidation and reduction. The root of each nanotube is connected with glass fiber through one catalyst particle, which partially diffuse in the fiber surface layer.
Figure 4. SEM images of the glass fiber fabrics containing CNTs of varied mass
fractions. (a)-(c) fabrics with CNTs grafted by one-step CVD, and CNT mass fraction of 2 wt.%, 4 wt.% and 6 wt.%, respectively; (d)-(f) fabrics with CNTs grafted by two-step CVD, and CNT mass fraction of 2 wt.%, 4 wt.% and 6 wt.%, respectively; (g) fabrics before CNTs deposition and (h)-(i) fabrics with 2 wt.% CNTs deposited by solution way.
On the other hand, the CNT distribution or organization state is quite different in two cases. In the one-step CVD process, the selective nucleation of catalyst particles on certain zones of GFF surface results in a non-homogeneous distribution of nanotubes on
(a)
(b)
(c)
(d)
(e)
(f)
glass fiber. This is mainly due to the multiple chemical compositions of glass fiber which include SiO2, Al2O3, MgO, Li2O and Na2O [31]. These chemical species shows varied catalytic activity in iron particle nucleation and CNT growth. In the two-step CVD process, as the catalyst particles are pre-deposited, the fiber surface chemistry shows small influence on the iron nanoparticle distribution during the iron nitride nucleation and oxidation, as well as the reduction of iron oxides. Thus the growth of CNTs is relatively homogenous, as compared to the previous condition. In contrast, the deposition of CNT suspension (the third method) generates entangled CNT films on the upper surface of the glass fabric, instead of surrounding each fiber. Moreover, the homogeneity of CNTs is poor on the whole fabric surface. That is, there are more CNTs at some places, but fewer at the others. This is mainly due to the difficulty of CNT dispersion and their instability in an organic solvent like ethanol when no dispersant is used.
The weight ratios of CNTs growing on GFFs were characterized by TGA for the CVD-grown CNTs-GFF hybrids. As shown in Fig. 5, the CNT weight ratio on glass fiber can be tailored by varying the CVD condition like growth time. For example, the CNT ratio varies from ~ 0.6 % to 8 % with the increase of CNT growth time. Certainly, higher CNT ratios can also be grown by using longer growth times. Similarly, the deposited CNT quantity can also be controlled by modulating deposition parameters such as suspension concentration and deposition time. In this study, the composite
laminates were prepared with GFFs containing CNT mass fraction varying from 0 to 8 %. 96 100 200 400 600 800 92 96 100 M a s s ( % ) virgin fiber CM1-0.5 CM1-1 CM1-2 CM1-4 CM1-6 M a s s ( % ) Temperature (o C) Virgin fiber CM2-2 CM2-4 CM2-5 CM2-6 CM2-8
Figure 5. TGA curves of the CNTs-GFF hybrids with varied CNT mass fractions: (a)
CM1-x hybrids synthesized by the one-step CVD process, and (b) CM2-x hybrids synthesized by the two-step CVD process.
3.2 In-plane electrical conductivity of composite laminates.
For each type of composites at a specific CNT content, the in-plane electrical conductivity,σx, was obtained from the inverse of the slope of the fitted line of the Rx vs L/S curve. The resistances were measured with different sample lengths. And the obtained conductivity value reflects more exactly the electrical conducting property of the composites. As shown in Fig. 6a-c, the measured resistances decrease with the increase of CNT content loaded on GFFs for all the three kinds of composites CM1, CM2 and CM3. This is consistent with the general rule which have been also observed
(a)
inside the composites, and high content of CNTs generates the increased electrical conduction pathways, thus the reduced resistance. The electrical conductivities of the three kinds of composites were separately measured as a function of CNT mass fraction. A comparison graph was illustrated in Fig. 6d. It can be seen that the conductivity increase rate is quite different. The CM1 composites with the one-step CVD-grown CNTs show a high increase rate with CNT mass. In contrast, the CM3 composites with CNTs-deposited GFFs have the lowest increase rate with CNT mass fraction. Similarly, at each CNT mass fraction, the order of the electrical conductivity of the composites is CM1 > CM2 > CM3. These results indicate that the GFFs with CNTs grown by one-step CVD have the best enhancing performance in terms of in-plane conductivity.
1000 10000 1 10 100 1000 10000 CM1-0.5 Fit CM1-1 Fit CM1-2 Fit CM1-4 Fit CM1-6 Fit Rx ( O h m ) L/S (1/m) 1000 10000 10 100 1000 CM2-2 Fit CM2-4 Fit CM2-5 Fit CM2-6 Fit CM2-8 Fit R x ( O h m ) L/S (1/m) 1000 10000 10 100 1000 10000 100000 CM3-2 Fit CM3-5 Fit CM3-6 Fit R x ( O h m ) L/S (1/m) 0 2 4 6 8 0 50 100 150 200 CM 1 CM 2 CM 3 E le c tr ic a l c o n d u c ti v it y ( S /m ) CNT mass fraction (%)
Figure 6. In-plane resistance Rx-L/S curves (logarithmic scale for both the x-axis and the y-axis) of the composites CM1 (a), CM2 (b) and CM3 (c) with different CNT
(a)
(b)
contents. (d) Evolution of in-plane electrical conductivity of the composites versus CNT content on GFFs.
3.3 Through-plane Electrical conductivity of composite laminates.
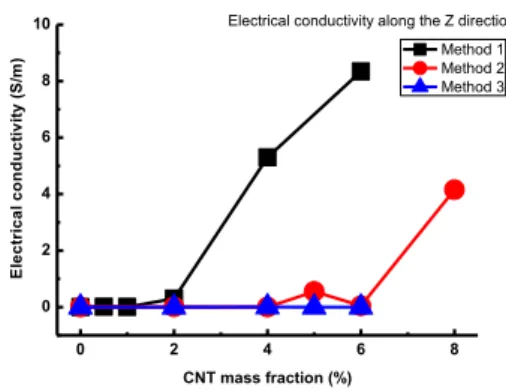
The similar procedure was used to measure the through-plane electrical conductivity z of the three types of the composites with varied CNT mass fractions. A comparison graph is given in Fig. 7. Similarly, the composites reinforced by fabric with CNTs grown by one-step CVD show the best z among the three types of composites. That is, the conductivity z rapidly increases as a function of CNT mass fraction, and shows the highest conductivity value at the same CNT mass fraction. With 6 wt. % of CNTs, the Z direction electrical conductivity z reaches up to about 8 S/m. In contrast, the composites CM3 with suspension-deposited CNTs show the lowest the conductive performance. A little increase in the z was observed even the CNT content up to 6 %. For the composites CM2, an evident increase of z of the composites was only observed at 8 % CNT content. This result is consistent with the one obtained in the in-plane electrical conductivity. 0 2 4 6 8 0 2 4 6 8
10 Electrical conductivity along the Z direction
E le c tr ic a l c o n d u c ti v it y ( S /m ) CNT mass fraction (%) Method 1 Method 2 Method 3
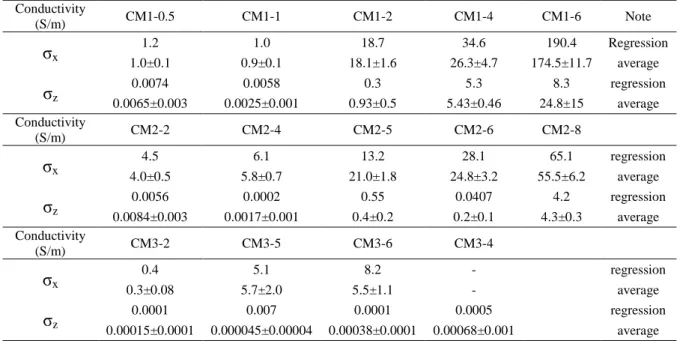
The in-plane and through-plane electrical conductivities (σx and σz) of the three kinds of composites are summarized in Table 2. And both the regression fitting and average values are listed there. The results demonstrate a significant influence of the CNT incorporation process on the composite electrical conductivity. The most efficient process is the growth of CNTs on the surface of the glass fabric by the one-step CVD process. And the least efficient one is that of the solution deposition of CNT on the surface of the glass fiber fabric.
Table 2. Summary of the in-plane and through-plane electrical conductivities (σx and σz)
of the three kinds of composites, including regression fitting and average values
Conductivity (S/m) CM1-0.5 CM1-1 CM1-2 CM1-4 CM1-6 Note σx 1.2 1.0 18.7 34.6 190.4 Regression 1.0±0.1 0.9±0.1 18.1±1.6 26.3±4.7 174.5±11.7 average σz 0.0074 0.0058 0.3 5.3 8.3 regression 0.0065±0.003 0.0025±0.001 0.93±0.5 5.43±0.46 24.8±15 average Conductivity (S/m) CM2-2 CM2-4 CM2-5 CM2-6 CM2-8 σx 4.5 6.1 13.2 28.1 65.1 regression 4.0±0.5 5.8±0.7 21.0±1.8 24.8±3.2 55.5±6.2 average σz 0.0056 0.0002 0.55 0.0407 4.2 regression 0.0084±0.003 0.0017±0.001 0.4±0.2 0.2±0.1 4.3±0.3 average Conductivity (S/m) CM3-2 CM3-5 CM3-6 CM3-4 σx 0.4 5.1 8.2 - regression 0.3±0.08 5.7±2.0 5.5±1.1 - average σz 0.0001 0.007 0.0001 0.0005 regression 0.00015±0.0001 0.000045±0.00004 0.00038±0.0001 0.00068±0.001 average 3.4 Discussion
The different electrical conductivities have been observed in the three composites. The understanding of the reason is useful to guide materials selection in future composite fabrication and application.
It is well-known that both the virgin glass fiber and epoxy resin are good electrical isolators. The addition of CNTs makes the composites electrically conductive. For the CNTs-reinforced composites, it has also been well reported that their electrical conductivity highly depends on their mass fraction and distribution inside the polymer matrix. In order to make the composite more electrically conductive, CNT mass fraction must be superior to the percolation point, which varies with polymer matrix properties, CNT nature and configuration in the matrix. Thus, the percolation value could be quite different even for the same composites prepared with the same CNTs and matrix, due to different preparation ways. When the CNT mass fraction is higher than the percolation value, a continuous conductive network will be achieved. Correspondingly, the composite conductivity shows a sharp increase with the CNT content around the percolation zone. However, it is also well known that, the electrical contact resistance of two CNTs is very high, around several M in order of magnitude [32]. Therefore, the reduced number of contacts favors low CNT contact resistance and high electrical conductivity. Meanwhile, the alignment of CNTs is also desired to reduce CNT contact numbers in the composites. However, the commonly used CNTs are in the form of powder with entangled nanotubes. Their inert chemical properties make them highly difficult to be dispersed in commonly used chemical solvents like water and ethanol. Thus, a homogenous dispersion of CNTs on GFFs is very hard to achieve. This is also the reason why the composites with fabric containing CNTs deposited with their suspension show the worst conductivity as demonstrated earlier. On the other hand, the
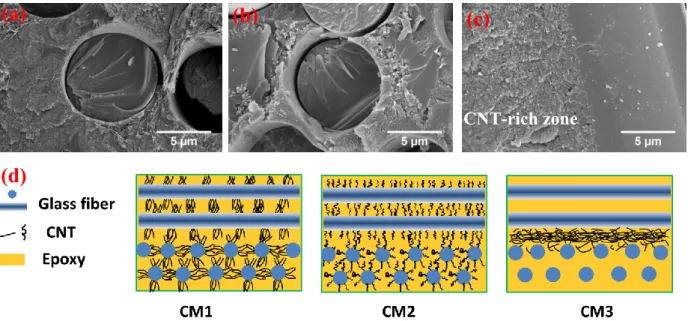
in-situ growth of CNTs by CVD allows obtaining aligned-CNTs on the surface of each fiber, instead of only on the fabric surface. Therefore, a conductive network with reduced contact resistance can be formed. This is proven by the microstructures of the composites, as shown in Fig. 8. For the CM1 and CM2 composites, CNTs align around each GF, and a conducting network is formed both in the ply and interply zones, resulting in their superior electrical conductivity. In contrast, for the CM3 composites, the majority of CNTs are localized in the interply zones between two neighboring GF fabrics. And a few of them is brought inside the GF fabric-containing layer during the CNT deposition and the resin injection. Thus, the formation of conducting network in the through-plane direction is difficult, which leads to their poor electrical conductivity.
Figure 8. SEM images of the microstructures of the composites CM1-6 (a), CM2-6 (b)
and CM3-6 (c), as well as the schematic of CNT distribution in each kind of the composites (d).
(a)
(b)
(c)
(d)
As for the two types of CVD-grown nanotubes fabrics reinforced composites CM1 and CM2, their conductivity difference is mainly due to the varied nanotube quality obtained under the two conditions used. The one-step CVD-grown CNTs has better crystallographic structure than those formed by the two-step method. The latter contains certain amount of amorphous carbon, which was formed during CNT growth. The comparison of Raman spectra is demonstrated in Fig. 9a. Two characteristic peaks, D-band and G-band, are clearly visible at ~1330 cm-1 and ~1590 cm-1, which are attributed to disorder and graphite-like structures of CNTs [33], respectively. The relative intensity ratio IG/ID can evidently reflect the graphitization rate of CNTs. It can be seen that the CNTs synthesized by the two-step CVD method have the smallest intensity ratio IG/ID among the three cases studied. The poorer crystallographic structures will thus cause poor electrical conductivity of CM2 CNTs, which in turn will interrupt electron conduction pathways. Thus, the CM2 composites demonstrated low electrical conductivity both in in-plane and through-plane directions. As for the CM3 composites, the CNTs were synthesized at a higher growth temperature (800 C) on quartz plate, and they have much higher crystallinity than the nanotubes used in the CM1 and CM2 composites. Nevertheless, the CM3 composites still show the worst conductivity among the three kinds of composites studied. This is mainly due to the confined CNT distribution in the interlaminar zones. Concerning the influence of CVD temperature on the glass fiber mechanical properties, we have done detailed research work [27]. By conducting a number of single fiber and composite laminate mechanical
property tests, such as single fiber tensile test, single fiber fragmentation test and flexural property measurement, it was found that the GF mechanical properties were not degraded after the growth of CNTs under the CVD conditions used in this work.
Moreover, a comparative study has also been made between the electrical conductivities of the CM1 composites and some data published in literature. The compared composites include MWCNTs (aligned or random)/Epoxy, MWCNTs-Alumina fiber/Epoxy and MWCNTs-glass fiber/Epoxy composites. As shown in Figure 9b, the combining strategy of the one-step CNT growth on GFs and the RTM technique that we used in this study allows obtaining highly conductive structural composites. The advantage is particularly obvious when the CNT loading level is high. This is very promising to the industrial development of high performance CNTs-reinforcement GFRPs. 1000 1200 1400 1600 IG/ID=1.42 IG/ID=0.79 In te n s it y ( a .u .) Raman shift (cm-1) CNTs-GF CM1-2 CNTs-GF CM2-2 CNTs CM3 IG/ID=0.98 2 4 6 8 10 12 14 0 100 200
300 MWCNT-Epoxy from Bauhofer & Kovacs
aligned MWCNT-Epoxy from Cebeci et al. MWCNT-GF/Epoxy from Wichmann et al. long MWCNT-Alumina fiber /Epoxy from Garcia et al. MWCNT-GF /Epoxy CM1 in this work
E le c tr ic a l C o n d u c ti v it y (S /m )
MWCNT weight fraction in epoxy (%)
Figure 9. (a) Raman spectrum comparison of the three types of CNTs studied: one-step
CVD-grown CNTs (CM1-2), two-step CVD-grown CNTs (CM2-2) and CVD carpet (CM3). (b) Comparison of the electrical conductivities of CM1 composites with some data reported in literature about the composites of MWCNTs-Epoxy [17, 34],
MWCNTs-Alumina fiber/Epoxy [35] and MWCNTs-glass fiber/Epoxy composites [11].
4 Conclusions
In summary, we produced the CNTs-GFF hybrids by integrating CNTs on GFF surface via three different methods, which are one-step in-situ CVD growth, catalyst pre-deposited two-step CVD growth and CNT-ethanol suspension casting. It was demonstrated that the CNT loading could be controlled by varying the CVD growth parameters, or the CNT-suspension casting conditions. The high-quality electrically conductive GFF/Epoxy composites containing high CNT contents are fabricated by RTM methods, demonstrating that no conventional limitation caused by resin viscosity increase is present in spite of high mass fraction of CNTs (> 6 %) used. We further compared the in-plane and through-plane electrical conductivity of the composites with different CNTs-GFF hybrids, as well as their variation with CNT contents. It was found that the composites with the one-step CVD-grown CNTs-GFF show the best electrical conductivity among the three types of the composites at a given CNT content. The detailed microstructure characterization indicated that the high electrical conductivity is mainly due to the good CNT structure and their alignment on GFF surface realized during the in-situ one-step CVD process. The cost-efficient CNTs-GFF production process along with low cost RTM manufacturing and excellent composite electrical conductivity might promote wide application of carbon nanomaterials-functionalized structural composites in the fields of aerospace, new energy, automotive, etc.
ACKNOWLEDGMENT
This work was conducted under the project ANR-12-ASTR-0022 which was financially supported by French ANR (Agence nationale de la recherché). The authors acknowledge Mrs. P. GEMEINER for Raman spectroscopy characterization.
REFERENCES
[1] P. K. Mallick, Fiber-reinforced composites: materials, manufacturing and design,
Second Edition: Taylor & Francis, 1993.
[2] B. Harris, ENGINEERING COMPOSITE MATERIALS, London: The Institute of Materials, 1999.
[3] S.-L. Gao, R.-C. Zhuang, J. Zhang, J.-W. Liu, and E. Mäder, Glass fibers with carbon nanotube networks as multifunctional sensors, Adv. Funct. Mater. 20 (2010) 1885-1893.
[4] R. F. Gibson, A review of recent research on mechanics of multifunctional composite materials and structures, Compos. Struct. 92(2010) 2793-2810.
[5] A.D.B.L. Ferreira, P. R. O. Nóvoa, A.T. Marques, Multifunctional material systems: A state-of-the-art review, Compos. Struct. 151(2016) 3-35.
[6] J. Macutkevic, P. Kuzhir, A. Paddubskaya, S. Maksimenko, J. Banys, A. Celzard, V. Fierro, S. Bistarelli, A. Cataldo, F. Micciulla,S. Bellucci, Electrical transport in carbon black-epoxy resin composites at different temperatures, J. Appl. Phys. 114(2013) 033707-8.
[7] A. Markov, B. Fiedler, K. Schulte, Electrical conductivity of carbon black/fibres filled glass-fibre-reinforced thermoplastic composites, Compos. Part A 37 (2006) 1390-1395.
[8] M.F.L.D. Volder, S. H. Tawfick, R. H. Baughman, and A. J. Hart, Carbon nanotubes: present and future commercial applications, Science 339 (2013) 535-539.
[9] S.-H. Yao, Z.-M. Dang, H.-P. Xu, M.-J. Jiang, J. Bai, Exploration of dielectric constant dependence on evolution of microstructure in nanotube/ferroelectric polymer nanocomposites, Appl. Phys. Lett. 92 (2008) 082902.
[10]Z.-M. Dang, L. Wang, Y. Yin, Q. Zhang, Q.-Q. Lei, Giant dielectric permittivities in functionalized carbon-nanotube/electroactive-polymer nanocomposites, Adv.
Mater. (19) 2007, 852-857.
[11] M.H.G. Wichmann, J. Sumfleth, F. H. Gojny, M. Quaresimin, B. Fiedler, K. Schulte, Glass-fibre-reinforced composites with enhanced mechanical and electrical properties – Benefits and limitations of a nanoparticle modified matrix, Eng. Fract.
Mech. 73(2006) 2346-2359.
[12] F. H. Gojny, M. H. G. Wichmann, B. Fiedler, W. Bauhofer, K. Schulte, Influence of nano-modification on the mechanical and electrical properties of conventional
fibre-reinforced composites, Compos. Part A 36(2005) 1525-1535.
[13] E. F. Reia da Costa, A. A. Skordos, I. K. Partridge, A. Rezai, RTM processing and electrical performance of carbon nanotube modified epoxy/fibre composites,
Compos. Part A 43 (2012) 593-602.
[14] Z. Fan, M. H. Santare, S.G. Advani, Interlaminar shear strength of glass fiber reinforced epoxy composites enhanced with multi-walled carbon nanotubes,
Compos. Part A 39(2008) 540-554.
[15] J. L. Abot, Y. Song, M. J. Schulz, V. N. Shanov, Novel carbon nanotube array-reinforced laminated composite materials with higher interlaminar elastic properties, Compos. Sci. Technol. 68(2008) 2755-2760.
[16] J. L. Abot, Y. Song, On the mechanical response of carbon nanotube array laminated composite materials, J. Reinf. Plast. Compos. 29(2010)3401-3410. [17] H. Cebeci, R. G. d. Villoria, A. J. Hart, B. L. Wardle, Multifunctional properties of
high volume fraction aligned carbon nanotube polymer composites with controlled morphology, Compos. Sci. Technol. 69 (2009)2649–2656.
[18] H. Bhanushali, P. D. Bradford, Woven Glass Fiber Composites with Aligned Carbon Nanotube Sheet Interlayers, J. Nanomaterials, 2016 (2016) 9705257-9 [19] D. He, J. Bai, Acetylene-Enhanced Growth of Carbon Nanotubes on Ceramic
Microparticles for Multi-Scale Hybrid Structures, Chem. Vap. Deposition 17(2011) 98-106.
[20] D. He, M. Bozlar, M. Genestoux, J. Bai, Diameter-and length-dependent self-organizations of multi-walled carbon nanotubes on spherical alumina microparticles, Carbon 48(2010) 1159-1170.
[21] D. He, H. Li, W. Li, P. Haghi-Ashtiani, P. Lejay, J. Bai, Growth of carbon nanotubes in six orthogonal directions on spherical alumina microparticles, Carbon 49(2011) 2273-2286.
[22] M. Bozlar, D. He, J. Bai, Y. Chalopin, N. Mingo, S. Volz, Carbon nanotube microarchitectures for enhanced thermal conduction at ultralow mass fraction in polymer composites, Adv. Mater. 22(2010) 1654–1658.
[23] W. Li, D. He, J. Bai, The influence of nano/micro hybrid structure on the mechanical and self-sensing properties of carbon nanotube-microparticle reinforced epoxy matrix composite, Compos. Part A 54(2013) 28-36.
[24] H. Zhao, M.-H. Yang, D. He, J. Bai, Enhanced dielectric performance of polyvinylidene fluoride composites with an all-carbon hybrid architecture: vertically aligned carbon nanotube arrays on graphite nanoplatelets, J. Mater. Chem.
C 4(2016) 8911-8919.
[25] L. Ci, J. Bai, Novel micro/nanoscale hybrid reinforcement: multiwalled carbon nanotubes on SiC particles, Adv. Mater. 16(2004) 2021-2024.
[26] V. P. Veedu, A. Cao, X. Li, K. Ma, C. Soldano, S. Kar, P.M. Ajayan, M.N. Ghasemi-Nejhad, Multifunctional composites using reinforced laminae with carbon-nanotube forests, Nat. Mater. 5(2006) 457-462.
nanotube length on glass fibers, ACS Appl. Mater. Interfaces 9 (2017) 2948–2958 [28] H. Li, D. He, T. Li, M. Genestoux, J. Bai, Chemical kinetics of catalytic chemical
vapor deposition of an acetylene/xylene mixture for improved carbon nanotube production, Carbon 48(2010) 4330-4342.
[29] X. Li, A. Cao, Y. J. Jung, R. Vajtai, and P. M. Ajayan, Bottom-up growth of carbon nanotube multilayers: unprecedented growth, Nano Lett. 5(2005) 1997-2000. [30] M. Pinault, V. Pichot, H. Khodja, P. Launois, C. Reynaud, M. Mayne-L'Hermite,
Evidence of sequential lift in growth of aligned multiwalled carbon nanotube multilayers, Nano Lett.5(2005) 2394-2398.
[31] M.L. Korwin-Edson, D. A. Hofmann, P. B. McGinnis, Strength of high performance glass reinforcement fiber, Int. J. Appl. Glass Sci. 3(2012)107–121. [32] A. Buldum and J. P. Lu, Contact resistance between carbon nanotubes, Phys. Rev. B
63(2001) 161403.
[33] H. Murphy, P. Papakonstantinou, T. I. T. Okpalugo, Raman study of multiwalled carbon nanotubes functionalized with oxygen groups, J. Vac. Sci. Technol. B 24(2006) 715-720.
[34]W. Bauhofer, J. Z. Kovacs, A review and analysis of electrical percolation in carbon nanotube polymer composites, Compos. Sci. Technol. 69 (2009)1486–1498.
[35]E. J. Garcia, B. L. Wardle, A. J. Hart, N. Yamamoto, Fabrication and multifunctional properties of a hybrid laminate with aligned carbon nanotubes grown In Situ, Compos. Sci. Technol. 68 (2008) 2034–2041
Figure Captions
Figure 1. Overview of the preparation of GFRP composites reinforced by
CNTs-modified glass fiber fabrics
Figure 2. (a) Schematic of in-plane electrical conductivity x measurement using a 4-wire method, (b) Schematic of the x measurement in different span lengths between two electrodes, and (c) Rx-L/S curve obtained with the CM1-6 composite sample as an example.
Figure 3. (a) Schematic of the measurement in through-plane direction with different
surface areas, and the dimensions may vary from sample to sample; (b) Rz-e/S curve obtained with the CM2-2 composite samples as an example.
Figure 4. SEM images of the glass fiber fabrics containing CNTs of varied mass
fractions. (a)-(c) fabrics with CNTs grafted by one-step CVD, and CNT mass fraction of 2 wt.%, 4 wt.% and 6 wt.%, respectively; (d)-(f) fabrics with CNTs grafted by two-step CVD, and CNT mass fraction of 2 wt.%, 4 wt.% and 6 wt.%, respectively; (g) fabrics before CNTs deposition and (h)-(i) fabrics with 2 wt.% CNTs deposited by solution way.
Figure 5. TGA curves of the CNTs-GFF hybrids with varied CNT mass fractions: (a)
CM1-x hybrids synthesized by the one-step CVD process, and (b) CM2-x hybrids synthesized by the two-step CVD process.
Figure 6. In-plane resistance Rx-L/S curves (logarithmic scale for both the x-axis and the y-axis) of the composites CM1 (a), CM2 (b) and CM3 (c) with different CNT
contents. (d) Evolution of in-plane electrical conductivity of the composites versus CNT content on GFFs.
Figure 7. Evolution of the through-plane electrical conductivity of the composites as a
function of the CNT content on the glass fabrics
Figure 8. SEM images of the microstructures of the composites CM1-6 (a), CM2-6 (b)
and CM3-6 (c), as well as the schematic of CNT distribution in each kind of the composites (d).
Figure 9. (a) Raman spectrum comparison of the three types of CNTs studied: one-step
CVD-grown CNTs (CM1-2), two-step CVD-grown CNTs (CM2-2) and CVD carpet (CM3). (b) Comparison of the electrical conductivities of CM1 composites with some data reported in literature about the composites of MWCNTs-Epoxy [17, 34], MWCNTs-Alumina fiber/Epoxy [35] and MWCNTs-glass fiber/Epoxy composites [11].
Table Caption
Table 1. Composite laminates manufactured with S2 GFFs with CNTs
Table 2. Summary of the in-plane and through-plane electrical conductivities (σx and σz) of the three kinds of composites, including regression fitting and average values