HAL Id: inserm-02438309
https://www.hal.inserm.fr/inserm-02438309
Submitted on 14 Jan 2020
HAL is a multi-disciplinary open access
archive for the deposit and dissemination of
sci-entific research documents, whether they are
pub-lished or not. The documents may come from
teaching and research institutions in France or
abroad, or from public or private research centers.
L’archive ouverte pluridisciplinaire HAL, est
destinée au dépôt et à la diffusion de documents
scientifiques de niveau recherche, publiés ou non,
émanant des établissements d’enseignement et de
recherche français ou étrangers, des laboratoires
publics ou privés.
differentiation in the embryonic pancreas
Léon van Gurp, Mauro Muraro, Tim Dielen, Lina Seneby, Gitanjali
Dharmadhikari, Gérard Gradwohl, Alexander van Oudenaarden, Eelco de
Koning
To cite this version:
Léon van Gurp, Mauro Muraro, Tim Dielen, Lina Seneby, Gitanjali Dharmadhikari, et al.. A
transcrip-tomic roadmap to α- and β-cell differentiation in the embryonic pancreas. Development (Cambridge,
England), Company of Biologists, 2019, 146 (12), pp.dev173716. �10.1242/dev.173716�.
�inserm-02438309�
TECHNIQUES AND RESOURCES RESEARCH ARTICLE
A transcriptomic roadmap to
α- and β-cell differentiation in the
embryonic pancreas
Léon van Gurp1,*, Mauro J. Muraro1,2,*, Tim Dielen1, Lina Seneby1, Gitanjali Dharmadhikari1,
Gerard Gradwohl3, Alexander van Oudenaarden1,2,4and Eelco J. P. de Koning1,5,‡
ABSTRACT
During pancreatic development, endocrine cells appear from the pancreatic epithelium when Neurog3-positive cells delaminate and differentiate into α-, β-, γ- and δ-cells. The mechanisms involved in this process are still incompletely understood. We characterized the temporal, lineage-specific developmental programs during pancreatic development by sequencing the transcriptome of thousands of individual pancreatic cells from E12.5 to E18.5 in mice, and identified all known cell types that are present in the embryonic pancreas, but focused specifically on α- and β-cell differentiation by enrichment of a MIP-GFP reporter. We characterized transcriptomic heterogeneity in the tip domain based on proliferation, and characterized two endocrine precursor clusters marked by expression of Neurog3 and Fev. Pseudotime analysis revealed specific branches for developing α- and β-cells, which allowed identification of specific gene regulation patterns. These include some known and many previously unreported genes that appear to define pancreatic cell fate transitions. This resource allows dynamic profiling of embryonic pancreas development at single cell resolution and reveals novel gene signatures during pancreatic differentiation intoα- and β-cells.
KEY WORDS: Single cell transcriptome sequencing, Pancreas development, Alpha cells, Beta cells, Neurog3, Endocrine progenitors
INTRODUCTION
Mouse pancreatic development is characterized by two main differentiation phases: the primary and secondary transition. The secondary transition, which is characterized by segregation of the pancreatic epithelium into ductal tip and trunk domains, takes place between approximately embryonic age (E) 12.5 and E15.5 (Zhou et al., 2007; Pan et al., 2013), and gives rise to the pancreatic cell types as they appear in the adult organism. The tip domain contains a population of multi-potent progenitors, expressing markers such as Ptf1a, Hnf1b and Pdx1, which contribute to all adult pancreatic cell types (Larsen et al., 2017; Pan and Wright, 2011). In the trunk
domain, lateral inhibition by Notch signals such as Hes1 determines which cells will differentiate into mature ductal cells or endocrine cells (Magenheim et al., 2011; Shih et al., 2012; Kim et al., 2015). Endocrine differentiation is marked by the appearance of neurogenin 3 (Neurog3), a key transcription factor during this process (Gu et al., 2002). After expression of Neurog3, endocrine progenitors delaminate from the ductal lining to form the islets of Langerhans in the mesenchyme surrounding the pancreatic epithelium (Seymour et al., 2007; Grapin-Botton et al., 2015). These endocrine progenitors, which stop proliferation after commitment to the endocrine lineage (Miyatsuka et al., 2011), make endocrine fate choices based on the expression of a number of key transcription factors. An early fate choice is determined by the balance in expression between mutually inhibitory genes Pax4 or Arx, which push cells towards an α-, β- or δ-cell phenotype (Collombat et al., 2005, 2003; Sosa-Pineda et al., 1997). Although some of these important key transcription factors have been identified, the changes in regulatory gene networks during endocrine fate transitions are incompletely understood and can only be resolved at a single cell level.
Single cell transcriptomics is a recent but now popular approach that provides transcriptome-wide gene expression information from individual cells (Kolodziejczyk et al., 2015; Grün et al., 2015; Grün and van Oudenaarden, 2015). The strongest advantages over traditional bulk sequencing are the possibility of investigating gene expression patterns for each cell type individually, the ability to probe heterogeneity within cells of the same type and the ability to identify rare cell types within a population. We and others have recently analyzed gene expression in adult human and murine pancreatic tissue at the single cell level (Muraro et al., 2016; Segerstolpe et al., 2016; Baron et al., 2016; Xin et al., 2016; Wang et al., 2016; Lawlor et al., 2017; Li et al., 2016; Xin et al., 2018; Fang et al., 2019). In addition, other studies have investigated differentiation processes of iPS cells and pancreatic ontogeny at the single cell level (Byrnes et al., 2018; Petersen et al., 2017; Stanescu et al., 2017; Krentz et al., 2018; Veres et al., 2019) using tools that provide a pseudo-temporal signature to order cells in developmental time (Qiu et al., 2017b,c). These studies show how single pancreatic progenitor cells develop into characteristic endocrine and exocrine cells, and how adult pancreatic cells can be minutely characterized based on gene expression profiles intoα, β, γ, δ, ε, ductal and acinar cell clusters. Heterogeneity within these clusters of adult cells has been detected and has allowed the identification of rare subpopulations of cells (Muraro et al., 2016; Segerstolpe et al., 2016; Wang et al., 2016).
Here, we have used SORT-seq (Muraro et al., 2016), a high-throughput single-cell mRNA sequencing pipeline that provides high-quality single cell transcriptome profiles to sequence individual GFP-positive and -negative cells from MIP-GFP mice at multiple time points during the secondary transition of murine
Received 19 November 2018; Accepted 24 May 2019
1Hubrecht Institute/KNAW and University Medical Center Utrecht, Uppsalalaan 8, 3584CT Utrecht, The Netherlands.2Single Cell Discoveries, 3584CT Utrecht, The Netherlands.3Institut de Génétique et de Biologie Moléculaire et Cellulaire, Université de Strasbourg, BP10142 Strasbourg, France.4Oncode Institute, 3521AL Utrecht, The Netherlands.5Department of Internal Medicine, Leiden University Medical Center, 2333ZA Leiden, The Netherlands.
*These authors contributed equally to this work ‡Author for correspondence ([email protected])
L.v.G., 6281-5964; L.S., 0000-0003-1798-3413; G.G., 0000-0002-6730-2615; E.J.P.d.K., 0000-0002-1232-7022
© 2019. Published by The Company of Biologists Ltd|Development (2019) 146, dev173716. doi:10.1242/dev.173716
DEVEL
O
pancreatic development. All cells were combined into a single dataset, and divided into separate clusters representing all cell types of the embryonic pancreas using Seurat (Butler et al., 2018) and Monocle2 (Qiu et al., 2017b,c). This dataset was used to follow tissue maturation through time, to characterize progenitor cells at different stages of endocrine differentiation, to identify the distinct endocrine cell types of the pancreas that arise from these progenitors and to reveal dynamic expression of genes involved in these fate choices. This resource, which can also be easily accessed online (singlecellpancreas.eu), will provide a valuable starting point for further analysis into the function of the genes involved in the development of pancreatic cell types, especially forα- and β-cells.
RESULTS
Transcriptome profiling of single cells from different developmental time points identifies all known pancreatic cell types
We set out to build a resource with which we could follow pancreatic development at the single cell resolution, and that would cover developmental stages from the second transition to birth. To ensure we captured all cell types present in the developing pancreas, we used a MIP-GFP reporter mouse that would allow us to enrich for cells with an active insulin promoter. GFP-positive and ungated embryonic pancreatic cells of embryonic ages E12.5, E13.5, E14.5, E15.5 and E18.5 were sorted independently (Fig. S1A) and processed using the SORT-seq protocol (see Materials and Methods) to later be combined into a single dataset that contains all pancreatic cell types.
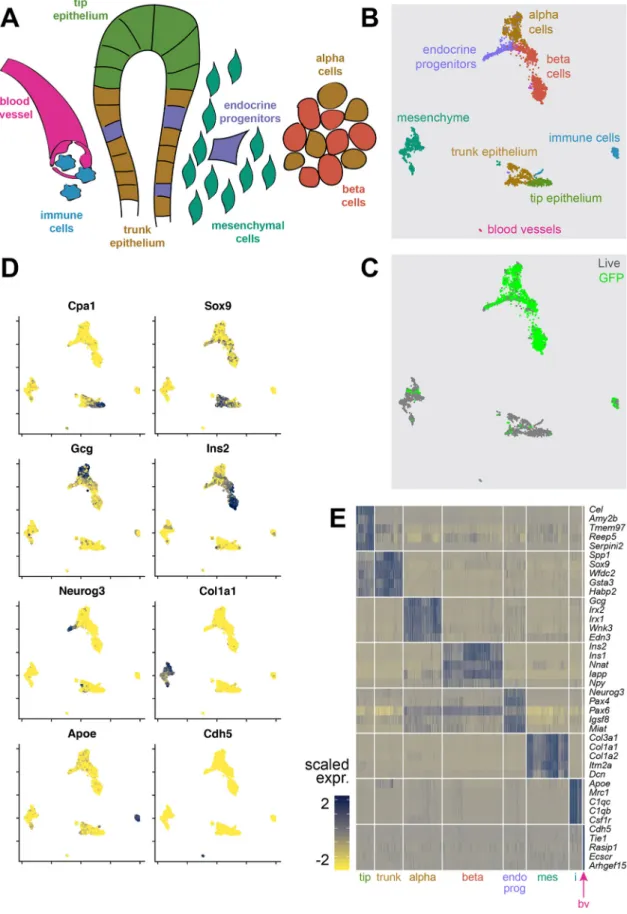
After sequencing, we obtained a dataset of 7296 single cells. A total of 4620 cells remained after quality control filtering (Fig. S1C,D). Unsupervised clustering revealed 14 clusters. Differential expression analysis allowed us to classify these clusters into eight different cell types: pancreatic tip and trunk epithelium, endocrine progenitors, maturingα- and β-cells, mesenchymal cells, immune cells and blood vessel cells (Fig. 1A,B). Cells that were sorted by MIP-GFP expression were mainly found in the endocrine cell types (endocrine progenitors, maturingα cells and maturing β cells). Some GFP-positive cells could also be found in the mesenchymal and immune cell populations, probably due to high autofluorescence (Fig. 1C). Characterization of fluorescence intensity showed that non-β endocrine cells had an elevated GFP intensity compared with tip and trunk epithelial cells [14.1 arbitrary units (au) for tip/trunk, 32.7 au for non-β endocrine cells, P=2.1×10⁻¹⁵], while cells with aβ-cell fate expressed GFP at still much higher intensities (32.7 au for non-β endocrine cells, 369.9 au forβ cells, P=2.2×10⁻¹⁶) (Fig. S1B). Typical markers, like Gcg and Ins2 forα- and β-cells, Cpa1 and Sox9 for tip and trunk epithelium, Neurog3 for endocrine progenitors, Col1a1 for mesenchyme, Apoe for immune cells and Cdh5 for blood vessel cells, were expressed in their specific populations (Fig. 1D), and expression of the top differentially expressed genes per cell type were mostly cell-type specific (Fig. 1E).
Next, the dataset was purified to contain only cells with a pancreatic epithelial or endocrine cell fate (see Materials and Methods). This final subset of the data contained 2589 cells, with a median of 17,429 unique transcripts and 5053 genes per cell. Of these cells, 1844 cells were sorted as GFP positive and 745 cells were sorted in an ungated manner (Table S1).
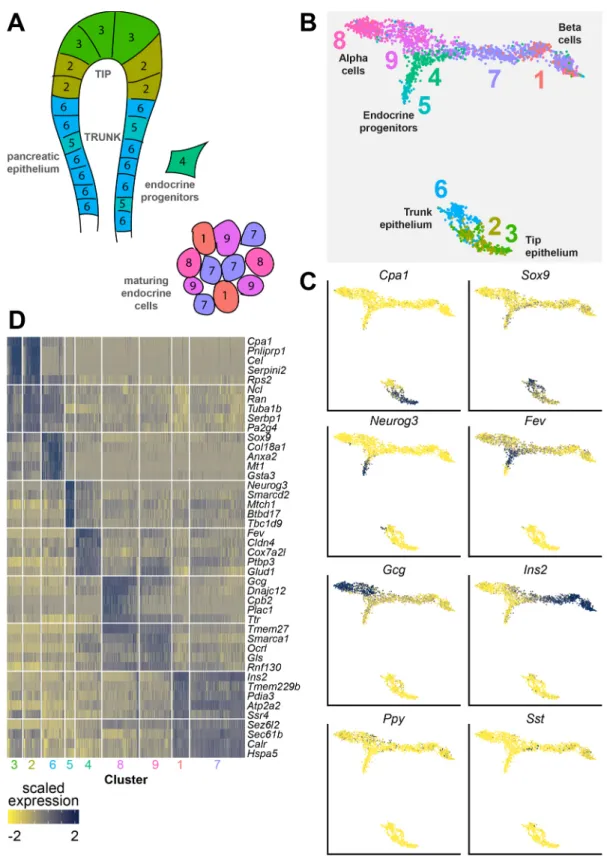
Shared nearest neighbor (SNN)-based clustering of these cells revealed nine unique clusters (Fig. 2A,B, Table S1). Genes such as Cpa1, Sox9, Neurog3, Fev, Gcg, Ins2, Ppy and Sst, which have been described to mark specific populations in the developing pancreas,
also marked specific clusters in our dataset (Fig. 2C). Based on differential expression analysis, these clusters were identified as epithelial tip (clusters 2 and 3), epithelial trunk (cluster 6), endocrine precursors (clusters 4 and 5),α lineage (clusters 8 and 9) or β lineage (clusters 1 and 7). Analysis of the most differentially expressed genes in each cluster shows a clear cell type-specific gene signature, where differences between clusters that mark the same cell type were much more subtle (Fig. 2D). We provide the complete list of these genes as a resource that can be mined for cell type-specific genes important for embryonic pancreas development (Table S2).
Clusters of poly-hormonal cells were not identified. However, we set out to manually investigate the occurrence of multi-hormonal cells within the clusters. Hormone-expressing cells were defined as cells that expressed more than four log-normalized counts of a given hormone (see Materials and Methods; Fig. S3A). Polyhormonality was defined as any cell that expressed more than one hormone above this threshold. Seven-hundred and forty-four Ins2-expressing cells were mostly found inβ-cell clusters 1 and 7, while the 535 Gcg-expressing cells were mostly found in clusters 8 and 9 (Fig. S3B). Only six Ppy- and 19 Sst-expressing cells were detected, and these cells were mostly found dispersed throughout theα- and β-cell clusters (Fig. 2C). Mean hormone expression levels per cluster followed the same trend, with the highest Ins2 expression levels in clusters 1 and 7 and the highest Gcg expression in cluster 8 and 9 (Fig. S3C). In total, 36 polyhormonal cells (representing 2.7% of all hormone expressing cells) were detected in the dataset. The most common combinations were cells co-expressing both Gcg and Ins2 (16 cells), Ins2 and Ppy (six cells), and Ins2 and Sst (six cells) (Fig. S3D).
As previously described (Marty-Santos and Cleaver, 2016; Krentz et al., 2017), cell cycle stages calculated for each cell indicated that most cells from the tip and trunk domain were in either S, G2 or M phase of the cell cycle. In contrast, almost all cells within the endocrine lineages have exited the cell cycle, with only few proliferative cells still present in Neurog3-expressing endocrine progenitor cluster 5 (Fig. S2C and Table S1).
We used cells originating from different experiments and embryonic ages within the dataset (Fig. S2A,B). To appreciate contribution of specific embryonic ages to each cell type, we traced the number of cells within each cluster back to the embryonic age it was collected from (Fig. S2E). We noticed that cells in the epithelial tips (clusters 2 and 3) predominantly originate from E15.5, whereas endocrine progenitors (cluster 5) originate from embryonic ages E12.5-E15.5, but no longer contribute at E18.5. Then, a large percentage ofα cells (clusters 8 and 9) originates from embryonic age E12.5, whereasβ-cells (clusters 1 and 7) originate largely from later embryonic ages (E15.5 and E18.5). We anticipate that it is in part due to our enrichment for MIP-GFP-expressing cells, especially as we observe that Ins2 expression inβ-cells is increased at later embryonic ages, likely also increasing GFP specificity for β cells (Fig. 2C; Fig. S2B,D). Taken together, these data validate our experimental approach to follow the dynamic gene expression changes during pancreas development, to look for novel subpopulations of cells and to analyze which gene expression patterns are important during the transition from early, undifferentiated cell types to more mature, adult-like cell states.
Epithelial tip cells, endocrine precursors and developing α- and β-cells contain heterogeneous transcriptomic signatures
Next, we characterized the pancreatic cell types as described in Fig. 2 in more detail. Unsupervised clustering designated multiple
DEVEL
O
Fig. 1. Transcriptome data from embryonic pancreatic cells of multiple embryonic ages were merged into a comprehensive dataset. (A) A simplified schematic overview of the different cell types in the developing pancreas. Colors are matched with B. (B) A UMAP plot of all cells. Specific cell types are indicated by color, similar to A. (C) A UMAP plot of all cells. Colors indicate whether cells were live sorted or sorted as GFP-positive cells. (D) Expression maps showing log-normalized expression of typical markers for each cell type (Cpa1, Sox9, Gcg, Ins2, Neurog3, Col1a1, Apoe and Cdh5). Data are shown as log-log-normalized expression. Blue indicates high expression, yellow indicates low expression. (E) A heatmap showing the top five differentially expressed genes per cell type. Data are shown as scaled expression (ranging from−2 to 2). Blue indicates high expression, yellow indicates low expression. tip, tip epithelium; trunk, trunk epithelium; alpha,α-cells; beta, β-cells; endo prog, endocrine progenitors; mes, mesenchyme; i, immune cells; bv, blood vessels.
TECHNIQUES AND RESOURCES Development (2019) 146, dev173716. doi:10.1242/dev.173716
DEVEL
O
clusters for epithelial tip cells (clusters 2 and 3), endocrine precursors (clusters 4 and 5), cells that develop anα-cell signature (clusters 8 and 9) and cells that are progressing towards aβ-cell fate
(clusters 1 and 7). We therefore asked what gene signatures are related to this heterogeneity within each of these four cell types. To answer this, we analyzed the differentially expressed genes between
Fig. 2. Transcriptome data from embryonic pancreatic cells of multiple embryonic ages were merged into a subset of the complete dataset containing clusters that represent all cell types of endocrine and exocrine pancreatic cell development. (A) A simplified schematic overview of the different cell types in this subset of the developing pancreas. Colors match the UMAP in B. (B) A UMAP overview of all clustered cells in the dataset. Colors and numbers indicate clusters. (C) Expression maps showing log-normalized expression of typical markers in the developing pancreas (Cpa1, Sox9, Neurog3, Fev, Gcg, Ins2, Ppy and Sst). Data are shown as log-normalized expression. Blue indicates high expression, yellow indicates low expression. (D) A heatmap showing the top five differentially expressed genes per cluster. Data are shown as scaled expression (ranging from−2 to 2). Blue indicates high expression, yellow indicates low expression.
DEVEL
O
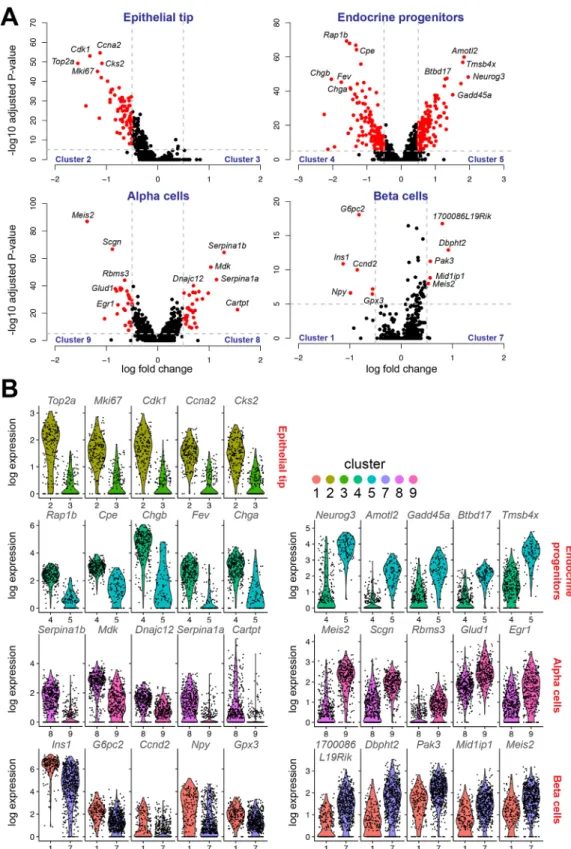
the two clusters that mark the same cell type (Fig. 3A). The heterogeneity within the epithelial tip cells was mostly defined by genes that are involved in cell cycle progression, such as Cdk1,
Top2a and Mki67 (Fig. 3A). These genes were expressed at much higher levels in cluster 2, a tip epithelium cluster found between trunk and more acinar-like tip cells in cluster 3 (Fig. 3B)
Fig. 3. Heterogeneity within specific cell types in the developing pancreas. (A) Differential expression was calculated for each cell type that consisted of more than one cluster, and plotted as a volcano plot (log fold change versus−log10 adjusted P-value): the epithelial tip cells (clusters 2 and 3), endocrine progenitors (clusters 4 and 5),α-cells (clusters 8 and 9) and β-cells (clusters 1 and 7). Red dots represent genes that are considered significant, with a Bonferroni corrected P<1×10⁻⁵and a log fold change of at least 0.5. These thresholds are indicated by the dotted gray lines. (B) Distribution of expression of five top differentially expressed genes from clusters compared in the volcano plots in A. For cells from the tip domain (epithelial tip) only the five differentially expressed genes upregulated in cluster 2 were plotted because no significantly upregulated genes were identified in cluster 3. The violin plots are color coded in the same way as the UMAP plot in Fig. 2B for clarity. Expression on the y-axis represents log-normalized expression values. Cluster numbers are indicated on the x-axis.
TECHNIQUES AND RESOURCES Development (2019) 146, dev173716. doi:10.1242/dev.173716
DEVEL
O
(Kowalczyk et al., 2015). Although Hnf1b is not differentially expressed in the pancreatic tip clusters, this gene is closely linked to both proliferation and multipotency during lineage specification (De Vas et al., 2015), leading us to believe that the heterogeneity in the tip is marked by populations of proliferative multipotent progenitors, and non-proliferating unipotent tip cells with an acinar lineage.
We also found two clusters containing endocrine precursor cells. One expressed high levels of Neurog3 (cluster 5), which we designate as endocrine progenitors, whereas the other (cluster 4) expressed high levels of endocrine markers such as Chga, Chgb and Cpe (Fig. 3A-B), indicating that these cells are more specialized towards an adult endocrine cell fate. This transitory endocrine progenitor cluster (cluster 4) was specifically marked by the gene Fev, while the Neurog3-expressing cluster harbored many highly specific but unknown markers such as Amotl2, Btbd17 and Gadd45a (Fig. 3A,B). Fev has recently been found in another single-cell transcriptomics study of the developing pancreas that encompassed one of the embryonic ages used in our study (Byrnes et al., 2018), confirming our results that this could represent an intermediate cell state between endocrine progenitors and more-mature endocrine cell types. To further elucidate the difference between the two clusters, we performed gene ontology (GO) and gene-set enrichment (GSEA) analyses. The top five ranked GO terms associated with Neurog3-expressing cluster 5 were all associated with endocrine or nervous development (Fig. S4A). Alternatively, GSEA revealed a strong role for protein synthesis in Neurog3-expressing cells, with eight of the top 10 pathways associated with transcription, translation and ribosomes (Fig. S4C). For the transitory endocrine progenitor cluster 4, GO and GSEA were more consistent, with both analyses showing pathways related to the processing, regulation and secretion of hormones (Fig. S4B, D). This indicates that these cells resemble a more endocrine-committed, but not yet mature,α- or β-cell-specific phenotype.
In developingα- and β-cells, differential expression analysis of the different clusters yielded relatively few markers. In α-cells, Meis2, Scgn and Glud1 marked cluster 9, while Serpina1a, Serpina1b and Cartpt are markers for cluster 8 (Fig. 3B). In developingβ cells, Meis2, Pak3 and Dbpht2 are markers for cluster 7. Ins1, G6pc2 and Npy are highly expressed in cluster 1 (Fig. 3B). All cluster 1 genes can be linked to adultβ-cell function. Npy has a role in appetite sensing and G6pc2 is a catalytic gene, both of which have been linked to insulin secretion (Imai et al., 2007; Pound et al., 2013), while Ins1 is related to Ins2 and thus represents matureβ-cell functioning. The gene profiles allowed us to characterize cluster 7 as an early and cluster 1 as a more-differentiated β-cell population. Similarly, cluster 9 was characterized as an early and cluster 8 as a more-differentiatedα-cell population. Interestingly, the gene Meis2 is indicated in heterogeneity of both the developingα- and β-cells. This gene has been shown to bind the pancreatic transcription factor Pdx1 and is therefore an interesting candidate to study in the context ofα- and β-cell identity (Schnuriger et al., 2009).
In short, we found heterogenous gene signatures in several populations of the developing embryonic pancreas.α- and β-cells split into early and late clusters. The tip epithelium can be split into a more unipotent acinar-like population and an actively dividing population that represents the multipotent tip progenitors. Finally, we found two populations of endocrine precursors: an early progenitor cluster that expresses Neurog3 with mostly unknown endocrine progenitor marker genes. The second cluster contains cells that we consider to be transitory endocrine progenitors, have not clearly committed towards eitherα or β cell fate, but express high levels of genes that are generally involved in endocrine fate
commitment, such as Chgb and Fev. This cluster could represent an intermediate cell state between Neurog3-positive endocrine progenitors and more mature endocrine cells (Byrnes et al., 2018).
Pseudotime analysis reveals specific gene regulation patterning during pancreatic ontogeny
After characterizing the differences between clusters belonging to the same cell type, and identifying gene signatures that characterize early and late progenitors, we aimed to identify the genes that were differentially regulated in cells progressing from the multipotent tip through an endocrine progenitor state towards either anα- or β-cell fate. Therefore, we performed pseudotime trajectory analysis as this allowed us to describe dynamic gene expression patterns in more detail than is possible through differential gene expression analysis, and it allowed us to evaluate cell fate plasticity over developmental time.
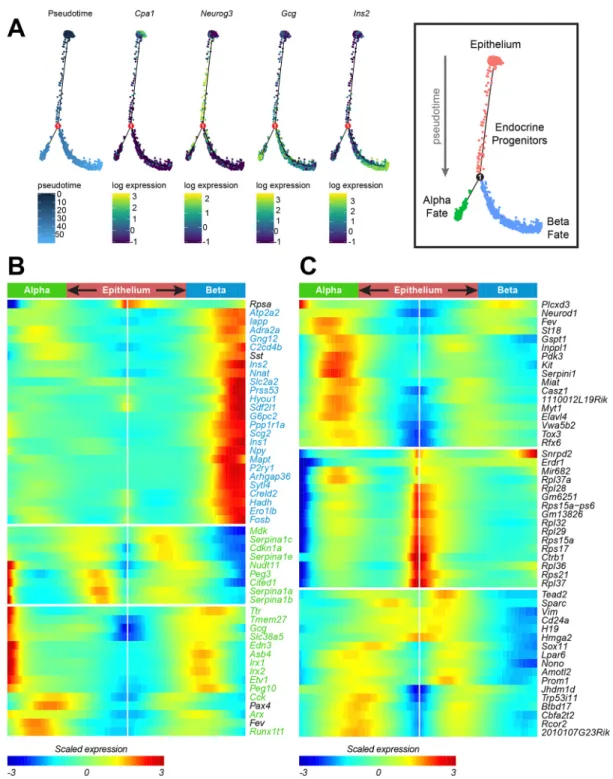
Cells were ordered in pseudotime and plotted in a branching trajectory using Slingshot (Street et al., 2018) and Monocle2 (Qiu et al., 2017c) (Fig. 4A, Fig. S5A-C). Slingshot, which orders cells based on original clustering, ordered cells starting at the tip epithelium (clusters 2 and 3), going through trunk epithelium (cluster 6) towards endocrine precursors (clusters 4 and 5) and branching into either anα- (clusters 8 and 9) or β-cell fate (clusters 1 and 7). We found some inconsistencies regarding current understanding of α- and β-cell development (Fig. S5A-C). First, the trajectory starts with cluster 3, containing multipotent tip cells, then includes cells we designated as unipotent tip cells (cluster 2), which can obviously not contribute to endocrine specification (Pan et al., 2013). Second, endocrine progenitors were only recognized to be involved inβ-cell development, not α-cell development, while lineage tracing of Neurog3-expressing cells indicates all endocrine cell types as descendants of endocrine progenitors (McGrath et al., 2015). Lack of recognition of endocrine progenitor cells in the development ofα-cells might be biased by the early timepoint of origin of the captured cells with an acquiredα-cell fate (Johansson et al., 2007). Finally, the branching point was determined in α-cell-related cluster 9, not in one of the precursor clusters, suggesting that β-cell differentiation proceeds through a transient α-cell-like state, while both fates are considered to be independent (Qiu et al., 2017a). In Monocle2, cells were organized from the ductal epithelium through endocrine progenitors to a branching point, after which α-cell and β-cell specification were separated into independent branches. This was confirmed by expression of common markers Cpa1, Neurog3, Gcg and Ins2 (Fig. 4A), a superimposition of the clustering analysis we performed on the pseudotime trajectory (Fig. S5D) and inversely, the superimposition of the pseudotime values on the UMAP plot of the subset of our data containing all epithelial and endocrine cells (Fig. S5E). Ordering of clusters can then be performed by looking at the distribution of pseudotime within each cluster, showing epithelial clusters first, then Neurog3-expressing progenitors, Fev-expressing transient endocrine precursors, α-cell clusters and finally β-cell clusters (Fig. S5F). Taken together, the Monocle2 analysis seemed to be more consistent with our current understanding of endocrine specification, and we used this method for further downstream analysis.
To focus on how fate choices are made between cells progressing towards either an α- or β-cell fate, we performed an expression analysis on how genes are differentially regulated in both branches after the branch point. In this way, we could identify genes that are specific for eitherα- or β-cell fate acquisition. Unsurprisingly, many of the top regulated genes that were identified by this analysis were genes that were already differentially expressed between α- and
DEVEL
O
β-cells (Fig. 4B), like Ins2, Iapp, Npy, Hadh and G6pc2 in the β-cell branch and Gcg, Arx, Irx2 and Ttr in theα-cell branch. We then removed all genes from our branched expression analysis that intersected with genes that were differentially expressed between clusters 8 and 9 (α-cell fate) and clusters 1 and 7 (β-cell fate). The
remaining genes should thus represent a list of genes that are implicated in regulation ofα- or β-cell fate acquisition, without being direct markers of these cell types (Fig. 4C). A subset of these genes represent ribosomal proteins that are highly expressed in the ductal epithelium, while another subset of these genes co-express with
Fig. 4. Pseudotime ordering of embryonic pancreatic cells reveals novel genes with specific regulation patterns during endocrine differentiation. (A) Trajectories forα- and β-cell differentiation in the developing pancreas. Pseudotime progresses from the top through the branch point towards the bottom, as indicated by color in the first panel. Pancreatic epithelial cells are located in the top of the trajectory,α-cells on the left trajectory and β-cells are on the right trajectory, as indicated by Cpa1, Gcg and Ins2 expression. Neurog3 expression indicates that endocrine progenitors are located in between these populations. (B) Branched expression analysis of theα- and β-branches that were determined in the pseudotime analysis. The top 50 differentially regulated genes are hierarchically clustered into three groups. The start of pseudotime, in the ductal epithelium, is located in the middle and extends to the left for theα-branch, and to the right for theβ-branch. Color indicates scaled expression, from −3 (blue) to +3 (red). Gene names are color-coded for overlap with α-cell identity genes (green) orβ-cell identity genes (blue). (C) Branched expression analysis of the α- and β-branches that were determined in the pseudotime analysis. The top 50 differentially regulated genes after removal ofα- and β-identity genes are hierarchically clustered into three groups. Color indicates scaled expression, from−3 (blue) to +3 (red). Gene names are color-coded for overlap with α-cell identity genes (green) or β-cell identity genes (blue).
TECHNIQUES AND RESOURCES Development (2019) 146, dev173716. doi:10.1242/dev.173716
DEVEL
O
Neurog3-expressing endocrine progenitors, like Serpini1 (which is associated with neuronal development; Lee et al., 2006), Inppl1 (which is associated with metabolic syndrome; Sleeman et al., 2005) and Prom1 (an adult stem cell marker; Katoh et al., 2007).
Expression patterns of combinations of genes, or individual genes in developmental time, are predictive of cell fate acquisition
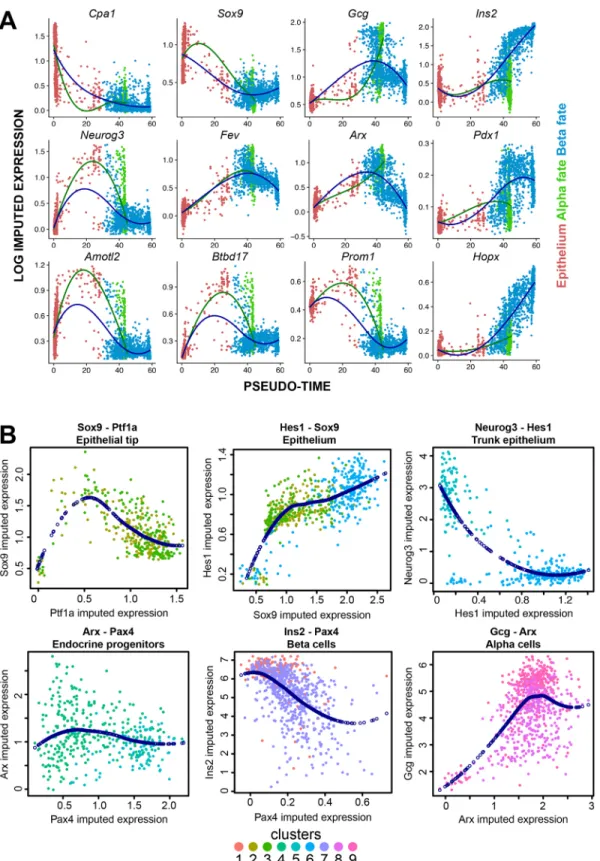
Plotting gene expression in pseudotime allowed us to obtain the directionality of gene expression throughout pancreatic development. Thus, we investigated how gene expression signatures changed during the major transitions through pseudotime in our dataset. First, we plotted the imputed expression of known markers Cpa1, Sox9, Gcg and Ins2 (Fig. 5A). As expected, expression for Cpa1 and Sox9 was high in the epithelium, which was organized in the beginning of pseudotime (red dots). The expression for these genes markedly declined over pseudotime, and was very low in both cells with an α- and β-cell-fate. Gcg and Ins2 expression, reversely, was low in the epithelium and increased in its specific populations over pseudotime: Gcg markedly increased expression in α-cells, whereas Ins2 was strongly upregulated inβ-cells. The α- and β-cell transcription factors Arx and Pdx1 showed very similar patterns to their cell type-specific hormones. Neurog3 was not associated with a type-specific branch, but showed a marked and narrow peak in expression around pseudotime 20, before the data splits into theα and β branches. Fev, a marker for cells in cluster 4, which we dubbed as transitory endocrine progenitors, peaks later in pseudotime than Neurog3, but before the hormones Gcg inα cells and Ins2 in β cells, which is also in line with expectations. Finally, we checked expression patterns of some novel markers for endocrine cells. Amotl2 and Btbd17, both novel endocrine progenitor markers, show the same specific and narrow expression peak as Neurog3. Finally, expression patterns of Prom1 and Hopx were plotted as novel branch-specific endocrine progenitor fate acquisition markers forα- and β-cells, respectively (Fig. 5A).
As combinations of expressed genes can be indicative of specific populations of cells, we sought to investigate relations between typical markers in subpopulations of our dataset. Ptf1a and Sox9, for example, are typical markers for the tip and trunk of the pancreatic epithelium, respectively. However, their co-expression indicates multipotent cells in the tip structures (Pan et al., 2013). In our data, their expression is negatively correlated (Fig. 5B), as indicated by polynomial interpolation, although most cells express both genes at some abundance. Hes1 is a notch signal that inhibits Neurog3 expression (Ahnfelt-Ronne et al., 2012), and thus their expression in the pancreatic epithelium is mutually exclusive, whereas the expression of trunk markers Hes1 and Sox9 is positively correlated (Fig. 5B).
In the endocrine differentiation ofα- and β-cells, the first stages of development (represented in clusters 5 and 4) are shared between the cell types. As a consequence, the start of the gene trajectories in pseudotime is similar. Neurog3 expression rapidly diminishes after peaking in the beginning of pseudotime. Pax4 and Arx, which are considered to be key regulators in α- and β-cell fate decisions (Napolitano et al., 2015), are both expressed in endocrine progenitors. On a transcriptome level, Pax4 expression gradually declines during bothα- and β-cell development, but Arx expression is maintained in α-cells while β-cells downregulate Arx towards maturation. Interestingly, no obvious correlation was found between the expression of Pax4 and Arx in endocrine progenitors, although Pax4 expression was upregulated in Neurog3-expressing cluster 5 compared with the developmentally more advanced progenitor cluster 4. Finally, while Arx and Gcg are positively correlated in
developing α-cells, Pax4 and Ins2 are negatively correlated in developingβ-cells, which indicated that Pax4 expression is reduced at the later stages of pseudotime inβ-cells.
In conclusion, this dataset can be used to mine gene signatures that are co- or anti-correlated. By following the gene signatures described in Fig. 5 and using our website (singlecellpancreas.eu) to check the expression of any given gene in the embryonic pancreas, the user can obtain a better grasp of key gene expression patterns important for cell type specification during pancreatic development. This resource serves as a starting point for understanding pancreas developmental transitions at a time-resolved single cell resolution.
DISCUSSION
In this study, we present a comprehensive dataset containing single cells from the mouse embryonic pancreas from embryonic ages E12.5 to E18.5. Although we focus onα- and β-cell development, the dataset contains all known cell types of the developing pancreas, and allowed us to discover heterogeneity within the epithelial tip, endocrine precursors, and developingα- and β-cells. We expect this dataset to be a valuable resource for mining genes that are lineage and cell-type restricted during pancreatic development.
We used lineage reconstruction analysis to indicate the existence of an immature endocrine state between the Neurog3+endocrine
progenitors and the mature endocrine cell types. The gene Fev specifically marks this particular population, which we call transitory endocrine progenitors. This gene has been described recently in subpopulations of embryonic pancreas cells at E15.5 and E18.5 (Krentz et al., 2018). Pseudotime analysis alongα- and β-cell differentiation further reveals how cells progress from one cell state to the next in developmental time, and allows us to assess dynamic gene expression changes. Well known markers, such as Cpa1, Sox9, Neurog3 and the hormones Ins2 and Gcg, behave as expected in this pseudo-temporal timeline (Ahnfelt-Ronne et al., 2012), and clustering of all differentially regulated genes provides a resource of known and unknown genes in pancreatic development that can be harvested for potential new markers and candidate genes important for pancreatic development.
The gene Amotl2, for example, was found to be co-expressed with Neurog3 in the endocrine progenitor population. This gene has been shown to be important for cell movement in zebrafish embryos (Huang et al., 2007), breaking of cell polarity and tumor invasion (Mojallal et al., 2014), as well as being involved in neural development (Proszynski et al., 2013). A possible function for this gene could be in the delamination of Neurog3+progenitor cells
to a more endocrine-committed transitory progenitor cell state, marked by Fev. We postulate that finding genes like this, with no known function in pancreatic development but with described functions in other tissues can provide a good starting point for generating new hypotheses regarding pancreatic development.
Importantly, we used a MIP-GFP reporter to enrich for endocrine cells in general and β-cells in particular, which means that this dataset is skewed towardsβ-cell differentiation within the endocrine compartment and could have limited use when studying other lineage allocations. This enrichment specifically allowed us to build a more-complete and faithful roadmap forβ-cells. This strategy has been used recently (Krentz et al., 2018) to achieve a similar enrichment for endocrine cells from E15.5 and E18.5 mouse embryos, showing the necessity of focusing on a particular cell type to build a complete roadmap. However, other cell types, such as α-cells, are also abundantly present in the dataset, can be followed through pseudotime and are a valuable resource for the research community. We postulate that dim GFP expression driven by the
DEVEL
O
mouse insulin promoter in non-β endocrine cells allowed us to still enrich for these cells, albeit less efficiently, thus increasing our yield of these cell types.
Other studies have been performed to characterize the embryonic pancreas at the single cell level. However, as these studies were carried out on a small subset of genes (Petersen et al., 2017), at a
Fig. 5. Pseudo-temporal expression patterns of key factors of pancreatic development and their interactions. (A) Expression dynamics of specific genes in pseudotime. In each plot, log imputed expression is plotted for each cell as a function of pseudotime. Color indicates the state of the cell (epithelium in red, α fate in green or β fate in blue). Loess curve fitting represents the local polynomial regression over pseudotime for both α- and β-fate progression from the epithelium, indicated by color (α-fate in green or β-fate in blue). (B) Log imputed expression of key developmental genes were plotted against each other for cells of specific clusters, as indicated in the plots, to show their relationship during specific stages of development. Colors indicate which clusters the cells belong to; dark-blue dots represent polynomial interpolations to indicate relationships between genes.
TECHNIQUES AND RESOURCES Development (2019) 146, dev173716. doi:10.1242/dev.173716
DEVEL
O
single time point (E13.5) (Stanescu et al., 2017) or with limited sequencing depth (QC threshold of 200 genes per cell) (Byrnes et al., 2018), they are of limited use when following gene expression changes during the second transition in pancreatic development. We therefore decided to build on these datasets by making a comprehensive roadmap containing cells from several embryonic ages (E12.5, E13.5, E14.5, E15.5 and E18.5), combined with high-depth sequencing (median over 5000 genes per cell). We show that this dataset can be mined for novel marker genes, to study cell type heterogeneity and to find gene expression patterns that play a role in forming the different cell types that make up the pancreas, especially those ofα- and β-cells, which were the focus of this study. We hope this study, which can be browsed at singlecellpancreas.eu, will provide a valuable resource for understanding pancreatic development.
MATERIALS AND METHODS
Animal experiments
Mouse embryos that express GFP under transcriptional control of the mouse insulin promoter (MIP-GFP mice, Jackson Laboratories #006864) were isolated at embryonic days (E) 12.5, E13.5, E14.5, E15.5 and E18.5. All experiments on animals were carried out in accordance with the guidelines of the Animal Welfare Committee of the Royal Netherlands Academy of Arts and Sciences (KNAW).
Tissue preparation
From obtained embryos, the pancreas was isolated as described previously (Petzold and Spagnoli, 2012). Pancreases from MIP-GFP embryos were digested into single cells using TrypLE (Thermo Fisher, #12605010) containing 10 µg/ml pulmozyme (Roche, Basel, Switzerland), and washed with PBS containing 10% FBS (Thermo Fisher, 10500064). Cells were stored on ice until they were sorted using FACS. DAPI (Thermo Fisher, D1306, 20 µg/ml) or TO-PRO3 (Thermo Fisher, T3605, 1 µM) was added to cell suspensions immediately before sorting to distinguish between live and dead cells.
FACS sorting
Cells were sorted as single cells into hard-shell 384-well PCR plates (BioRad) containing 100 or 200 nl of RT primers, dNTPs (Promega), ERCC spike-ins (Ambion) and 5 µl vapor-lock (Qiagen) using FACSJazz or FACSAria II (BD biosciences) as described previously (Muraro et al., 2016). For every embryonic age, GFP-negative cells as well as MIP-GFP-positive cells (to enrich for endocrine cell types) were sorted into separate plates (Fig. S1A). Index sorting was performed in order to couple FACS-obtained data such as forward scatter, side scatter and GFP intensity to our transcriptome data. Sorted cells in plates were snap frozen on dry ice and stored at−80°C.
Processing of sorted cells
Plates of sorted cells were thawed on ice and lysed at 65°C, after which reverse transcription (RT) and second-strand reactions were carried out. RT reactions were performed using primers containing a polyT tail, a 4 or 6 bp unique molecular identifier (UMI) sequence, a cell-specific barcode sequence (8 bp), an Illumina 5′ adapter and a T7 promoter sequence. Contents from all wells in a plate were pooled into a single library after second-strand synthesis. RNA in these libraries underwent linear amplification using in vitro transcription, followed by fragmentation to lengths between 200 and 1000 bp. Next, a second RT reaction using random hexamer primers containing the Illumina 3′ adapter was performed and libraries were amplified using PCR. Sequencing was performed on Illumina NextSeq ( paired-end, 75 bp reads). A median of 90,000 reads per cell were sequenced.
Library sequencing and mapping
Sequenced reads were mapped to a reference transcriptome based on the mouse genome release mm10 as described previously (Muraro et al., 2016). Reads with the same UMI– barcode – transcript combination were likely
caused by PCR over-amplification and were thus counted as a single read, and the number of reads per transcript per cell were corrected for RNA– UMI collision using poissonian counting statistics (Grün et al., 2015). Data from all plates were pooled into a single dataset containing 7296 cells and 19,788 genes.
Data processing
Cells with fewer than 6000 UMI counts and/or cells that expressed fewer than 2000 genes were filtered from the dataset. Data were processed in R using Seurat version 2.3.4 as follows: metadata were added regarding the origin of the cell (experimental code, embryonic age, live or GFP sorted). Then data were log-normalized with a scaling factor of 10,000. Variable genes were detected using an x low cut-off of 0.2 and a y low cut-off of 0.5, with high cut-offs set to infinity and data divided into 20 bins. All genes were scaled using a negative binomial model assuming UMI data, with the number of expressed UMIs and genes per cell were used as variables to regress. A total of 40 principal components were calculated and assessed using jackstraw. All PCs were found to contribute significantly and were thus used for downstream analysis. Clustering was performed using Seurats FindClusters function with sensitivities ranging from 0.1 to 2 in 0.1 steps. Using clustree version 0.3.0, it was first observed on a sensitivity resolution of 0.5 that clustering was not changed at a higher sensitivity, and this sensitivity was then picked for assessment of clustering using the AssessNodes function of Seurat after building a clustering tree of the clustering. Nodes that had a higher out-of-bag error rate than 10% were removed and clusters underneath these nodes were merged. UMAP dimensional reduction was calculated using the umap package version 0.1.0.3, with metric function set to euclidean and using only variable genes, as detected by Seurat. Differential expression was calculated between clusters using the FindMarkers function from Seurat, using the ‘negbinom’ test, and the number of expressed UMIs and genes per cell were used as variables to regress. Based on the top upregulated genes per cluster, cell type identities were determined for each cluster and clusters that represent the same cell type were merged. Differential expression for individual cell types was then calculated similarly as it was calculated for clusters.
Next, cells expressing more than three raw UMI counts of Apoe or Cd93, or five transcripts Col1a1 or Hbb-y were excluded from the dataset, as they represented cell populations unrelated to endocrine or exocrine cells (blood vessel, immune, mesenchyme and red blood cells). The genes Malat1, Lars2 and Rn45s, which were strongly upregulated in some libraries and are linked to cellular stress (Yao et al., 2016; Schild et al., 2014; Yoshikawa and Fujii, 2016), were then excluded from the dataset. After filtering, the full dataset consisted of 2589 cells and 19,696 genes. To correct for any batch effects caused by the embryonic age of the collected tissues, Seurat objects were then generated per embryonic age, and data were log-normalized and scaled as described previously. Cells from different embryonic ages were then merged into a single dataset using multiCCA (Butler et al., 2018), using the first six CCAs for downstream analysis. Experiment identifiers, embryonic age and FACS characteristics were added manually to metadata. Cell cycle state was calculated as described previously (Tirosh et al., 2016). Clustering resolution was set to 0.7 and was consecutively evaluated using Seurat’s AssessNodes function. Clusters were merged when the out-of-box error scores were above 10%. In this manuscript, pancreatic epithelium is defined as the cells from the tip and trunk domain. Differentially expressed genes per cluster, and differential expression between specific clusters, was calculated using the FindMarkers function is Seurat using the‘negbinom’ test, with the number of genes and UMIs for every cell as variables to regress. Data for specific genes (Cpa1, Ptf1a, Sox9, Hes1, Gcg, Ins2, Neurog3, Fev, Arx, Pax4, Pdx1, Amotl2, Btbd17, Prom1 and Hopx) was imputed using the AddImputedScore function of Seurat, using all variable genes as template to fit. Imputed data was only used to generate comparative gene plots. To determine which cells can be designated to express a hormone, density plots were generated for the hormones of all cells. For Gcg- and Ins2-expressing cells, bimodal expression patterns could clearly be observed, and the local minimum between the modes was mathematically determined (4.23 log-normalized counts for Gcg, 4.16 log-normalized counts for Ins2). Forγ- and δ-cells, a
DEVEL
O
bimodal expression distribution was not found, owing to the low number of Ppy- and Sst-expressing cells. As a compromise, we decided that any cell that expressed any hormone with more than four log-normalized counts was considered to be a hormone-expressing cell for that hormone. If a cell passed the threshold for more than one hormone, we considered it to be poly-hormonal. Hormone expression signatures per cell were then added to the metadata.
Pseudotime analysis
Raw data were filtered so that the same cells and genes remained as for the Seurat object containing only the pancreatic epithelial endocrine cells, and was then used in the single cell RNA-sequencing toolkit Monocle2 version 2.10.1 (Qiu et al., 2017b,c). Clustering information from Seurat was transferred to the monocle pData object. Differential expression was calculated using the differentialGeneTest from Monocle, using the Seurat-determined clusters to generate a full model. Genes that had a q-value lower than 0.05 were used to set the ordering filter and reduce dimensions using DDRTree version 0.1.5. Differentially regulated genes in pseudotime were calculated using full model ‘∼sm.ns(Pseudotime)’, and genes that were differentially regulated between theα and β branch were calculated using the BEAM function in monocle. The top 50 differentially regulated genes, as determined by BEAM, were clustered into three groups using ward.D2 as clustering method. Genes were then removed that were differentially expressed betweenα- and β-cells, as determined by Seurat (clusters 1+7 versus cluster 8+9, FindMarkers function using ‘negbinom’ test and regressing the number of UMIs and genes). The top 50 remaining differentially regulated genes from the BEAM analysis were then also clustered into three groups using ward.D2.
Pathway analysis
Gene ontology was performed using the web interface www.geneontology. org. Only biological processes for Mus musculus were obtained this way. For gene-set enrichment analysis (GSEA), the GSEA Java Desktop Application from the BROAD institute was used (software.broadinstitute.org/gsea/ index.jsp) and GSEA was calculated using h.all, c1.all, c2.all, c3.all, c4.all, c5.all, c6.all and c7.all geneset databases.
Software and resources
Rstudio version 1.1.463 was used in combination with R version 3.5.3. Data were processed using Seurat version 2.3.4 (Butler et al., 2018) and Monocle version 2.10.1 (Qiu et al., 2017b,c). Clustering was assessed using clustree version 0.3.0.
Acknowledgements
We thank Céline Ziegler-Birling for technical assistance. Competing interests
The authors declare no competing or financial interests. Author contributions
Conceptualization: L.v.G., E.J.P.d.K.; Methodology: L.v.G., M.J.M., E.J.P.d.K.; Software: L.v.G., M.J.M.; Validation: G.D.; Formal analysis: L.v.G., M.J.M.; Investigation: L.v.G., M.J.M., T.D., L.S.; Resources: M.J.M., G.G., A.v.O., E.J.P.d.K.; Data curation: L.v.G., M.J.M.; Writing - original draft: L.v.G., M.J.M., G.D., G.G., E.J.P.d.K.; Visualization: L.v.G.; Supervision: A.v.O., E.J.P.d.K.; Project administration: A.v.O., E.J.P.d.K.; Funding acquisition: A.v.O., E.J.P.d.K. Funding
Financial support was provided by the Diabetes Fonds, by Stichting Diabetes Onderzoek Nederland and by the Tjanka Foundation. The Gerard Gradwohl lab is supported by a Challenge Grant from the Novo Nordisk Fonden (NNF14SA0005). Data availability
The single-cell sequencing data described in this study have been deposited in GEO under accession number GSE132364.
Supplementary information
Supplementary information available online at
http://dev.biologists.org/lookup/doi/10.1242/dev.173716.supplemental
References
Ahnfelt-Ronne, J., Jorgensen, M. C., Klinck, R., Jensen, J. N., Fuchtbauer, E.-M., Deering, T., Macdonald, R. J., Wright, C. V. E., Madsen, O. D. and Serup, P. (2012). Ptf1a-mediated control of Dll1 reveals an alternative to the lateral inhibition mechanism. Development 139, 33-45. doi:10.1242/dev.071761 Baron, M., Veres, A., Wolock, S. L., Faust, A. L., Gaujoux, R., Vetere, A., Ryu, J. H., Wagner, B. K., Shen-Orr, S. S., Klein, A. M. et al. (2016). A single-cell transcriptomic map of the human and mouse pancreas reveals inter- and intra-cell population structure. Cell Syst. 3, 346-360.e4. doi:10.1016/j.cels.2016.08.011 Butler, A., Hoffman, P., Smibert, P., Papalexi, E. and Satija, R. (2018). Integrating
single-cell transcriptomic data across different conditions, technologies, and species. Nat. Biotechnol. 36, 411-420. doi:10.1038/nbt.4096
Byrnes, L. E., Wong, D. M., Subramaniam, M., Meyer, N. P., Gilchrist, C. L., Knox, S. M., Tward, A. D., Ye, C. J. and Sneddon, J. B. (2018). Lineage dynamics of murine pancreatic development at single-cell resolution. Nat. Commun. 9, 3922. doi:10.1038/s41467-018-06176-3
Collombat, P., Mansouri, A., Hecksher-Sorensen, J., Serup, P., Krull, J., Gradwohl, G. and Gruss, P. (2003). Opposing actions of Arx and Pax4 in endocrine pancreas development. Genes Dev. 17, 2591-2603. doi:10.1101/gad. 269003
Collombat, P., Hecksher-Sørensen, J., Broccoli, V., Krull, J., Ponte, I., Mundiger, T., Smith, J., Gruss, P., Serup, P. and Mansouri, A. (2005). The simultaneous loss of Arx and Pax4 genes promotes a somatostatin-producing cell fate specification at the expense of the alpha- and beta-cell lineages in the mouse endocrine pancreas. Development 132, 2969-2980. doi:10.1242/dev. 01870
De Vas, M. G., Kopp, J. L., Heliot, C., Sander, M., Cereghini, S. and Haumaitre, C. (2015). Hnf1b controls pancreas morphogenesis and the generation of Ngn3+ endocrine progenitors. Development 142, 871-882. doi:10.1242/dev.110759 Fang, Z., Weng, C., Li, H., Tao, R., Mai, W., Liu, X., Lu, L., Lai, S., Duen, Q.,
Alvarez, C. et al. (2019). Single-cell heterogeneity analysis and CRISPR screen identify keyβ-cell-specific disease genes. Cell Rep. 26, P3132-3144.E7. doi:10. 1016/j.celrep.2019.02.043
Grapin-Botton, A., Seymour, P. A. and Gradwohl, G. (2015). Pairing-up SOX to kick-start beta cell genesis. Diabetologia 58, 859-861. doi:10.1007/s00125-015-3539-2
Grü n, D. and Van Oudenaarden, A. (2015). Design and analysis of single-cell sequencing experiments. Cell 163, 799-810. doi:10.1016/j.cell.2015.10.039 Grü n, D., Lyubimova, A., Kester, L., Wiebrands, K., Basak, O., Sasaki, N.,
Clevers, H. and Van Oudenaarden, A. (2015). Single-cell messenger RNA sequencing reveals rare intestinal cell types. Nature 525, 251-255. doi:10.1038/ nature14966
Gu, G., Dubauskaite, J. and Melton, D. A. (2002). Direct evidence for the pancreatic lineage: NGN3+ cells are islet progenitors and are distinct from duct progenitors. Development 129, 2447-2457.
Huang, H., Lu, F.-I., Jia, S., Meng, S., Cao, Y., Wang, Y., Ma, W., Yin, K., Wen, Z., Peng, J. et al. (2007). Amotl2 is essential for cell movements in zebrafish embryo and regulates c-Src translocation. Development 134, 979-988. doi:10.1242/dev. 02782
Imai, Y., Patel, H. R., Hawkins, E. J., Doliba, N. M., Matschinsky, F. M. and Ahima, R. S. (2007). Insulin secretion is increased in pancreatic islets of neuropeptide Y-deficient mice. Endocrinology 148, 5716-5723. doi:10.1210/en. 2007-0404
Johansson, K. A., Dursun, U., Jordan, N., Gu, G., Beermann, F., Gradwohl, G. and Grapin-Botton, A. (2007). Temporal control of Neurogenin3 activity in pancreas progenitors reveals competence windows for the generation of different endocrine cell types. Dev. Cell 12, 457-465. doi:10.1016/j.devcel.2007.02.010 Katoh, Y. and Katoh, M. (2007). Comparative genomics on PROM1 gene encoding
stem cell marker CD133. Int. J. Mol. Med. 19, 967-970. doi:10.3892/ijmm. 19.6.967
Kim, Y. H., Larsen, H. L., Rué, P., Lemaire, L. A., Ferrer, J. and Grapin-Botton, A. (2015). Cell cycle-dependent differentiation dynamics balances growth and endocrine differentiation in the pancreas. PLoS Biol. 13, e1002111. doi:10.1371/ journal.pbio.1002111
Kolodziejczyk, A. A., Kim, J. K., Svensson, V., Marioni, J. C. and Teichmann, S. A. (2015). The technology and biology of single-cell RNA sequencing. Mol. Cell 58, 610-620. doi:10.1016/j.molcel.2015.04.005
Kowalczyk, M. S., Tirosh, I., Heckl, D., Rao, T. N., Dixit, A., Haas, B. J., Schneider, R. K., Wagers, A. J., Ebert, B. L. and Regev, A. (2015). Single-cell RNA-seq reveals changes in cell cycle and differentiation programs upon aging of hematopoietic stem cells. Genome Res. 25, 1860-1872. doi:10.1101/gr. 192237.115
Krentz, N. A. J., Van Hoof, D., Li, Z., Watanabe, A., Tang, M., Nian, C., German, M. S. and Lynn, F. C. (2017). Phosphorylation of NEUROG3 links endocrine differentiation to the cell cycle in pancreatic progenitors. Dev. Cell 41, 129-142.e6. doi:10.1016/j.devcel.2017.02.006
Krentz, N. A. J., Lee, M. Y. Y., Xu, E. E., Sproul, S. L. J., Maslova, A., Sasaki, S. and Lynn, F. C. (2018). Single-cell transcriptome profiling of mouse and hESC-derived pancreatic progenitors. Stem Cell Rep. 11, 1551-1564. doi:10.1016/j. stemcr.2018.11.008
TECHNIQUES AND RESOURCES Development (2019) 146, dev173716. doi:10.1242/dev.173716
DEVEL
O
Larsen, H. L., Martı́n-Coll, L., Nielsen, A. V., Wright, C. V. E., Trusina, A., Kim, Y. H. and Grapin-Botton, A. (2017). Stochastic priming and spatial cues orchestrate heterogeneous clonal contribution to mouse pancreas organogenesis. Nat. Commun. 8, 605. doi:10.1038/s41467-017-00258-4 Lawlor, N., George, J., Bolisetty, M., Kursawe, R., Sun, L., Sivakamasundari, V.,
Kycia, I., Robson, P. and Stitzel, M. L. (2017). Single-cell transcriptomes identify human islet cell signatures and reveal cell-type-specific expression changes in type 2 diabetes. Genome Res. 27, 208-222. doi:10.1101/gr.212720.116 Lee, M. S., Jun, D.-H., Hwang, C.-I., Park, S. S., Kang, J. J., Park, H.-S., Kim, J.,
Kim, J. H., Seo, J.-S. and Park, W.-Y. (2006). Selection of neural differentiation-specific genes by comparing profiles of random differentiation. Stem Cells. 24, 1946-1955. doi:10.1634/stemcells.2005-0325
Li, J., Klughammer, J., Farlik, M., Penz, T., Spittler, A., Barbieux, C., Berishvili, E., Bock, C. and Kubicek, S. (2016). Single-cell transcriptomes reveal characteristic features of human pancreatic islet cell types. EMBO Rep. 17, 178-187. doi:10.15252/embr.201540946
Magenheim, J., Klein, A. M., Stanger, B. Z., Ashery-Padan, R., Sosa-Pineda, B., Gu, G. and Dor, Y. (2011). Ngn3(+) endocrine progenitor cells control the fate and morphogenesis of pancreatic ductal epithelium. Dev. Biol. 359, 26-36. doi:10. 1016/j.ydbio.2011.08.006
Marty-Santos, L. and Cleaver, O. (2016). Pdx1 regulates pancreas tubulogenesis and E-cadherin expression. Development 143, 101-112. doi:10.1242/dev.126755 Mcgrath, P. S., Watson, C. L., Ingram, C., Helmrath, M. A. and Wells, J. M. (2015). The basic helix-loop-helix transcription factor NEUROG3 is required for development of the human endocrine pancreas. Diabetes 64, 2497-2505. doi:10.2337/db14-1412
Miyatsuka, T., Kosaka, Y., Kim, H. and German, M. S. (2011). Neurogenin3 inhibits proliferation in endocrine progenitors by inducing Cdkn1a. Proc. Natl. Acad. Sci. USA 108, 185-190. doi:10.1073/pnas.1004842108
Mojallal, M., Zheng, Y., Hultin, S., Audebert, S., Van Harn, T., Johnsson, P., Lenander, C., Fritz, N., Mieth, C., Corcoran, M. et al. (2014). AmotL2 disrupts apical-basal cell polarity and promotes tumour invasion. Nat. Commun. 5, 4557. doi:10.1038/ncomms5557
Muraro, M. J., Dharmadhikari, G., Grü n, D., Groen, N., Dielen, T., Jansen, E., Van Gurp, L., Engelse, M. A., Carlotti, F., De Koning, E. J. P. et al. (2016). A single-cell transcriptome atlas of the human pancreas. Cell Syst. 3, 385-394.e3. doi:10.1016/j.cels.2016.09.002
Napolitano, T., Avolio, F., Courtney, M., Vieira, A., Druelle, N., Ben-Othman, N., Hadzic, B., Navarro, S. and Collombat, P. (2015). Pax4 acts as a key player in pancreas development and plasticity. Semin. Cell Dev. Biol. 44, 107-114. doi:10. 1016/j.semcdb.2015.08.013
Pan, F. C. and Wright, C. (2011). Pancreas organogenesis: from bud to plexus to gland. Dev. Dyn. 240, 530-565. doi:10.1002/dvdy.22584
Pan, F. C., Bankaitis, E. D., Boyer, D., Xu, X., Van De Casteele, M., Magnuson, M. A., Heimberg, H. and Wright, C. V. E. (2013). Spatiotemporal patterns of multipotentiality in Ptf1a-expressing cells during pancreas organogenesis and injury-induced facultative restoration. Development 140, 751-764. doi:10.1242/ dev.090159
Petersen, M. B. K., Azad, A., Ingvorsen, C., Hess, K., Hansson, M., Grapin-Botton, A. and Honoré, C. (2017). Single-cell gene expression analysis of a human ESC model of pancreatic endocrine development reveals different paths to beta-cell differentiation. Stem Cell Rep. 9, 1246-1261. doi:10.1016/j.stemcr.2017. 08.009
Petzold, K. M. and Spagnoli, F. M. (2012). A system for ex vivo culturing of embryonic pancreas. J. Vis. Exp. e3979. doi:10.3791/3979
Pound, L. D., Oeser, J. K., O’brien, T. P., Wang, Y., Faulman, C. J., Dadi, P. K., Jacobson, D. A., Hutton, J. C., Mcguinness, O. P., Shiota, M. et al. (2013). G6PC2: a negative regulator of basal glucose-stimulated insulin secretion. Diabetes 62, 1547-1556. doi:10.2337/db12-1067
Proszynski, T. J. and Sanes, J. R. (2013). Amotl2 interacts with LL5β, localizes to podosomes and regulates postsynaptic differentiation in muscle. J. Cell Sci. 126, 2225-2235. doi:10.1242/jcs.121327
Qiu, W.-L., Zhang, Y.-W., Feng, Y., Li, L.-C., Yang, L. and Xu, C.-R. (2017a). Deciphering pancreatic islet β cell and α cell maturation pathways and characteristic features at the single-cell level. Cell Metab. 25, 1194-1205.e4. doi:10.1016/j.cmet.2017.04.003
Qiu, X., Mao, Q., Tang, Y., Wang, L., Chawla, R., Pliner, H. A. and Trapnell, C. (2017b). Reversed graph embedding resolves complex single-cell trajectories. Nat. Methods 14, 979-982. doi:10.1038/nmeth.4402
Qiu, X., Hill, A., Packer, J., Lin, D., Ma, Y.-A. and Trapnell, C. (2017c). Single-cell mRNA quantification and differential analysis with Census. Nat. Methods 14, 309-315. doi:10.1038/nmeth.4150
Schild, C., Hahn, D., Schaller, A., Jackson, C. B., Rothen-Rutishauser, B., Mirkovitch, J. and Nuoffer, J.-M. (2014). Mitochondrial leucine tRNA level and PTCD1 are regulated in response to leucine starvation. Amino Acids 46, 1775-1783. doi:10.1007/s00726-014-1730-2
Schnuriger, A., Dominguez, S., Guiguet, M., Harfouch, S., Samri, A., Ouazene, Z., Slama, L., Simon, A., Valantin, M.-A., Thibault, V. et al. (2009). Acute hepatitis C in HIV-infected patients: rare spontaneous clearance correlates with weak memory CD4 T-cell responses to hepatitis C virus. AIDS 23, 2079-2089. doi:10.1097/QAD.0b013e328330ed24
Segerstolpe, A., Palasantza, A., Eliasson, P., Andersson, E.-M., Andréasson, A.-C., Sun, X., Picelli, S., Sabirsh, A., Clausen, M., Bjursell, M. K. et al. (2016). Single-cell transcriptome profiling of human pancreatic islets in health and type 2 diabetes. Cell Metab. 24, 593-607. doi:10.1016/j.cmet.2016.08.020
Seymour, P. A., Freude, K. K., Tran, M. N., Mayes, E. E., Jensen, J., Kist, R., Scherer, G. and Sander, M. (2007). SOX9 is required for maintenance of the pancreatic progenitor cell pool. Proc. Natl. Acad. Sci. USA 104, 1865-1870. doi:10.1073/pnas.0609217104
Shih, H. P., Kopp, J. L., Sandhu, M., Dubois, C. L., Seymour, P. A., Grapin-Botton, A. and Sander, M. (2012). A Notch-dependent molecular circuitry initiates pancreatic endocrine and ductal cell differentiation. Development 139, 2488-2499. doi:10.1242/dev.078634
Sleeman, M. W., Wortley, K. E., Lai, K.-M. V., Gowen, L. C., Kintner, J., Kline, W. O., Garcia, K., Stitt, T. N., Yancopoulos, G. D., Wiegand, S. J. et al. (2005). Absence of the lipid phosphatase SHIP2 confers resistance to dietary obesity. Nat. Med. 11, 199-205. doi:10.1038/nm1178
Sosa-Pineda, B., Chowdhury, K., Torres, M., Oliver, G. and Gruss, P. (1997). The Pax4 gene is essential for differentiation of insulin-producing beta cells in the mammalian pancreas. Nature 386, 399-402. doi:10.1038/386399a0
Stanescu, D. E., Yu, R., Won, K.-J. and Stoffers, D. A. (2017). Single cell transcriptomic profiling of mouse pancreatic progenitors. Physiol. Genomics 49, 105-114. doi:10.1152/physiolgenomics.00114.2016
Street, K., Risso, D., Fletcher, R. B., Das, D., Ngai, J., Yosef, N., Purdom, E. and Dudoit, S. (2018). Slingshot: cell lineage and pseudotime inference for single-cell transcriptomics. BMC Genomics 19, 477. doi:10.1186/s12864-018-4772-0
Tirosh, I., Izar, B., Prakadan, S. M., Wadsworth, M. H., Treacy, D., Trombetta, J. J., Rotem, A., Rodman, C., Lian, C., Murphy, G. et al. (2016). Dissecting the multicellular ecosystem of metastatic melanoma by single-cell RNA-seq. Science 352, 189-196. doi:10.1126/science.aad0501
Veres, A., Faust, A. L., Bushnell, H. L., Engquist, E. N., Kenty, J. H.-R., Harb, G., Poh, Y.-C., Sintov, E., Gü rtler, M., Pagliuca, F. W., Peterson, Q. P., Melton, D. A. (2019). Charting cellular identity during human in vitroβ-cell differentiation. Nature 569, 368-373. doi:10.1038/s41586-019-1168-5
Wang, Y. J., Schug, J., Won, K.-J., Liu, C., Naji, A., Avrahami, D., Golson, M. L. and Kaestner, K. H. (2016). Single-Cell Transcriptomics of the Human Endocrine Pancreas. Diabetes 65, 3028-3038. doi:10.2337/db16-0405
Xin, Y., Dominguez Gutierrez, G., Okamoto, H., Kim, J., Lee, A.-H., Adler, C., Ni, M., Yancopoulos, G. D., Murphy, A. J. and Gromada, J. (2018). Pseudotime ordering of single humanβ-cells reveals states of insulin production and unfolded protein response. Diabetes 67, 1783-1794. doi:10.2337/db18-0365
Xin, Y., Kim, J., Okamoto, H., Ni, M., Wei, Y., Adler, C., Murphy, A. J., Yancopoulos, G. D., Lin, C., Gromada, J. et al. (2016). RNA sequencing of single human islet cells reveals type 2 diabetes genes. Cell Metab. 24, 608-615. doi:10.1016/j.cmet.2016.08.018
Yao, J., Wang, X. Q., Li, Y. J., Shan, K., Yang, H., Wang, Y. N. Z., Yao, M. D., Liu, C., Li, X. M., Shen, Y. et al. (2016). Long non-coding RNA MALAT1 regulates retinal neurodegeneration through CREB signaling. EMBO Mol. Med. 8, 1113. doi:10.15252/emmm.201606749
Yoshikawa, M. and Fujii, Y. R. (2016). Human ribosomal RNA-derived resident microRNAs as the transmitter of information upon the cytoplasmic cancer stress. Biomed. Res. Int. 2016, 7562085. doi:10.1155/2016/7562085
Zhou, Q., Law, A. C., Rajagopal, J., Anderson, W. J., Gray, P. A. and Melton, D. A. (2007). A multipotent progenitor domain guides pancreatic organogenesis. Dev. Cell 13, 103-114. doi:10.1016/j.devcel.2007.06.001