The effect of acidosis on the labelling of
urinary ammonia during
infusion of [amide-15N]glutamine in human subjects
BY J. C. WATERLOW’, A.A. JACKSON’, M .H . N. GOLDEN3*, F. JAHOORS?, G. SUTTOW A N D E. B. FERN4
Department of Public Health and Policy, London School of Hygiene and Tropical Medicine, Keppel Street, London WClE 7HT
Institute of Human Nutrition, University of Southampton, Bassett Crescent East, Southampton SO9 3TU
Tropical Metabolism Research Unit, University of West Indies, Jamaica, West Indies Nestec Ltd, Vevey, Switzerland
(Received 15 July 1993 - Revised 6 October 1993 - Accepted 2 November 1993)
In three experiments [amide-15NJglutamine was infused intravenously in male volunteers. After 4-8 h of infusion acidosis was achieved by an oral dose of CaCl, (1 mmol/kg). In one subject acidosis was maintained for 5 d. The acid load produced an approximately 3-fold increase in urinary NH, excretion, with a small (approximately 20%) and transient increase in the isotope abundance of urinary NH,. Estimates of glutamine production rate (flux) were obtained in two experiments. There was no evidence that it was increased in acidosis. The extra NH, production by the kidney represented only a very small part, about 3%, of the total glutamine production rate.
Acidosis : Glutamine metabolism: Urinary ammonia
The principal objective of the work reported here was to examine the effect of acidosis on the labelling of urinary NH, during infusion of an amino acid labelled with 15N. In the endproduct method for measuring whole-body protein turnover with a I5N-labelled amino acid, N flux is determined from the isotope abundance in urinary urea or NH, or both (Waterlow et al. 1978; Fern & Garlick, 1983; Fern et al. 1985a, b). The method has been applied in a number of situations, for example in premature babies (Catzeflis et al. 1985), in malnourished children (Jackson et al. 1983) and adults (Soares et al. 1991), in pregnant women (de Benoist et al. 1985) and in the elderly (Golden & Waterlow, 1977).
Being simple and non-invasive, this method is particularly suitable for application to people who are ill. Because many sick patients have some degree of acidosis it is important to know whether and how far acidosis p e r se alters the labelling of urinary NH,. To the extent that this occurs, it would introduce an error into the calculation of turnover rate.
In this work we have chosen to use as the tracer glutamine (GLN) labelled in the amide
(C-5)-NY rather than [15N]glycine, which has been more generally used for measurements of protein turnover, because the amide-N of GLN is the major precursor of urinary NH,. Further studies on acidosis with [15N]glycine as tracer will be reported later.
* Present address : Department of Medicine and Therapeutics, University of Aberdeen, Polwarth Building,
t
Present address: Children’s Nutrition Research Center, 1100 Bates, Houston, Texas 77040, USA. Foresterhill, Aberdeen AB9 2ZP.84 J. C. W A T E R L O W A N D O T H E R S
There is a large amount of information in the literature on glutamine metabolism and its relationship to renal NH, production in man (Owen & Robinson, 1963; Pitts & Pilkington, 1966; Tizianello et al. 1978, 1982), sheep (Heitmann & Bergman, 1978), dog (Pitts et al. 1965; Cersosimo et al. 1986; Areas et al. 1987) and the rat (Squires et al. 1976; Schrock &
Goldstein, 1981; Squires & Brosnan, 1983; Welbourne, 1986). However, we know of only three studies on man and none on experimental animals in which glutamine labelled with
15N was used (Darmaun et al. 1986, 1988; Golden et al. 1982), and in none of these was the effect of acidosis examined. Therefore, this work, apart from its immediate objective, provides some further insights into glutamine metabolism in humans in both normal and acidotic states. So far we have concentrated mainly on the effects of acute acidosis, because this is easier to produce experimentally.
We report here the results of two pilot studies, each on a single subject, and results of the main study, in which there were thirteen tests on seven subjects. Pilot 1 was done in London, pilot 2 in Jamaica at the Tropical Metabolism Research Unit and the main study was done in Southampton. In all the tests [5-15N]GLN was infused intravenously for varying periods. In most of the tests CaCl, was used to provoke acidosis (Oster et af. 1975) since NH,C1 may alter the rate of NH, excretion.
The object of pilot 1 was to examine the effect of an acute acid load on the labelling of NH, and urea. In pilot 2 we also looked at the effects of acidosis maintained over 5 d. The purpose of the main study was similar to that of pilot 1, but with a shorter protocol and a larger number of subjects.
M E T H O D S Subjects
All the subjects were healthy male volunteers. The nature and purpose of the experiments were explained to them and ethical approval was given by the respective ethical committees.
ProtocoL
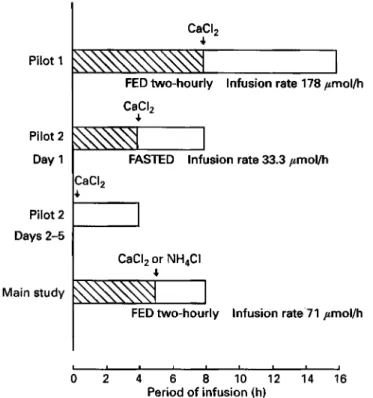
The protocols are summarized in Fig 1.
In pilot 1 the subject was a healthy male aged 65 years, weighing 78 kg. After an overnight fast baseline measurements were made. Intravenous infusion of [5-15N]glutamine (95 atom% excess (APE); Prochem, London) dissolved in sterile saline (9 g NaC1/1) at a rate of 178 ,umol/h was then started and continued for 16 h. Urine was collected hourly and blood samples every 2 h from an indwelling catheter in the antecubital vein opposite to that of the infusion. From the start of the infusion food was given two-hourly as a sandwich providing one-eighth of a total daily intake of 12.5 MJ and 70 g protein. At 8 h, 10 g CaCl, (1.15 mmol/kg) dissolved in water was taken orally, and the infusion continued for a further 8 h.
In pilot 2 the subject was a healthy male aged 37 years, weight 64.5 kg. The study was conducted over 5 d . On each day an intravenous infusion of [5-15N]GLN, 97 APE, in normal saline at a rate of 33.3 ,umol/h was started in the morning after an overnight fast. Water but no food was given during the infusions. On the first day the infusion was continued for 8 h. CaCl, (1 mmol/kg) was ingested at 4 h, and the infusion continued over the next 4 h. Baseline samples of blood and urine were taken before the infusion, and at
0.5 h intervals from 2 to 4 h and from 6 to 8 h. Over the next
4
d the subject ingested 2 mmol CaCl,/kg, per d divided into four doses. The protocol was the same as for the first day, except that the infusion was continued for only 4 h.In the main experiment there were seven subjects, four of whom had one test only, in which acidosis was produced by CaCl, (1 mmol/kg) given orally. One other subject had a second test with CaCl,, as well as a control infusion with no acid load. Two others had
Pilot 1 Pilot 2 Day 1 Pilot 2 Days 2-5 Main study
FED two-hourly Infusion rate 178 pmol/h
I
I
C ~ C I ,+
FASTED Infusion rate 33.3 pmollh
I
b
I 1 1 1 0 2 4 6 8 10 12 14 16 Period of infusion (h)Fig. 1. Summary of protocols for glutamine infusions used for studies with human subjects.
(m),
before induction of acidosis; (O), after induction of acidosis. All infusions started after an overnight fast.additional tests in which acidosis was provoked by NH,C1 (2 mmol/kg), followed by control infusions without acidosis. In these three subjects who had repeated tests the average interval between tests was 1 month (range 0.5-3 months).
The protocol was similar to that of pilot 1, but of shorter duration. The subjects were fasted overnight. Baseline samples were taken, and then an intravenous infusion of [5- “NIGLN, 96 APE, at a rate of 71 pmollh was started. Blood samples were collected hourly from an indwelling catheter in the contralateral antecubital vein, and urine samples were collected every 0.5 h. Every 2 h the subject took
a
drink ofa
milk-based mixture (Ensure) which provided 830kJ
and 7 g protein. After 5 h infusion CaC1, (67 mmol; eight tests) or NH,Cl (132 mmol; two tests) was ingested and the infusion continued for a further 3 h.Analytical methoh
Blood pH was measured in the Intensive Care Unit with an accuracy of at least 0.05 pH units. Urinary pH, titratable activity and concentrations of NH, and urea were measured by standard methods (Kaplan, 1965). For determination of isotope abundance in the urinary endproducts a sample of urine was made alkaline and the NH, removed by aeration and collected in dilute acid. After removal of NH, the sample was brought to pH 5 and incubated with urease (EC 3.5.1 , 5 ; Sigma) for 30 min. After alkalinization the NH, liberated was collected as before.
In pilot 1 the isotope abundance of the NH, collected was measured in a modified single- collector mass spectrometer (MS 20; AEI, Manchester). In pilot 2 it was measured in a
dual-collector mass spectrometer (VG Micromass 602C; VG Isogas, Winsford, Ches.), and in the main study a triple collector Sira 10 (VG Isogas) was used.
86 J. C. W A T E R L O W A N D O T H E R S
Plasma GLN concentration was measured in pilot 1 only, by standard ion-exchange chromatography.
The isotope abundance of plasma GLN was measured after liberation of the amide-N by glutaminase (EC 3 . 5 . 1 .2) as previously described by Golden et al. (1982), but only in pilot 2 were these measurements satisfactory. In pilot 1 the samples had to be stored deep-frozen
at -20" for 3 years because the MS 20 mass spectrometer, the only instrument available at that time, was not sensitive enough for these measurements. During this time glutamine was evidently hydrolysed. When calculating abundance it was assumed that all the 15N in the sample of plasma was derived from the amide-N of glutamine. Abundance was then estimated as pmol 15N per ml plasma divided by pmol GLN per ml plasma, as previously determined by chromatography. However, it was evident that some of the NH, was lost during the prolonged period of storage, since the calculated APE of the precursor glutamine was lower than that of the product NH,, which is impossible. Nevertheless, the results should be comparable within the experiment.
R E S U L T S
Acidosis
The urinary data are summarized in Table 1 . The values before acidosis relate to the last 2-23 h before the acid load; 1 h was then allowed for adjustment and the data for that 1 h are not included in Table 1.
Table 1 shows that a single dose of CaCl, produced an acidosis which, however, was compensated since there were no significant falls in blood pH or pC0, (data not shown). The acidosis with NH,Cl was slightly more intense than that with CaCl, because the dose was larger. In the main experiment there was a wide variation between subjects in excretion of acid and NH, but each subject was fairly consistent from one period to another. In chronic acidosis blood pC0, fell from a baseline value of 41 mmHg to a mean value of
29 mmHg on days 3-5. There was no fall in blood pH.
Labelling of urinary ammonia
Fig. 2 shows the time-course of the labelling of urinary NH, in the main experiment. The rise towards a plateau was slower than that reported in the studies of Golden et al. (1982) in which plateau was achieved in 2-3 h. After the acid load there was an increase, of the order of 20-25 YO, in the APE of NH,, with a time-lag of about 2 h. This increase implies that either the precursor glutamine was more highly labelled or a smaller proportion of urinary NH, was being derived from unlabelled precursors (see p. 89).
The proportion of the dose of 15N excreted in NH, represents the proportion of the flux of GLN-amide-N excreted in this endproduct. It is evident from Table 2 that even at the peak of acidosis renal NH, production accounted for only a small proportion of the GLN flux. In pilot 1 we have no explanation for the higher rate of excretion of "N expressed as a proportion of the dose, unless it was that this subject was almost twice as old as any of the others.
Urea
Urea excretion and labelling were measured in pilot 1 and the main study but not in pilot
2. In pilot 1 excretion decreased significantly after the establishment of acidosis, from a mean of 19.1 mmol/h before acidosis to 11.2 mmol/h after acidosis. This was in keeping with the findings of others (e.g. Haussinger et al. 1984; Monson et al. 1984) that acidosis
87
Table 1. Urine p H , titratable acid and ammonia excretion before and after induction of
acidosis in human subjects*
Titratable acid NH,
PH (mmol/h) (mmol/h)
Before After Before After Before After
Acute acidosis? Pilot 1 6.72 4.93 0.28 0.90 1.46 2.32 Pilot 2 First day 7.06 4.93 0.36 1.69 045 153 Main experiment CaC1,: Mean 7.02 5.22 - 0.08 1.75 0.94 2.36 SD 0.29 0.42 0.39 0.74 0.28 0.82 NH,Cl 6.96 5.14 -0.36 2.54 1.30 3.1 5 Controls 7.07 7.045 0.08 0.02 0 85 099 Chronic acidosis Pilot 2, days 2-5 4.92 1.36 1.95
*
For details of procedures, see pp. 84-86.t
For pilots 1 and 2 and main experiment respectively measurements were made 4, 2 and 2 5 h before and 4, 2 and 2 h after acidosis, with a gap of 1 ,2 and 1 h. For the controls measurements were made at times equivalent to those in experiments in which acid was given.0 2 4 6 8
Time period (h)
Fig. 2. Main experiment. Isotope enrichment of urinary ammonia during 8 h infusion of [2-”N]glutamine. Each period was 30 min. Because there was much variation between subjects, for each subject the mean enrichment in samples 9 (4.5 h) and 10 (5.0 h) was taken as 100, and the enrichment in samples at earlier and later times expressed as a percentage of this value. Values are means and between-subject standard deviations represented by vertical bars. For details of procedures, see pp. 84-86.
in which the acid load was not followed by any significant change in the urea output. There was much variation between subjects, but no rank order correlation between the rate of urea excretion and the extent of acidosis, as judged by urinary pH, titratable acid or NH, output.
The time-course of the labelling of urea fits that which would be expected if the urea pool
88 J. C . W A T E R L O W A N D OTHERS
Table 2. Percentage of the dose of ''N excretedlh in urinary ammonia before and after
acute acidosis and during chronic acidosis in human subjects*
Before acidosis After acidosis
Periodt(h) Percentage of dose (/h) Periodt(h) Percentage of dose (/h) Acute acidosis Pilot 1 6-8 2.30 9-12 5.54 12-15 753 Pilot 2, day 1 2 4 0.83 6-8 3.30 Main expe&ent$ 4 - 5 053 6-7 1.29 7-8 1.62 Chronic acidosis
days 2-5 (data for 2-4 3.1
day 4 missing)
* For details of procedures, see pp. 84-86.
t
From t = 0 at start of the infusion. $ Results with CaCI, and NH,CI combined.Fig. 3. Pilot 1. 15N (atom% excess) in plasma glutamine amide-N (0-0) and in urinary ammonia (0-0) before and after the acid load in a male volunteer. For details of procedures, see pp. 8 4 8 6 .
Glutamine turnover
Plasma GLN concentration was measured by chromatography in pilot 1. It did not change with the induction of acidosis. As mentioned on p. 86, it is likely that hydrolysis and loss during prolonged storage resulted in an underestimate of the labelling of GLN, but there is no reason why the values should not be compared within the experiment. The apparent APE of GLN reached a plateau in 8 h (Fig. 3) compared with 2-3 h in the studies of Golden
et al. (1982) and Darmaun et al. (1986). The interesting point is that the acidosis had no effect on the APE of GLN, but, as in the main study, there was a sharp rise in the APE of NH,.
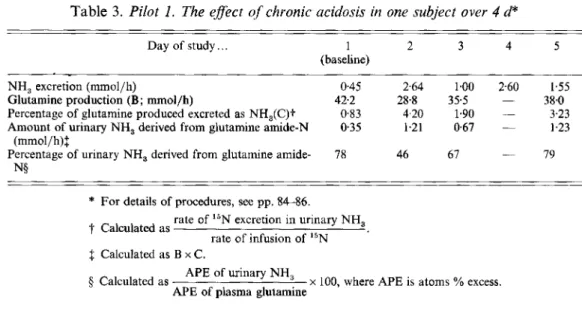
Results from pilot 2 are shown in Table 3. In this experiment the more prolonged acidosis led to a fall in GLN production rate, most evident on day 2. Nevertheless, although there was a several-fold increase in the amount of urinary NH, derived from GLN, it still represented only 4 % of the glutamine flux.
Table 3. Pilot 1. The effect of chronic acidosis in one subject over 4 d*
Day of study.. . 1 2 3 4 5
(baseline)
NH, excretion (mmol/h) 0.45 2.64 1.00 2.60 1.55
Glutamine production (B; mmol/h) 42.2 28.8 355 - 38.0
Percentage of glutamine produced excreted as NH,(C)t 0.83 4.20 1.90 - 3.23 Amount of urinary NH, derived from glutamine amide-N 0.35 1.21 0.67 - 1.23
Percentage of urinary NH, derived from glutamine amide- (mmol/h)S 78 46 67 - 79 N§
* For details of procedures, see pp. 84-86.
t
Calculated asf Calculated as B x C .
rate of 15N excretion in urinary NH, rate of infusion of I5N
APE of urinary NH, APE of plasma glutamine
5 Calculated as x 100, where APE is atoms % excess.
D I S C U S S I O N
The initial objective of these experiments was to examine the effect of acidosis on the labelling of urinary NH, when the label was derived from GLN amide-N, the main precursor of NH,. In acute acidosis a 3-fold increase in the rate of NH, output was accompanied by a transient increase in isotope abundance, which at its peak was 20% above the level before acidosis (Fig. 3). If acidosis altered the pattern of precursors of NH,, so that less was derived from GLN and more from other amino acids such as glycine, one would expect the isotope abundance to decrease. The literature on this point is conflicting. Owen & Robinson (1963) found no change in acidosis in the proportion of NH, derived from GLN, whereas according to Tizianello et al. (1982) ‘in man, at an early stage of metabolic acidosis, glutamine fails to sustain its role as the nearly exclusive precursor of ammonia’. Our results tend to support those of Owen & Robinson (1963).
The question has been posed : what are the sources of the extra urinary NH, in acidosis (Goldstein et al. 1980)? If the precursors remain essentially unchanged, a 3-fold increase in NH, output will represent a 3-fold increase in the rate of GLN extraction by the kidney. Thus, in the dog, Areas et al. (1987) found a linear relationship between renal GLN extraction and urinary NH, production. Similar results have been recorded by others; in man by Owen & Robinson (1963) and Tizianello et al. (1978), in sheep by Heitmann &
Bergman (1978), in the dog by Lotspeich (1967) and Cersosimo et al. (1986) and in the rat by Goldstein et al. (1980) and Welbourne (1988).
The results in Table 2 indicate the proportion of the glutamine flux extracted by the kidney for NH, formation, but they do not answer the key question: whether the increased extraction is accompanied by an increase in flux. In the main experiment, admittedly flawed by technical problems, no evidence of an effect of acidosis on glutamine labelling and, hence, on production rate was found (Fig. 3). In pilot 2 the production rate actually fell with acidosis (Table 3). We conclude that the flux is so large in relation to NH, production that no increase is necessary.
It is true that our values for GLN production rate are twice as high as those found by Darmaun et al. (1986), Dutra et al. (1992) and Matthews et al. (1993). Darmaun et al. (1986) suggested as a possible reason that in their studies arterialized blood was used for
90 J. C. W A T E R L O W A N D O T H E R S
Table 4. Eflect of acidosis on inter-organJEux rates (mmol/h per whole animal; 50 kg) in the sheep vrom Heitmann & Bergman, 1978)
Uptake Release Net
Viscera and liver
Normal V,, 9 4 V,, 6 4
+
3.0 MetabolismAcidotic V,, 10.8 V,,8.1 +2,7 Metabolism
Normal V,, 2.4 V,, 4.7 -2.3 Synthesis
Acidotic V,, 0.9 V,, 4.7 - 3.8 Synthesis
Muscle and peripheral tissues
Kidney Normal Acidotic Production rate = V,,
+
V,, +V,, Normal = 12.3 Acidotic = 13.1 V,, 0.5 V,, 1.2 - 0 7 Urine V,, 1.6 V,, 0.3 +2.3 UrineV,,, V,,, V,,, flux from viscera, muscle and kidney respectively to central pool; V,,, V,,, V,,, flux from central pool to viscera, muscle and kidney respectively.
sampling, but recorded arterio-venous differences in GLN concentration in peripheral blood (e.g. Tizianello et al. 1978) are not enough to explain the discrepancy, which clearly needs further investigation. However, even if our values for GLN flux are too high by a factor of 2, still only a small proportion of the flux would be used for NH, production.
The absence of a change with acute acidosis in whole-body GLN flux does not mean that there is no change in
GLN
kinetics. Darmaun et al. (1986) took blood samples every 15 min, and achieved plateau labelling in about 2 h. Assuming that the rise to plateau could be represented by a single exponential, they calculated a rate-constant of 0.025 min. From this and the production rate they estimated an exchangeable pool size forG L N
of207
ymollkg. About two-thirds of this pool could be accounted for by extracellularGLN.
Darmaun et al. (1986) pointed out that the intracellular pool was some fifty times greater than the calculated ‘exchangeable’ pool and, therefore, postulated that there was a very large ‘immiscible’ pool, probably mostly in muscle. In reality, however, this pool need not be regarded either as immiscible, or as a sink from which there is no return. The pool is simply so large and turning over
so
slowly that the effect of it does not show up in a short- term isotope-abundance curve ; it behaves like muscle in measurements of whole-body protein turnover.In man we do not have enough data to quantify the absolute exchanges between tissues. Arterio-venous differences only give the net exchanges. The only studies we know of in which isotopic measurements were combined with arterio-venous differences to allow estimates of absolute rates of uptake and release are those of Heitman & Bergmann (1978) in the sheep. Their findings are summarized in Table 4. If a steady-state is assumed in each pool, the net values of influx-efflux, if negative, must be balanced by de novo synthesis; if positive, by net disposal or metabolism. It seems that the main effects of acidosis are : in the peripheral tissues a decrease in uptake balanced by an increase in net synthesis; in the viscera an increase in
GLN
release, with a small decrease in disposal; and in the kidney a substantial switch from net release to net uptake.In man the information summarized by Darmaun et al. (1986) indicates that GLN uptake by the kidney and release by muscle are of the same order (30 pmollkg per h). This is the reason for the question posed earlier about the sources of extra NH, in acidosis.
However, the high rate of GLN flux allows flexibility in the system, and if the results from sheep apply to man, the increase in GLN uptake by the kidney is achieved by a series of redistributions of components of the flux, each quite small in itself. We do not propose to discuss possible biochemical mechanisms for achieving these adjustments, because we have no new observations that bear on this subject.
The authors are grateful to Dr Pat Lund for help with the preparation of ammonia samples from glutamine by reaction with glutaminase.
REFERENCES
Areas, J., Balian, S., Slemmer, D., Belledonne, M. & Preuss, H. G. (1987). Renal ammoniagenesis following glutamine loading in intact dogs during acute metabolic acid-base perturbations. Clinical Science 72, 61-69. Catzeflis, C., Schiitz, Y., Micheli, J. L., Welsch, C., Amaud, M. J. & Jequier, E. (1985). Whole body protein
synthesis and energy expenditure in very low birth weight infants. Pediatric Research 19, 67F687.
Cersosimo, E., Williams, P. E., Radosevich, P. M., Hoxworth, B. T., Lacy, W. W. & Abumrad, N. N. (1986). Role of glutamine in adaptations in nitrogen metabolism during fasting. American Journal of Physiology 250, Darmaun, D., Matthews, D. E. & Bier, D. M. (1986). Glutamine and glutamate kinetics in humans. American
Journal of Physiology 251, El 17-E126.
Darmaun, D., Matthews, D. E. & Bier, D. M. (1988). Physiological hypercortisolemia increases proteolysis, glutamine and alanine production. American Journal of Physiology 255, E366E373.
de Benoist, B., Jackson, A. A., Hall, J. St E. & Persand, C. (1985). Whole-body protein turnover in Jamaican women during normal pregnancy. Human Nutrition : Clinical Nutrition 39C, 167-1 80.
Dutra, S., Thuillier, F., Darmaun, D., Messing, B., Rongier, M. & Desjeux, J. F. (1992). Protein turnover assessed by leucine and glutamine fluxes in adult coeliac patients. Clinical Nutrition 11, Suppl., SO.
Fern, E. B. & Garlick, P. J. (1983). The rate of nitrogen metabolism in the whole body of man measured with 15N- glycine and uniformly labelled 15N-wheat. Human Nutrition: Clinical Nutrition 37C, 91-107.
Fern, E. B., Garlick, P. J. & Waterlow, J. C. (1985~). The concept of the single body pool of metabolic nitrogen in determining the rate of whole body nitrogen turnover. Human Nutrition: Clinical Nutrition 39C, 85-99. Fern, E. B., Garlick, P. J. & Waterlow, J. C. (19856). Apparent compartmentation of body nitrogen in one human
subject: its consequences in measuring the rate of whole-body protein synthesis with "N. Clinical Science 68, 271-282.
Golden, M. H. N., Jahoor, P. &Jackson, A. A. (1982). Glutamine production rate and its contribution to urinary ammonia in normal man. Clinical Science 62, 299-305.
Golden, M. H. N. & Waterlow, J. C. (1977). Total protein synthesis in elderly people: a comparison of results with ["N] glycine and [14C] leucine. Clinical Science 53, 277-288.
Goldstein, L., Schrock, H. & Cha, C.-J. (1980). Relationship of muscle glutamine production to renal ammonia metabolism. Biochemical Society Transactions 8, 509-510.
Haussinger, D., Gerok, W. & Sies, H. (1984). Hepatic role in pH regulation: role of the intercellular glutamine cycle. Trends in Biochemical Sciences 9, 300-302.
Heitmann, R. N. & Bergman, E. N. (1978). Glutamine metabolism, inter-organ transport and glucogenicity in the sheep. American Journal of Physiology 234, E197-203.
Jackson, A. A., Golden, M. H. N., Byfield, R., Jahoor, F., Royes, J. & Soutter, L. (1983). Whole body protein turnover and nitrogen balance in young children at intakes of protein and energy in the region of maintenance.
Human Nutrition: Clinical Nutrition 37C, 433-446.
Kaplan, A. (1965). Urea nitrogen and urinary ammonia. In MethodF in Clinical Chemistry, vol. 5 , p. 245 [S.
Meites, editor]. New York: Academic Press.
Lotspeich, W. D. (1967). Metabolic aspects of acid-base change. Science 155, 1066.
Matthews, D. E., Marano, M. A. &Campbell, R. G . (1993). Splanchnic bed utilization of glutamine and glutamic acid in humans. American Journal of Physiology 264, E848-E854.
Monson, J. P., Henderson, R. M., Smith, J. A., Iles, R. A., Faus-Deder, M., Carter, N. D., Heath, R., Metcalfe, H. K. & Cohen, R. D. (1984). The mechanism of inhibition of ureogenesis by acidosis. Bioscience Reports 4, 819-825.
Oster, J. R., Hotchkiss, J. L., Carbon, M., Farmer,, M. & Vaamonde, C. (1975). A short duration renal acidification test using calcium chloride. Nephron 14, 281-292.
Owen, E. E. & Robinson, R. R. (1963). Amino acid extraction and ammonia metabolism by the human kidney during the prolonged administration of ammonium chloride. Journal of Clinical Investigation 42, 263-276. Pitts, R. F. & Pilkington, L. A. (1966). The relation between plasma concentrations of glutamine and glycine and
utilization of their nitrogen as sources of urinary ammonia. Journal of Clinical Investigation 45, 86-93. Pitts, R. F., Pilkington, L. A. & DeHaas, J. M. C. (1965). 15N tracer studies on the origin of urinary ammonia in
92 J. C. WATERLOW A N D OTHERS
the acidotic dog with notes on the enzymatic synthesis of labelled glutamic acid and glutamine. Journal of
Clinical Investigation 44, 73 1-745.
Schrock, H. & Goldstein, L. (1981). Interorgan relationships for glutamine metabolism in normal and acidotic rats. American Journal of Physiology 240, E519-525.
Soares, M. J., Piers, L. S., Shetty, P. S., Robinson, S., Jackson, A. A. & Waterlow, J. C. (1991). Basal metabolic rate, body composition and whole-body protein turnover in Indian men with differing nutritional status.
Clinical Science 81, 419425.
Squires, E. J. & Brosnan, J. T. (1983). Measurements of the turnover rate of glutamine in normal and acidotic rats.
Biochemical Journal 210, 277-280.
Squires, E. J., Hall, D. E. & Brosnan, J. T. (1976). Arteriovenous differences for amino acids and lactate across kidneys of normal and acidotic rats. Biochemical Journnl160, 125-128.
Tizianello, A,, De Ferrari, G., Garibotto, G., Acquarone, N., Robando, C. & Ghiggeri, G. M. (1982). Renal ammoniagenesis in an early stage of metabolic acidosis in man. Journal of Clinical Investigation 69, 240-250. Tizianello, A., De Ferrari, G., Garibotto, G. & Gurreri, G. (1978). Effects of chronic renal insufficiency and
metabolic acidosis on glutamine metabolism in man. Clinical Science and Molecular Medicine 55, 391-392. Waterlow, J. C., Golden, M. H. N. & Garlick, P. J. (1978). Protein turnover in man measured with 15N:
comparison of end-products and dose regimes. American Journal of Physiology 235, E165-El74.
Welbourne, T. C. (1986). Effect of metabolic acidosis on hindquarter glutamine and alanine release. Metabolism
35, 614618.
![Fig. 2. Main experiment. Isotope enrichment of urinary ammonia during 8 h infusion of [2-”N]glutamine](https://thumb-eu.123doks.com/thumbv2/123doknet/14916499.660866/5.730.77.654.136.392/main-experiment-isotope-enrichment-urinary-ammonia-infusion-glutamine.webp)