Martine S. Bernstein, Michael C. Costanza, Alfredo Morabia
Division d'~pid~miologie clinique, H6pitaux universitaires de Gen~ve
Section: International comparison of health determinants
I
Physical activity of urban adults: a general
population survey in Geneva
Summary
Objectives: Describing the distribution of physkal activity in populations is of major importance for developing public health campaigns to prevent sedentarism.
Methods: A population-based survey conducted during 1997- 1999 in Geneva, Switzerland, included 3410 randomly selected men (n = t 707} and women (n = 1703), aged 35 to 74 years. Per- centiles Pl0, Ph0, and P90 summarised the distributions of the total energy expenditure and of the percents used in moder- ate intensity activities (3 to 3.9 times the basal metabolism rate (BMR), e,g,, normal walking, household chores), and in high and very high intensity activities (2 4 8MR, e.g., brisk walking, sports}.
Results: The total energy expenditure (median 2929 kca~/day in men, 2212 kcal/day in women) decreased with age. Preva- lence of sedentarism, defined as less than 10% of total energy expended in ~ 4 BMR activities, was 57% in men and 70% in women. Men expended 12% (median) of their tota~ energy in 3 to 3.9 BMR and 8% in 2 4 13MR activities. Corresponding per- centages in women were 11% and 5%. The highest prevalence of sedentarism was in older age, women, and lower socio-eco- nomic status persons,
Conclusion: Most of Geneva population is sedentary. Promot- ing physicN activity shoutd target chffdren, adults and elderiy, and physicai activities which woutd be both attractive and financiaiiy affordable by most people,
Key-words: Energy metabolism - Exercise - H e a l t h s u r v e y s - Leisure activities - Sports - Urban h e a l t h .
Soz.- Pr~ventivmed 46 (2001) 0 4 9 - 0 5 9 0303-8408/011010049-11 $ 1 . 5 0 + 0.20/0 9 Birkh~user Verlag, Basel, 2001
Sedentarism is an independent risk factor for coronary heart disease 1-~, osteoporosis, hip fractures 5-7 and cancer 8. However, the precise amount and intensity of physical activities performed by urban general populations remain elusive.
The total energy expenditure of an individual can be divid- ed into several categories according to the intensity of each activity performed. When sleeping, we expend the basal metabolism rate (BMR). Low intensity activities such as office work, reading, watching television, and walking slow- ly expend less than 3 times the BMR (< 3 BMR). Most hou- sehold chores and professional activities such as locksmith, handy work, electrician, etc., expend 3 to 3.9 BMR. Ex- pending 4 times the BMR and more (_> 4 BMR) are gar- dening activities like digging and carrying loads (4.1 BMR), brisk walking (4.5 BMR), climbing up stairs (6 BMR), heavy construction work (7 BMR), and most sports (6 to 12 BMR). The BMR changes according to gender, age, weight, and height 9, so for each activity the precise amount of ener- gy expended according to these performer characteristics can be calculated.
The present survey of the general adult population of Gene- va describes the total daily energy expenditure, and its dis- tribution in moderate intensity activities (3 to 3.9 BMR), high and very high intensity activities (->4 BMR including those > 6 BMR), and very high intensity activities only (_>6 BMR). Physical activity was assessed using a questionnaire developed and validated in the target population 1~ A sedentary person was defined as someone expending less than 10 percent of their daily total energy expenditure in _> 4 BMR physical activities. This definition of sedentarism, developed in a previous paper 11, was based on the Surgeon General Report suggestion: "an increase in daily expen- diture of approximately 150 kilocalories per day is associ- ated with substantial health benefits and the activity does
50 Section: International comparison of health determinants Bernstein MS, Costanza MC, Morabia A Physical activity of urban adults
not need to be vigorous to achieve benefit ''8. Because the amount of energy expended depends on the BMR of the person, the duration and the intensity of the activity, we transformed the "150 kilocalories" into a percentage of the total energy expenditure. We also evaluated the risk factors for sedentarism in this generally urban population.
Materials and methods
Population and sample recruitment
Geneva (city and county, Switzerland) has a population of about 400000 distributed over 242 km 2 of land. Survey parti- cipants were randomly selected from January 1997 to December 1999 to represent the 89000 men and 98000 women, non-institutionalised adult residents aged 35 to 74 years. Subjects were identified from the official residents' register published each year which includes the first and last name, gender, age, nationality, and address. About 0.5% of the target population was sampled each year. Selected men and women received an information letter asking them to participate in a general population health survey 12. In the case of non-response within two weeks, up to seven phone calls were made at different times of the week including week-ends. Those who could not be contacted after seven attempts were replaced. Systematic checks of the following years' editions of the population list showed that about 90 % of them no longer resided in Geneva. Subjects who refused to participate were not replaced. The recruitment of a poten- tial subject lasted from two weeks to two months.
Data collection
Survey respondents completed at home self-administered questionnaires about physical activity, diet, and general health including socio-demographic data and smoking history. They returned the questionnaires to a mobile epide- miology clinic where trained interviewers checked them for completion and measured the weight (lightly dressed with- out shoes) using a medical scale (precision 0.5 kg) and the height, using a medical gauge (precision 1 cm). Overall, the clinic visit lasted around 20 minutes. Among the persons selected and contacted, the average response rate was 62 %, with 1795 men and 1785 women overall participating in the survey. For the purposes of the present report, all analyses were based on the respondents who had complete data for the variables employed in the multiple logistic regression models described below. Thus, the final study sample in- cluded 1707 men and 1703 women; its distribution was simi- lar to the general population according to age and gender (data not shown).
Soz.- Pr~ventivmed. 46 (2001) 049-059 9 Birkh~user Vedag, Base/, 2001
Age was categorised into the four groups: 35-44, 45-54, 55-64, 65-74 years. Educational level was defined as pri- mary (< nine years of schooling), secondary, and university (13 or more years and Swiss baccaulaureate or equivalent). Country of birth was grouped into Switzerland, Mediterra- nean (Italy, Spain, Portugal) and others (mainly France/Ger- many). Ever cigarette smokers had smoked at least 100 ciga- rettes in their lifetime. Ex-smokers had quit smoking a year or more before their interview. Body mass index (BMI) was computed as measured weight in kilograms divided by the square of measured height in meters. Normal weight, overweight and obesity were defined respectively as BMI < 25 kg/m2; 25 < BMI < 30 kg/m2; BMI >__ 30 kg/m 2.
Diet (food frequency) questionnaire
This instrument was previously developed and validated in the Geneva general population 13,14. It records the diet of the past four weeks and fists 80 groups of food items with a "standard" portion size. Respondents indicate their fre- quency of consumption and if they consumed less, the same, or more, than the standard portion size. Results permit evaluation of the daily total energy intake (kcal), the percent of the total energy provided by macronutrients, and the amount of dietary fiber (g).
Physical activity frequency questionnaire
This instrument measures the total daily, and the activity- specific energy expenditures. It was developed in the Gene- va general population and validated using a heart rate moni- tor 1~ It lists 73 physical activities grouped by general type (e.g., occupational, leisure time, sports, etc.), together with their typical duration. The reference period is the past seven days. About 20 minutes are required for respondents to indi- cate the number of days per week (0 (never) to 7 (every day)), and the number of hours per day (0 to 10 hours time scale with 15 minute increments) that they spent in perform- ing each activity. The duration of sleep is calculated from the reported waking hours. If the total number of hours declared by the respondent is different from 168 hours (7 x 24 hours), a two step correction is made. First, if the dura- tion of sleep is less than 42 hours (six hours per night), it is set to 42 hours; or if it is more than 70 hours (ten hours per night), it is set to 70 hours. (About 2.5% of the initially cal- culated durations of sleep fell in each of these extremes). Second, the total duration for non-sleep activities is calculat- ed and the duration for each non-sleep activity is proportio- nally adjusted so that the corrected duration of sleep plus the non-sleep duration sums to 168 hours. Each listed physical activity was pre-assigned a score indicating its intensity in terms of B M R multiples 9. For example, an activity with a
Bernstein MS, Costanza MC, Morabia A Physical activity of urban adults
Section: International comparison of health determinants 51
3 B M R rating expends three times the energy required by a fasting individual, sleeping. The gender, age, and weight/ height-specific B M R was c~iiculated for each study respon- dent 9.
The daily energy expenditure for a given activity, EEi for
activity i, i 1,... 73, for a particular study participant was next calculated as:
EE~ = (BMR multiple for activity) i) X (duration
of activity i, in minutes per day) X (BMR of participant in kcal per minute).
The daily total energy expenditure, EE, for the study parti-
cipant was then obtained as the sum of the study partici- pant's activity-specific EEi over all 73 physical activities:
73 EE = ~, EEi .
i = l
The various physical activities were grouped according to their intensity. The two main categories were: 1) Moderate intensity activities expending 3 to 3.9 times the B M R such as most housekeeping chores, walking normally, and bicycling slowly (about 9 kin/h); 2) High and very high intensity activi- ties expending > 4 times the B M R such as walking quickly or uphill (4.5 BMR), climbing stairs (6 BMR), sports and heavy construction work (> 6 BMR). We also analysed se- parately the contribution of very high intensity activities (> 6 BMR) such as sports and heavy construction work.
Statistical analyses
Summaries of the distributions of the categorical or grouped study variables described in the previous section were made in terms of percentages. Percentiles (P10, P50 (median), P90) with 95% nonparametric confidence intervals (C1) ~2 by age groups for continuous variables related to total energy expenditure were depicted in two dimensional figures. Sup- plementary tables given in the appendix report the percenti- les PI0, P25, P50, P75, P90, as well as the mean and standard deviation (SD).
Multiple logistic regression models ~ were employed to eval- uate the relationship between sedentarism and sociodemo- graphic variables, with adjustment for the potential con- founders age, education level, country of birth, cigarette smoking, dietary fat, and dietary fiber. The logistic analyses were performed separately for men and for women. The magnitudes of the associations between the sedentary versus active dependent variable and the risk factor independent variables were evaluated with odds ratios (OR) obtained by exponentiating the corresponding logistic regression coeffi-
Soz.- Pr~ventivmed. 46 (2001) 049-059 9 B]rkh~user Verlag, Basel, 2001
cients, together with 95% Wald confidence intervals (C1 = exponentiated C1 for log OR). All models were checked for goodness-of-fit with the Hosmer-Lemeshow test; no inade- quate fits were found (for men and women, respective p > 0.11 and p > 0.61).
Results
Sample characteristics
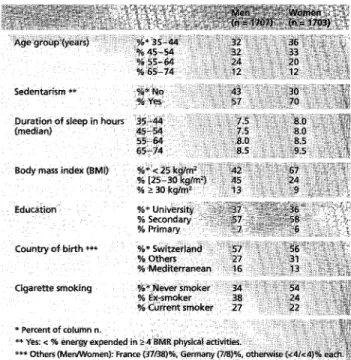
Prevalence of sedentarism was 57% in men and 70% in women (Tab. 1). Duration of sleep did not decrease with age. The proportions of obesity and overweight were re- spectively 13% and 45% in men and 9% and 24% in women. The majority of the men and women had a secondary level education and were Swiss. Only 27% of the men and 22% of the women were current smokers.
Physical activity distributions
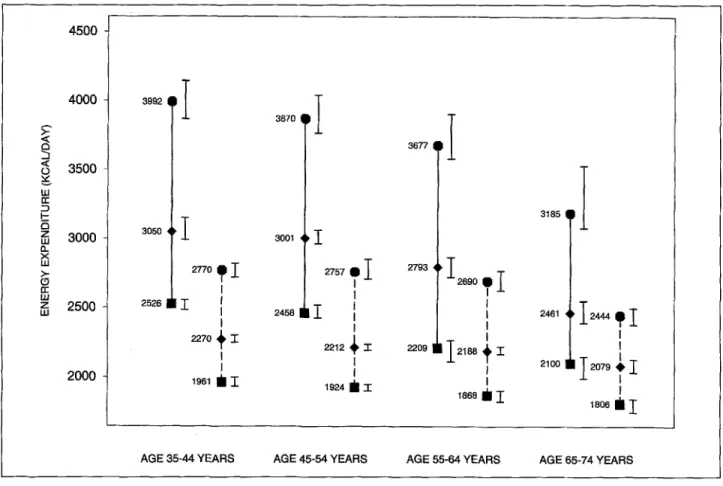
Percentiles P10, P50 (median), and P90 (with 95% C1) of the total energy expended per day by age groups, are displayed in Figure 1. Percentiles 10 and 90 respectively, can be inter- preted as follows: for example, for men, ages 35-44, only 10% of them expend 2526 kcal per day or less (the lowest 10%), and only 10% of them expend more than 3992 kcal per day (the highest 10%). Total energy clearly declines with age in men, the median showing a 500 kcal reduction in the oldest group (2461 kcal per day, age 65-74) compared to the youngest (3050 kcal per day, age 35-44). This decrease
% 45-54 % 55-64 % 65-74 Sedentarism **
Duration of sleep in hours 35~44
(median) 45~54
s5-64 65• Body mass i n d e x (BMI)
Education Country of birth *~* Cigarette smoking % Secondary 3 -37 ::; =:~@C~i58 C : . . ; '/.@, %* Switzerland ":57 ',~ : % Others 27 % Mediterranean ~6 %:* Never smoker ; '~' ' ~ % Ex:smoker 38 %; Current smoker 27
52 Section: International comparison of health determinants Bernstein MS, Costanza MC, Morabia A Physical activity of urban adults
4500 4000 a < o 3500 W z W 3000 x W W z 2500 W 2000 3992 3050 2526
,I
,I
2770 I
I I t I i 2270 + I I I 1961 i I 3870 I 36~ 3185 3001 2 7 5 7 . I 2793I
,
2690 I
I I 2458 t [ 2461 I I I I 2 2 1 2 + 2 2209 I2188 + I I 21~ I I 1924 1 9 I 156511
I
I I12o79&I
I I 1806 B I I IAGE 35-44 YEARS AGE 45-54 YEARS AGE 55-64 YEARS AGE 65-74 YEARS
Figure 1 Total energy expenditure, according to gender and age
groups. Square = P10, Diamond = PS0, Octagon = P90; Solid lines = Men, Dashed lines = Women. Solid lines with crossbars to right of sym- bols = 95% confidence intervals
according to age is much smaller in women with only a' 200 kcal reduction between the same age groups. Within each age group, a wider dispersion is seen in men (about 1500 kcal of difference between the percentile P10 and the percentile P90) compared to women (only 800 kcal of difference).
Distributions by age groups of the percents of total energy expended in moderate activites (3 to 3.9 BMR, such as walk- ing normally) had no clear relationship with age: the per- centile P10 and the median but not the percentile P90, seem to be increasing only after age 55 (Fig. 2 and Appendix). In Figure 3, percentile P10 equals zero for all age groups, which means that at least 10% of men and women did not perform any high or very high intensity activities (_> 4 BMR) such as brisk walking (4 BMR), stairs (6 BMR), sports (>_ 6 BMR). The median and the percentile P90 are decreasing with older age in both genders. While half the men in the youngest group expend less than 10% (median) of their energy in such activities, half the 65-74 year old men expend only 2.5% (median) in these types of activities. In women, the corresponding medians decrease from 5.8% in the youn- Soz,- Pr~ventivmed. 46 (2001) 049-059
9 Birkh~user Verlag, Baser, 2001
gest to 1.5% in the oldest group. The percentile P90 is the point above which the 10% most active respondents are. Among the 10% most active men, > 4 BMR activities repre- sent about 30% or more of the daily energy expenditure in all age groups. In comparison, the 10% most active women only expend 22.1% (35-44 years old) to 15.8% (65-74 years old) in > 4 B M R activities.
In all age groups, the majority of people perform not very high intensity activities (> 6 MBR) (median = 0%; shown in Appendix). In the Geneva population, these activities main- ly include sports, with only a few men also performing occu- pations like very hard construction work. The percentiles
Figure 2 Percent of total energy expended in 3-3.9 BMR activities,
according to gender and age groups. Square = P10,Diamond = PS0, Octagon = P90; Solid lines = Men, Dashed lines = Women. Solid lines with crossbars to right of symbols = 95% confidence intervals
Figure 3 Percent of total energy expended in _> 4 BMR activities, according to gender and age groups. Square = P10, Diamond = PS0, Octagon = P90; Solid lines = Men, Dashed lines = Women. Solid lines with crossbars to right of symbols are 95% confidence intervals
Bernstein MS, Costanza MC, Morabia A Physical activity of urban adults
Section: International comparison of health determinants 5 3
60 09 LU
E
G
50
._1 ,< ffl >- 4 0 T en O3 o 3 0 1-- 121 W ~ 2 0 : 7 W Q. M W >- O ,r 1 0 W Z W 40.3 I31.3 Ill I
114 'I1o2~Z
I I I 2.2 1 2.2 Illl I 36.2 9.7 1.125.8
~ I
"i-lo.5
~T
I I I2.4
INI
I
42,5 31.1 ? I I I I J,4&i33 =I
39.8 19.5I
27.21
14.5 I 4.5 I I I Ifi
I I I=I
0 A G E 35-44 Y E A R S A G E 45-54 Y E A R S A G E 55-64 Y E A R S A G E 65-74 Y E A R S 60 (/) LU~_
50
I.- O < ._1 < o_ m 4 0 >.- "l- rr m,~
30
A z a w z w 2 0 X r r I,u 7 1 0 tll 31.4 9 I2 1,, I
I
T
31.7 1 30,3209
~
I I I I II
'
8.2 147 ~t T
5.1 I 0 -- o l - - 0 g.9 o I I 3.2 T Io l - o / -
o i -
29.1 2.5 0]
158 ~I
_I1 5 |_i
A G E 35-44 Y E A R S A G E 4 5 - 5 4 Y E A R S A G E 55-64 Y E A R S A G E 65-74 Y E A R S Soz - Pr~ventivmed. 46 (2001) 049-059 9 Birkh~user Vedag, Basel, 200154 Section: International comparison of health determinants Bernstein MS, Costanza MC, Morabia A Physical activity of urban adults
Age group {years ,ge group (years
ducatio~ . ~ U ~ [ : ~ : ~
~ - ; , i : & ,-,~ ~: '~,:~ : ;,,,c;~,~.i~: ~: :%., ~,,.,!~,~ ~ , , ~ , . ~ ' ~;:, .~.~ #.Lt,,~ ~: ~ ~: :~:: r~& ~ :;r #,~ : ~ "
ducatio~
iountry of birt
ountry of birtl
igarette smokir :igarette smokir
'aily dietary fa ~aily dietary fa
~aily dietary fibe ,ally dietary fibe
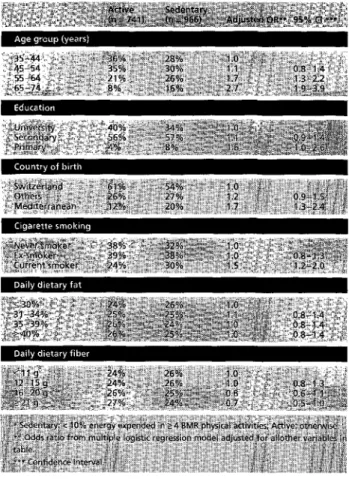
Table 2 Odds ratios of being sedentary* versus active*, in men (n = 1707), according t o several risk factors. Geneva, 1997-1999
Table 3. Odds ratios o f being sedentary* versus active*, in w o m e n (n = 1703), according t o several risk factors. Geneva, 1997-1999
P90 show that the 10% most active men expend about 16-23% of their energy in very high intensity activities and these percentages seem to remain identical with older age. In women however, the most active 10% expend only about 10-12% of their energy in very high intensity activities in the two youngest groups, but this percentage decreases to about 3 - 7 % for the two oldest groups.
Correlates of sedentarism
Sedentarism increases with age in both genders (Tab. 2 and 3). A lower (primary) education, being born in Mediter- ranean countries, and being a current smoker increase the risk of sedentarism in men. Only a lower (primary) educa- tion and being born in Mediterranean countries, but not smoking, increase by two-fold the risk of being sedentary in women. Dietary fiber seems to be related to a lower risk of sedentarism, more in women ( O R = 0.5, 95% C1 = 0.3-0.6) than in men (OR = 0.7, 95% C1 = 0.5-1.0).
5oz.- Pr~ventivmed, 46 (2001) 049-059 9 Birkh~iuser Verlag, Basel, 2001
Discussion
To our knowledge, this is the first time that the amount of total energy expenditure and its components, that is the several intensity levels of physical activities, are described in a general population. The major finding is the low preva- lence of high and very high intensity activities (_> 4 BMR) such as brisk walking (4 BMR), climbing stairs (6 BMR), and sports (_> 6 BMR). Indeed, more than 10% of men and women are not performing any of these activities. For half of the population, these activities represent 10% or less in men and 7% or less in women, of the total energy expenditure; these proportions clearly decrease with older age. According to our definition, the prevalence of seden- tarism is very high in Geneva (57% in men and 70% in women).
In a recent Swiss national survey 16, 500 Swiss adults were interviewed on the telephone about their usual activities relative to current recommendations. Results showed that 26% os the population reported performing at least 30 minu- tes per day of >- 4 B M R activities such as brisk walking and 37% of the population reported performing sports at least 3 times per week. The differences with the Geneva results may
Bernstein MS, Costanza MC, Morabia A Physical activity of urban adults
Section: international comparison of health determinants 55
be explained partly by the different methods used: the Swiss survey also included 15-24 and 25-34 year old people, who are more active than older individuals. On the phone, the interviewees were asked to evaluate the intensity of the activities performed and therefore they may have overesti- mated it. With the Geneva questionnaire, the interviewees responded to a list of activities without knowing how the intensity was rated. If we assume that only individuals re- porting performing sports in the national study (37% of the interviewees) are not sedentary, then the national and Gene- va results agree fairly well that the prevalence of seden- tarism is about 60% in Switzerland.
The high prevalence of sedentarism may be related to the current epidemics of obesity and overweight in western countries 17,19 with their dramatic consequences I9-22. The association between sedentarism and obesity 23-2s and the protective effect of physical activity2S-29 are well established. Prevalence of obesity and overweight in Geneva are, re- spectively, 13% and 45% in men and 9% and 24% in women. Diet cannot be the only reason for these high prevalences since total energy intake and proportion of fat in the diet have been decreasing in the recent past 3~ 31.
In the present results, sedentarism seems to be associated with country of birth. This is also true for other coronary heart disease risk factors as, for example, Italian-born women have a higher prevalence of overweight and obesity than Swiss women18. Country of birth may reflect behaviours, genetic factors, cultural habits, and social status. Education is also inversely and independently related to sedentarism. These results are consistent with the Swiss national survey (OFSP) which showed that differences linked to gender, age and socio-economic status are currently increasing.
The present sample has a rather low proportion of current smokers, and a high educational status; these results have been very consistent in the Geneva population since 199232. A selection bias with respondents being more aware of health issues compared to the general population cannot be completely excluded, but in that case, the prevalence of sedentarism would be underestimated in the present report. The majority of the Geneva general population did not per-
form any very high intensity activities, mainly including sports. The prevalence is clearly decreasing with older age. Some elderly people may not be aware of their physical capabilities and the fun they may expect to derive from per- forming sports.
Promotion of high intensity activities (such as brisk walking) and sports should therefore focus not only on adults but also on children (to compensate for the effect of having a lower education), and on older people. Bicycling has been found to be one of the Geneva active people's favorite activities 10.11. Depending on the speed, it may be a sport but also an activi- ty of > 4 BMR which could be performed on an everyday basis, by most people. However, activities on public streets, such as walking and bicycling, are also associated with expo- sure to traffic accidents, especially for children and elderly people who are often compromised in sight, hearing, reac- tion time and muscle strength. Indeed, the strong support of the public authorities is necessary to promote both physical activity and security for all.
Conclusion
The majority of men and women in Geneva are sedentary. They perform no sports and few high intensity activities. Sedentarism is even more prevalent in older age, women and lower socio-economic status persons, as people from the highest socio-economic status are better informed about the importance of physical activity and have more resources to perform sports. Promoting physical activities therefore needs to target on children, adults and elderly, and on physical activities which would be both attractive and financially affordable by most people. Brisk walking, using stairs and bicycling are smart choices but need to be motivated and stimulated by major health promotion interventions. Activi- ties on public streets require strong political support for making them safe and feasible throughout the city.
Acknowledgement
This study was supported by the Swiss National Fund for Scientific Research, grant no. 32-54097.98.
Soz.- Pr~ventivmed 46 (2001) 049-059 9 Birkh~user Verlag, Basel, 2001
56 Section: International comparison of health determinants Bernstein MS, Costanza MC, Morabia A Physical activity of urban adults
Zusammenfassung
Die kSrperliche Aktivit~t der erwachsenen AIIgemein- bev61kerung: eine Erhebung in Genf
Fragestellung: Die Beschreibung der Vertei~ung der kSrpedi- then Aktivit~t in de~ Bev6~kerung ist yon grosse~ ~ede~tu~g for die 8ffent[iche Gesundheitspflege.
Methoden: Eine yon 1997~I999 in der Schweiz durchgefOh~te Erhebung auf BevSIkerungsebene erfasste mit 1707 M~nner und 1703 Frauen eine Zufatisstichp~obe der 35- bis 74oi~hrigen Genfer BevS[kerung. Die 10%-~ 50%-. (Median) und 90%-Per- zentHe dienen zur Beschreibung der Verteilung des gesamten Energieverbrauchs und der Antei~e devon, die f ~ moderate Aktivit~ten (z.B, normates Laufen, Haushaltsarbeiten), wetche 3- bis 3,9-ma[ den Grundumsatz (GU) verbrauchen sowie f(]r intensive und hochintensive Aktivit~ten (~ 4 GU~ z. B. schn~Hes Laufen, Treppensteigea, Sport) aufgewendet wurden.
Ergebnisse: Der Gesamtenergieverbrauch (Median ~ n n e r 2929 kcal/Tag, Frauen 2212kca[/Ta~) sank bei beiden Ge-. schlechtern mit zunehmendem A~tero Die Pr~va[enz der sitzen- den Lebensweise, definiert als weniger ats 10% des Ge- samtene~gieverbrauchs dutch Aktivit~ten yon _> 4 GU, betrug bei den M~nnern 57% und bei der~ Frauen 70%~ Die M~nner verbrauchten 12% ihrer Gesamtenergie mit Aktivit~iten von 3-3,9 GU und 8% mit Aktivit~ten voa 2 4 GU. Die entspre- chenden Pr~va[enzen bei den Frauen betrugen 11% und 5%~ Die wenipen ~ a ~ e r (43%) und Frauen (31%) die hochinten- sive Aktivit~ten aus6bten (Sport oder berufiiche T~tigkeiten >__ 6 GU), verbrauchten im Durchschnitt 15% respektive 9% [hres Gesamtenergieverbrauchs dutch diese Aktivit~ten. Des Alter, Geschlecht, Herkunfts[and, Geburts[and und die Ausbii- dung sind statistisch signifikante Einflussfaktoren f~r die S~hwere der kSrperlichen Aktivit~t~
Schlussfolgerungen: Diese Erhebung zeigt, dass der Grosstei~ der Genfer Erwachsenen einen sitzenden Lebensstil pflegt und wenig oder keine Energie mit intensiven oder hochintensiven Aktivit~ten verbraucht,
Resum~
Uactivite physique de la population gdndrale adulte: une enqu~te ~ Genbve
Objectifs: La description de la distribution de l'activit~ phy- sique dens ~a population est d'une impo~ance primordiate pour ~a sant~ pub[ique.
M~thodes: En 1997-1999, ~ Gen~ve, Suisse, cette enqu~te a indus 4707 hommes et 1703 femmes selectionn~s au hasard dens la population g~n~ra[e ~g6e de 35 ~ 74 ans. Les percen- tiles P~0, P50 (m~diane) et PP0 r6sument ~a distribution de l'ene~gie tota~e d6pens6e, et des proportion~ de cette ~nergie utilis~es en activit@s mod~r6es (3 ~ 3,9 fois !e m6tabotisme de base (MB), ex., marche normale, activit~s m~nageres) et en activit~s intenses ou tr~s intenses (>_ 4 MB, ex., marche rapide, spo~s).
R~sultats: L:@nergie tota[a d~pensee (m~diane 2,929 kca[/~ chez les hommes, 2~212 kca~/j r Jes femmes) d~croff avec V~ge. La pr6va[ence de [a sedentarit~, d~finie comme moins de 110% de ['~nergie tota[e d~pens~e dens tes activit~s de 4 M ~ est de 57% chez [es hommes et 70% chez [es femmes. Les hommes depense~t 12% de leur 6nergie totale dans des activit~ de 3-3,9 MB et 8% dans des activit6s de _> 4 M8. Ces preva~ences sont de 11% et 5% chez les femmes. La s6denta- rite est encore plus frequente chez ~es femmes, Ies personnes ~g~es et de bas niveau de sco[arit6.
Conclusions: La majodt6 des Genevois est sedentaire. Pro- mouvoir I'activite physique doit cibler les enfants, les aduites et[es personnes ~g6es, e~ pr~ferant [es activites simpies et financierement abordabies pour tous.
Soz,- Pr~ventivmed. 46 (2001) 0 4 9 - 0 5 9
Bernstein MS, Costanza MC, Morabia A Physical activity of urban adults
Section: International comparison of health determinants 57
[ References
Stampfer MJ, Hu FB, Manson JE, Rimm EB, Willett WC. Primary prevention of coronary heart disease in women through diet and lifestyle. N Engl J Med 2000; 343: 16-22.
Sesso HD, Paffenbarger RS Jr, Lee IM. Phy- sical activity and coronary heart disease in men: The Harvard Alumni Health Study. Circulation 2000; 102: 975-80.
Kaprio J, Kujala UM, Koskenvuo M, Sarna S. Physical activity and other risk factors in male twin-pairs discordant for coronary heart disease. Atherosclerosis 2000; 150: 193-200.
Manson JE, Hu FB, Rich-Edwards JW,, et al. A prospective study of walking as compared with vigorous exercise in the prevention of coronary heart disease in women. N Engl J Med 1999; 341: 650-8.
Layne JE, Nelson ME. The effects of pro- gressive resistance training on bone density: a review. Med Sci Sports Exerc 1999; 31: 25-30.
Coupland CA, Cliffe S J, Bassey E J, Grainge M J, Hosking D J, Chilvers CE. Habitual phy- sical activity and bone mineral density in postmenopausal women in England. Int J Epidemiol 1999; 28." 241-6.
Gregg EW, Pereira MA, Caspersen CJ. Phy- sical activity, fails, and fractures among older adults: a review of the epidemiologic evi- dence. J Am Geriatr Soc 2000; 48: 883-93.
Physical activity and health. A report of the surgeon general. Atlanta, GA: US Department of Health and Human Services, National Center for Chronic Disease Prevention and Health Promotion, 1996.
WHO consensus report on "Energy and pro- tein requirements" Geneva: World Health Organization, 1986. (WHO technical report; no 724).
10 Bernstein M, Sloutskis D, Kumanyika S, Sparti A, Schutz Y,, Morabia A. Data-based approach for developing a physical activity frequency questionnaire. Am J Epidemiol 1998; 147:147-54.
11 Bernstein MS, Morabia A, Sloutskis D. Definition and prevalence of sedentarism in an urban population. Am J Public Health 1999; 89: 862-7. 12 13 14 15 16 17 18 19 20 21 22 23
Morabia A, Bernstein MS, Heritier S, Ylli A. Community-based surveillance of cardio- vascular nsk factors in Geneva: methods, resulting d~stributions and comparisons with other populations. Prey Med 1997; 26: 311-9.
Bernstein M, Morabia A, Costanza MC, et al. Equilibre nutritionnel de l'alimentation de la population adulte rgsidant/l Gen~ve. Soz Praventivmed 1994; 39: 333-44.
Morabia A, Bernstein M, Kumanyika S, et aI. Drveloppement et validation d'un ques- tionnaire semi-quantatif ~ parti d'une enqu~te de population. Soz Praventivmed 1994; 39: 345-69.
Hosmer D, Lemeshow S. Applied logistic regression. New York: J. Wiley, 1989.
Martin B, Lamprecht M, Calmonte R, Raeber B, Marti B. Taux d'activit6 physique de la population suisse: niveattx et effets sur l'rtat de sant& Bull office fdd~ral sant6 pubEque 47 (20 nov 2000).
Mokdad AH, Serdula MK, Dietz WH, Bowman BA, Marks JS, Koplan JR The spread of the obesity epidemic in the United States, 1991-1998. JAMA 1999; 282: 1519-22.
Morabia A, Beer-Borst S, Hercberg S. Locally based surveys, unite[ The EURALIM example. AM J Public Health 1998; 88." 1199-202.
Allison D B, Fontaine KR, Manson JE, Stevens J, Van Itallie TB. Annual deaths attributable to obesity in the United States. JAMA 1999; 282:1530-8.
Lee IM, Manson JE, Hennekens Cll, Paffen- barger RS Jr. Body weight and mortality. A 27-year follow-up of middle-aged men. JAMA 1993; 270: 2823-8.
Fine JT, Colditz GA, Coakley EH, et al. A prospective study of weight change and health-related quality of life in women. JAMA 1999; 282: 2136-42.
Paffenbarger RS Jr, Hyde RT, Wing AL, Lee IM, Jung DL, KampertJB. The association of changes in physical-activity level and other lifestyle characteristics with mortality among men. N Engl J Med 1993; 328: 538-45.
Martinez Gonzalez MA, Martinez JA, Hu FB, Gibney M J, Kearney Z Physical inac- tivity, sedentary lifestyle and obesity in the European Union. Int J Obes Relat Metab Disord 1999; 23:1192-201. 24 25 26 27 28 29 30 31 32
French SA, Jeffery RW, Forster JL, McGovern PG, Kelder SH, Baxter JE. Predictors of weight change over two years among a population of working adults: the Healthy Worker Project. Int J Obes Relat Metab Disord 1994; 18:145-54.
Di Pietro L, Williamson DF, Caspersen C J, Eaker E. The descriptive epidemiology of selected physical activities and body weight among adults trying to lose weight: the Behavioral Risk Factor Surveillance System survey, 1989. Int J Obes Relat Metab Disord 1993; 17: 69-76.
Pate RR, Pratt M, Blair S, et al. Physical activity and public health. A recommenda- tion from the Centers for Disease Control and Prevention and the American College of Sports Medicine. JAMA 1995; 273: 402-7.
Hunter GR, Weinsier RL, Bamman MM, Larson DE. A role for high intensity exer- cise on energy balance and weight control. Int J Obes Relat Metab Disord 1998; 22: 489-93.
Khalid ME. The association between strenuous physical activity and obesity in a high and low altitude populations in southern Saudi Arabia. Int J Obes Relat Metab Disord 1995; 19: 776-80.
Tremblay A, Despres JP, Leblanc C, et al. Effect of intensity of physical activity on body fatness and fat distribution. Am J Clin Nutr 1990; 5/: 153-7.
Heini AF, Weinsier RL. Divergent trends in obesity and fat intake patterns: the Ame- rican paradox. Am J Med 1997; t02: 259-64.
Prentice AM, Jebb SA. Obesity in Britain: gluttony or sloth? BMJ 1995; 311: 437-9.
Morabia A, Bernstein MS, Heritier S, Beer-Borst S. A Swiss population-based assessment of dietary habits before and after the March 1996 "mad cow disease" crisis. Eur J Clin Nutr 1999; 53:158-63.
Address for correspondence
Dr. Martine S. Bernstein Division d'Epid6miologie Clinique H6pitaux Universitaires de Gen~ve 25 rue Micheli-du-Crest
1211 Geneva 14 Switzerland Tel.: +41-22 37 29 554
Soz.- Pr~ventivmed. 46 (2001) 049-059 9 Birkh&user Veflag, Basel, 2001
5 8 Section: International comparison of health determinants Bernstein MS, Costanza MC, Morabia A
Physical activity of urban adults
A p p e n d i x
to 3,9 BMR':'{~
"""="IIili=i ' ... "7
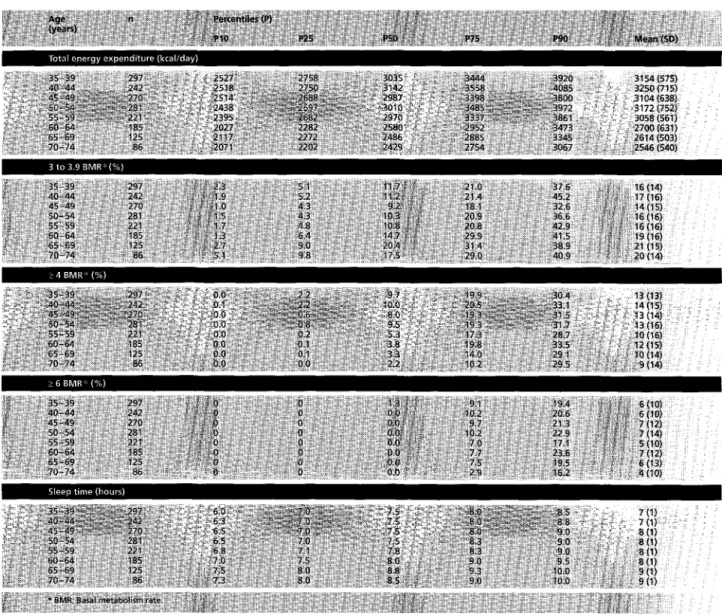
Table A1 Physical activity in men (n = 1707). Geneva,1997-1999.
Total energy expenditure and its distribution in moderate intensity activities (3 t o 3.9 BMR*), high intensity activities (_> 4 BMR*) and very high intensity activities (_> 6 BMR*).
Soz,- Pr~ventivmed. 46 (2001) 049-059 9 Birkh~user Verlag, Basel, 2001
Bernstein MS, Costanza MC, Morabia A Physical activity of urban adults
Section: International comparison of health determinants 59
[al energy expenalture I, KCal/oal
:o 3.9 BMR':' (~
BMH': (~
1;iflr
eep time (flour
2275 2526 2778 2266 2504 2757 2217 2491 2753 2206 2495 2782 2212 2507 2723 2157 2353 2624 2074 2275 2465 2087 2223 2425 5.7 10.5 18.6 30.9 4.9 9.6 18.3 32.1 5.2 10.5 18.3 26.2 5.8 10.5 17.9 27,4 7.1 1&8 21.5 ~ . 0 8.2 15.2 23,3 31:0 8,0 14.6 20.3 27,2 9,2 13.7 21.8 27.3 1.5 6.6 13.4 0.2 5.2 11.8 0.4 4.6 13.6 0.6 4.8 11.2 0,2 4.0 10,8 0,1 1.8 113 i - 0,1 2.3 8.7 0.0 0.6 6.4 0 4.1 12.6 0 3.4 10.5 0 3.4 11.5 0 2.7 9,5 0 0.0 6.9 0 0.0 5,8 o &o 4 6 0 0.0 3.2 ::~.0 8 : 8.0 : 8 8.0 8 ; 8.0 8 8 0 9 8 8 : : 9 ~0 : : : ' 9
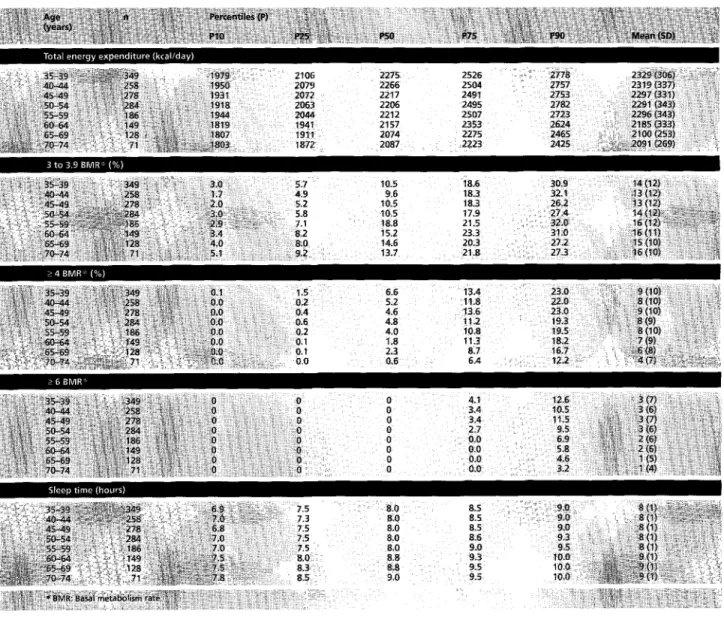
Table A2 Physical activity in w o m e n (n = 1703). Geneva, 1997-1999
Total energy e x p e n d i t u r e and its d i s t r i b u t i o n in m o d e r a t e intensity activities (3 t o 3.9 BMR*), h i g h intensity activities (> 4 BMR*) and very h i g h intensity activities (_> 6 BMR*).
SOZ.- Pr~ventivmed. 46 (2001) 049-059 9 Birkh~user Verlag, Basel, 2001