HAL Id: hal-01704882
https://hal.archives-ouvertes.fr/hal-01704882
Submitted on 8 Feb 2018
HAL is a multi-disciplinary open access archive for the deposit and dissemination of sci-entific research documents, whether they are pub-lished or not. The documents may come from teaching and research institutions in France or abroad, or from public or private research centers.
L’archive ouverte pluridisciplinaire HAL, est destinée au dépôt et à la diffusion de documents scientifiques de niveau recherche, publiés ou non, émanant des établissements d’enseignement et de recherche français ou étrangers, des laboratoires publics ou privés.
Distributed under a Creative Commons Attribution - NonCommercial| 4.0 International License
studies
Luc Demaison, Evangelia Mourmoura
To cite this version:
Luc Demaison, Evangelia Mourmoura. Is there an ‘obesity paradox’ of cardiac survival in heart disease ? A perspective from experimental laboratory studies. 61 p., 2018. �hal-01704882�
2018, January
Is there an ‘obesity paradox’ of cardiac survival in heart disease?
A perspective from experimental laboratory studies
*by Luc Demaison1 and Evangelia Mourmoura
(1) Human Nutrition Unit, INRA, UMR 1019, Clermont Université, Université d’Auvergne, BP 10448, 63000 Clermont-Ferrand, France. Tel.:
(+33)473608265; Fax: (+33)473608255; email: luc.demaison@inra.fr
* Part of this work was performed in the Laboratory of Fundamental and Applied Bioenergetic, INSERM U1055, Université Grenoble Alpes, France.
All our thanks to Pr. Jean-Pierre Iliou of the Servier Research Institute, Cardiovascular Research Unit, 92150 Suresnes, France; Pr. Salvatore Pepe of the Murdoch Children's Research Institute, Department of Cardiology, Royal Children's Hospital, Melbourne, Australia; and Pr. Luc Rochette of the Laboratory of Experimental Cardiovascular Physiopathology and Pharmacology, Medical University, 21033 Dijon, France, for discussing the validity of the scientific arguments presented in the manuscript.
We would also like to thank Salvatore Pepe for skilful improvement of the English version of a large part of this manuscript.
CONTENTS
ABBREVIATIONS p. 3 ABSTRACT p. 5 1 - INTRODUCTION p. 6 1.1 - Socio-economical context p. 6 1.2 - Obesity prevention p. 61.3 - Obesity related diseases p. 8
2 - OBESITY & CARDIOVASCULAR DISEASE p. 11
2.1 - Obesity effects on morphology and metabolism in a rat
Dietary model p. 12
2.2 - Obesity effect on in vivo cardiac function p. 17
2.3 - Ex vivo cardiac function in Langendorff mode perfusion model p. 21
2.3.1 - High fat-fed Wistar rats p. 22
2.3.2 - Lou/C rats compared to Wistar rats p. 24
2.3.3 - Changes in cardiac function with aging p. 25
2.3.4 - The Zucker Diabetic Fatty (ZDF) rat p. 25
2.4 - Discrepancies between in vivo and ex vivo measurements of cardiac mechanical function – Limitation of in vitro constant
pressure perfusion p. 26
2.5 - Other factors influencing the tissue perfusion and vascular function p. 32
2.6 - Conclusions p. 43
3 - OBESITY PARADOX p. 44
3.1 - Introduction p. 44
3.2 - Mitochondrial function after 3 months of high fat diet p. 46
3.3 - Mitochondrial function after 7 months of high fat diet p. 49
3.4 - Coronary reactivity after the 7-month high fat diet p. 50
3.5 - Effects of obesity on the severity of ischemia p. 51
4 - GENERAL CONCLUSIONS p. 53
ABBREVIATIONS
Aa: antimycine AAch: Acetylcholine
AFM: Abdominal Fat Mass ArA: Arachidonic Acid BMI: Body Mass Index CaCl2: calcium chloride
CF: Coronary Flow CO2: carbon dioxide
dP/dt max and dP/dt min: maximal and minimal derivatives of the left ventricular developed pressure
ECVA: Endothelial Cell Vasodilatation Activity EDV: Endothelial-Dependent Vasodilatation EIV: Endothelial-Independent Vasodilatation eNOS: endothelial Nitric Oxide Synthase EPA: EicosaPentaenoic acid
GM: Glutamate/Malate GMP: Guanosine MonoPhosphate H+: proton H2O: water H2O2: Hydrogen peroxide HDL: High-Density Lipoproteins HFD: High-Fat Diet HR: Heart Rate
IDF: International Diabetes Federation Indo: Indomethacin
INRA: French National Institute for Agronomical Research
INSERM: French National Institute of Health and Medical Research Kc: Krebs cycle
KCl: potassium chloride
KH2PO4: potassium dihydrogen phosphate
LA: Linoleic Acid
L-NAME: L-NG-NitroArginine Methyl Ester
LVDP: Left Ventricular Developed Pressure MA: Middle-Aged
MgSO4: magnesium sulphate
N: Nitroprussiate NaCl: sodium chloride
NADP+: oxidized Nicotinamide Adenine DiNucleotide Phosphate NADPH: reduced Nicotinamide Adenine DiNucleotide Phosphate
NaHCO3: sodium hydrogen carbonate
ND: Normolipidic Diet NO: Nitric Oxide O: Old O2: di oxygen Pcarn: Palmitoylcarnitine/malate PG: ProstaGlandin PKC: protein Kinase C Pyr: Pyruvate/malate
RCI: Respiratory Control Index Rot: rotenone
RPP: Rate Pressure Product Ser: Serine
Succ: Succinate/rotenone St. 2: State 2 respiration rate T2D: Type-2 Diabetes TX: ThromboXan
WHO: World Health Organization WHR: Waist to Hip Ratio
WI: Wistar Y: Young
YA: Young Adult
ZDF: Zucker Diabetic Fatty ZL: Zucker Lean
ABSTRACT
Abdominal obesity is associated with the development of cardiovascular disease. However, an ‘obesity paradox’ phenomenon has been identified whereby cardiovascular events that may ultimately lead to heart failure, in a setting of obesity occur with relatively lower severity affording the obese patient a greater chance of survival. The obesity paradox has partly been explained by a higher substrate availability to augmented muscle and fat masses, thus permitting greater resistance to injury and capacity for adaptive remodelling and survival. However, recent research advances show that substrate utilization is probably not the only parameter contributing to the obesity paradox. This book summarizes laboratory data showing that obesity triggers molecular changes at the cardiac level which can partly explain the obesity paradox.
1 - INTRODUCTION
1.1 - Socio-economical context
Obesity is a major health problem in the industrialized societies as well as emerging countries. According to the World Health Organization (WHO), the yield of obese people has more than doubled since 1980. In 2014, the WHO estimated 1.9 billion adults to be overweight, with 600 million of these to be obese, representing approximately 39% and 13% of the total population respectively. The phenomenon increases with aging, however in the last two decades, the number of children under the age of 5 that are either overweight or obese has been increasing reaching an estimated 41 million in 2014 (1).
Currently the financial cost of obesity is estimated at ~2 trillion dollars per year. However, if the trajectory of obesity continues on its rising trend, the proportion of overweight and obese people will reach half the population in 2030 and the resulting costs will explode according to the McKinsey Global Institute (2). It is thus crucial to reverse the current trend and to slow down the progression of the epidemic, particularly as a large part of obesity may be preventable.
1.2 - Obesity prevention
The obesity is defined as an excessive fat mass deposition in the body. Body mass index (BMI) which is calculated as the weight in kilograms divided by the square of the size in meter is the index usually used to estimate the build of an individual. Individuals with a BMI ranging from 25 to 30 are considered overweight and those with a BMI higher than 30 are obese. However, fat deposition is not located identically in all individuals and since abdominal adiposity creates a more dangerous health risk, clinicians prefer to utilize the waist-to-hip ratio (WHR) (3). According to the WHO, people displaying a WHR higher than 0.80 for the women and 1.0 for the men are obese (4).
Although some genetic factors have been identified to be involved (5), the obesity epidemic is considered to be mainly related to an unbalanced diet and insufficient physical activity. The Western diet which has progressively expanded to the whole world, due to high abundance of manufactured and refined foods, is excessive in saturated fats and refined sugars. This contributes to fat mass deposition and the phenomenon is further amplified by the lack of physical activity characterizing the modern sedentary life style. The first prescription given by physicians to fight against obesity consists in reducing the calorie intake and increasing the physical activity. Although the ingestion of some specific nutrients have been considered in facilitating the fat loss effort: for example, green tea extract (6-8) and n-3 polyunsaturated fatty acid (PUFA) eicosapentaenoic acid (EPA) (9-15). However, the effects of these nutrients are controversial, at best limited, and cannot totally replace the required effort to limit food intake and increase regular exercise. When obesity is too severe and life threatening, bariatric surgery by fitting a gastric ring or performing a gastric short circuit is efficient in favouring weight loss, though it can trigger vitamin deficiency. Furthermore, it is not known whether all obesity-related disorders are reversed and if bariatric surgery has long-term beneficial effects (16).
Numerous studies show that the build of an individual depends on early events occurring during the perinatal period. For instance, low birth weight (premature) children have a high risk to develop obesity during adulthood (17). To compensate for their low birth weight, these children tend to be overfed in the postnatal period. Similarly, postnatal over-nutrition by reduction of the litter size in rodents translate into obesity during their life span (18). There is thus a critical period surrounding birth during which a metabolic programme sets up and may determine the lifelong dietary behaviour which governs not only the calorie intake but also the level of physical activity during the life span. The central nervous system plays a key role in this governance via the hypothalamic-pituitary axis.
The hypothalamic arcuate nucleus possesses neuropeptide Y-secreting neurons which extend to the paraventricular nucleus. Circulating leptin and insulin inhibit the secretion of neuropeptide Y and cause satiety (19). Obese people have high blood concentrations of insulin and leptin because of insulin resistance and high adipose tissue accumulation. However, as obesity triggers leptin- and insulin-resistance of the arcuate nucleus this prevents satiety thus obese individuals continue to eat in unregulated manner. A salvo of studies (20-23) show than postnatal over-nutrition induces disorganization and malprogramming of the arcuate nucleus characterized by leptin- and insulin-resistance as well as augmentation of the number of neuropeptide Y-secreting neurons. This induces inhibition of several neurons of the paraventricular and ventro-medial nuclei by neuropeptide Y and leads to feeding and reduced energy expenditure through expressional changes in the production of orectic and anorectic factors (24). As a consequence, the body weight of an individual depends greatly on the central metabolic programming occurring in the perinatal period. However, it is also modulated by several factors taking place later during the life: low income-related junk food habits, little exercise due to physical injuries or medication intake, work- and hobby-related inactivity, age-related decrease in capacity to exert physical activity, sarcopenia, etc (25-28). The metabolic program enforces calorie intake, the highest weight gain during these periods. Spontaneous changes in life style factors remains difficult over time, thus bariatric surgery for such obese people offers a more practical direct approach in order to limit and reverse excess fat deposition in the abdominal cavity and the development of numerous pathologies (29, 30).
1.3 - Obesity related diseases
Obesity increases the risk for disease including hypertension, cardiovascular diseases and certain cancers (31-32). Obesity-related cancers concern
oesophageal carcinoma, pancreatic, colorectal, breast, endometrial, kidney, gallbladder, ovarian, liver, prostate, and blood (leukaemia and lymphoma) cancers. The increased risk for cancer development is due to hormonal malfunctioning. Indeed, adipose tissue is an endocrine system which produces numerous hormones (leptin, adiponectin, resistin, etc.). The increased risk of breast cancers in obese women relates to an excess production of oestrogens by adipose tissue (33).
In addition to cancers other health problem consequences of being overweight and obese are type 2 diabetes and cardiovascular disease. According to the International Diabetes Federation (IDF), the metabolic syndrome is a cluster of the most dangerous heart attack risk factors: diabetes and pre-diabetes, abdominal obesity, high cholesterol and high blood pressure (34). The IDF definition indicates that the metabolic syndrome is diagnosed when an individual displays abdominal obesity with values of waist circumference depending on the ethnic origin plus two of the following factors: raised triglycerides to values higher than 150 mg/dl (or specific treatment for this lipid abnormality); decreased HDL cholesterol to 40 mg/dl in males and 50 mg/dl for females (or specific treatment for this lipid abnormality); increased blood pressure to 130 mmHg for the systolic pressure or 85 mmHg for the diastolic pressure (or treatment of previously diagnosed hypertension); and augmented fasting glucose concentration to 100 mg/dl (or previously diagnosed type 2 diabetes).
The prominent symptom characterizing the metabolic syndrome is insulin resistance which is particularly marked in the skeletal muscles, liver and adipose tissue (35). In adipose tissue, insulin resistance activates lipolysis, contributing to increase plasma non esterified fatty acid concentration (36). When the storage capacities of the adipose tissue are reached, excess circulating lipids invade other tissues usually not dedicated to lipid storage and trigger insulin resistance and or lipotoxicity (37). This is the case for the liver for which insulin resistance
augments gluconeogenesis and glucose delivery into the blood (38). In skeletal muscle glucose uptake capacity decreases with insulin resistance (39). To
compensate for insulin resistance, pancreatic -cells augment insulin secretion,
but ultimately become insulin deficient due to excess activity and lipotoxicity (40). Thus, type 2 diabetes (T2D) emerges with hyperglycaemia and hyperlipidaemia.
Obesity strongly increases the risk of T2D which represents 92% of all diagnosed diabetes (41). Excess abdominal adiposity would account for 80-85% of the risk of developing a T2D and obese people are 80 times more likely to develop a T2D than normal-weight individuals. Amputation, nephropathy and heart diseases are the tragic consequences of diabetes. However, 68% of diabetics aged 65 or more die from cardiovascular diseases and 18% from stroke. Adults with diabetes have 2 to 4 times greater risk of death from heart disease. The American Heart Association reports that diabetes is one of the 7 most severe risk factors for cardiovascular diseases (42).
2 - OBESITY & CARDIOVASCULAR DISEASE
Obesity- and T2D-related cardiovascular disorders include obstructive and non-obstructive diseases. Atherosclerosis is the predominant non-obstructive illness with plaque rupture and blood clot formation being responsible for the most severe myocardial infarction and stroke. This vascular pathology is strongly related to obesity, since it is promoted by dyslipidaemia, oxidative stress and inflammation. Atrial fibrillation can also stimulate blood clot formation and stroke. When atria fibrillate, blood dynamics in cardiac cavities are perturbed, blood coagulates and clots are driven to the brain through the blood circulation to trigger stroke. The Framingham cohort study has reported that a BMI increase by 1 unit leads to a 4-5% higher risk of atrial fibrillation (43) indicating that obesity constitutes a strong risk factor for atrial fibrillation.
Despite the major progress in cardiovascular medicine leading to fewer patients deaths from obstructive diseases there is a relative increase in cardiac hypertrophic disorder, diabetic cardiomyopathy and heart failure (44, 45). Well demonstrated by Habbout et al. (46), obesity also leads to cardiac failure. These researchers showed in the rat that postnatal over-nutrition-induced obesity from
the end of weaning to the 9th month of life resulted in cardiac failure involving
oxidative stress, hypertrophy and fibrosis. Importantly, this cardiac failure was preceded at 3 months of age by a phase when increased cardiac function was stimulated by obesity. Such cardiac stimulation of increased cardiac output may be an adaptive offset for the body weight gain which subsequently leads to the progressive development of the cardiac failure later in the life of the rats, due to excess stimulation and injurious exhaustion and stress of the heart. This hypothesis, although appealing, provides no satisfactory indication of the underlying molecular mechanisms. Thus, as described in the sections that follow, our group sought to determine the biochemical changes occurring with early obesity when cardiac function is stimulated which could explain the progressive
development of the cardiac failure occurring later in the life of the animals. In these studies, rats were fed a high fat diet for 3 months and cardiac function was assessed in vivo and ex vivo. The functional reserve of the coronary micro-vessels describing the perfusion capacities of the myocardium was also estimated in the absence and presence of a cyclooxygenase inhibitor (indomethacin) in conjunction with the determination of the fatty acid composition of cardiac phospholipids (47-50). Such experiments were repeated in the model of the Zucker Diabetic Fatty (ZDF) rat in which obesity is associated with insulin resistance and hyperglycaemia. The results were supplemented with the measurement of several parameters describing the cardiac oxidative stress (51).
2.1 - Obesity effects on morphology and metabolism in a rat dietary model In the first set of experiments, 3-month old male Wistar rats were divided in 2 groups. The first group was fed with a high fat diet (HFD, 54% of lipids in weight) enriched with lard (50% of the diet mass) in order to mimic the Western diet and to induce abdominal obesity; the second group was nourished with a normolipidic diet (ND) with 3.1% of lipids in order to mimic an equilibrated diet. The two diets were consumed ad libitum for 12 weeks.
The HFD did not increase the body weight of the animals, but analysis of the data indicated that two subgroups of animals could be distinguished at the end of the feeding period: those which did not gain weight and those which gained weight. Indeed, HFD- fed animals displayed the same body weight as ND-fed rats whereas those of the HFD+ group exhibited a significant 18% increase in their body weight value (Fig. 1). Abdominal fat mass was similarly increased in both HFD-fed subgroups (+100 and +115% in the HFD- and HFD+ subgroups, respectively), but cardiac hypertrophy did not occur as indicated by the significant reduction of the heart weight to body weight ratio (-18 and -16% for the HFD- and HFD+ subgroups).
B od y w ei gh t ( g) 0 200 400 600 800 Wi ND Wi HFD-Wi HFD+ A bd om in al f at m as s (g /1 00 g o f bo dy w ei gh t) 0 2 4 6 8 H ea rt w ei gh t ( m g of d ry w ei gh t/ 10 0 g of b od y w ei gh t) 0 20 40 60 a a b a b b a b a,b
A
B
C
Figure 1. Effects of the high fat diet on the body weight (panel A), abdominal fat mass (panel B) and heart weight (panel C) in Wistar rats. The number of experiments was 10 for the Wi
ND group and 5 for Wi HFD- and Wi HFD+ groups. Wi ND: group of Wistar rats fed the normolipidic diet; Wi HFD-: group of Wistar rats fed the high fat diet with a stable body weight; Wi HF+: group of Wistar rats fed the high fat diet with an increased body weight;
a,b: means without a common letter are significantly different. Extracted from (47).
At the end of the feeding period, hyperglycaemia did not occur, but glucose intolerance, estimated after oral glucose load by hyperglycemia compared to the control animals, developed particularly in the HFD+ subgroup (Fig. 2) despite unchanged fasting insulin concentrations. Yet, glucose intolerance is considered to be all the more elevated that the lipid storage and lipotoxicity in the skeletal muscles is high. Furthermore, dyslipidaemia was observed mainly in the HFD- subgroup with increased triglycerides and total cholesterol concentrations whereas it partially vanished in the HFD+ subgroup. These results suggest that the lipid storage capacities of the tissues not dedicated to fat storage were low in the HFD- subgroup and high in the HFD+ subgroup which exhibited relatively low circulating lipid concentrations and high glucose intolerance.
In a second set of experiments, anti-obese Lou/C rats were compared to their Wistar counterparts. In contrast to the Wistar rat, the Lou/C rat does not become fat with aging. Indeed, in our experiments, it weighed only 188 ± 11 vs. 323 ± 5 g for the Wistar phenotype at the age of 3 months. This was partly due to a decreased abdominal adiposity (-43%), but the normalized leg muscle and heart weights were higher (+13 and +22%) suggesting that the Lou/C rat was adapted to physical training. The measurement of the spontaneous physical activity with a spinning wheel revealed that the Lou/C rats ran 7956 ± 957 m/day vs. 1075 ± 154 for their Wistar counterparts. In sedentary animals, fasting glycaemia and insulinemia were not altered by the rat phenotype. When the glucose challenge was performed, the Wistar rats displayed a slight glucose intolerance compared to the Lou/C rat, but the difference was low.
B lo od g lu co se c on ce nt ra tio n (m M ) 0 2 4 6 8 Wi ND Wi HFD-Wi HFD+ B lo od in su lin c on ce nt ra tio n (m U /l) 0 50 100 150 200 G lu co se in to le ra nc e (a re a un de r th e cu rv e: a rb it ra ry u ni t) 0 10000 20000 30000 40000 a b a,b B lo od tr ig ly ce ri de c on ce nt ra tio n (g /l ) 0,0 0,5 1,0 1,5 2,0 T ot al c ho le st er ol c on ce nt ra ti on ( g/ l) 0,0 0,2 0,4 0,6 0,8 1,0 1,2 a b a,b a b b A E D C B
Figure 2. Effects of the high fat diet on the glycaemia (panel A), insulinemia (panel B), glucose intolerance (panel C), triglyceridemia (panel D) and cholesterolemia (panel E). The
number of experiments was 10 for the Wi ND group and 5 for the Wi HFD- and Wi HFD+ groups. Wi ND: group of Wistar rats fed the normolipidic diet; Wi HFD-: group of Wistar rats fed the high fat diet with a stable body weight; Wi HFD+: group of Wistar rats fed the
high fat diet with an increased body weight; a,b: means without a common letter are significantly different. Extracted from (47).
At the end of the feeding period, hyperglycaemia did not occur, but glucose intolerance, estimated after oral glucose load by hyperglycemia compared to the control animals, developed particularly in the HFD+ subgroup (Fig. 2) despite In a third set of experiments, male Wistar rats were followed during the totality of their life span. The animals were thus divided in four age groups: young (Y), young adult (YA), middle-aged (MA) and old age (O) rats which were killed at the age of 3, 6, 11 and 17 months, respectively. They were fed the commercially available equilibrated diet which contains 3.1% of lipids during all their life span.
Aging (month) 0 5 10 15 20 B od y w ei gh t ( g) 0 200 400 600 800 Aging (month) 0 5 10 15 20 A bd om in al a di po si ty ( g/ 10 0 g of b od y w ei gh t) 0 2 4 6 8 Aging (month) 0 5 10 15 20 G lu co se in to le ra nc e (a re a un de r th e cu rv e in a rb it ra ry u ni ts ) 0 5000 10000 15000 20000 25000 A C B a b c d a b b b a b a,c c
Figure 3. Influence of aging on body weight (panel A), abdominal adiposity (panel B) and glucose intolerance (panel C) of Wistar rats fed the normolipidic diet. The number of experiments was 10 per group. a,b,c,d: the absence of a common letter between two means
Aging modified the body weight of the animals, but also the abdominal adiposity (Fig. 3). A progressive increase of body weight was observed with increasing aging, but abdominal adiposity augmented between 3 and 6 months of age when it was normalized to the body weight. This indicates that energy intake surpassed the needs of the animals during this period. Thereafter, the abdominal adiposity remained stable until the old age. Glucose intolerance was related to abdominal adiposity between 3 and 6 months: it augmented between 3 and 6 months like the abdominal adiposity, suggesting that it occurred when the energy intake exceeded the needs of the animals. However, an adaptation occurred thereafter when the abdominal adiposity was high but stable: glucose intolerance progressively returned to the basal value measured at 3 months of age, implying that the energy intake progressively decreased in order to fit the animal needs. Hypertriglycemia and hypercholesterolemia were observed only at the old age (see reference 48 for more details).
Finally, in a fourth set of experiments, male ZDF rats were compared to their lean counterparts at the age of 11 weeks. Both types of animals were fed with a commercially available diet which was low in lipids (3.1% of the diet mass). However, due to their deficient leptin receptor, ZDF rats were bulimic: they ate almost two fold more diet compared to their lean counterpart. In this case, the body weight of the ZDF animals exceeded that of their lean counterparts at the moment of the sacrifice (364 ± 1 vs. 300 ± 1 g, p<0.001). Their abdominal fat mass was markedly increased (+265% compared to the lean animals, p<0.001), however no cardiac hypertrophy was evident, according to the heart weight to body weight ratio. These changes were associated with higher blood glucose concentration (+540%, p<0.001), HbA1c level (+130%, p<0.001), as well as plasma insulin (+251%, p<0.001), triglyceride (+97%, p<0.001) and total cholesterol (+81%, p<0.001) concentrations. The ZDF rats displayed type 2 diabetes with hyperglycaemia and insulin resistance, but as evidenced by the high
insulin concentration encountered in these animals, the pancreatic cells were still functional, suggesting that the diabetes progression was in its early development.
2.2 - Obesity effects on in vivo cardiac function
Cardiac mechanical function was determined in vivo using a Millar pressure probe introduced in the left ventricle via the right carotid. This probe allowed the determination of the heart rate (HR), left ventricular developed pressure (LVDP), and the positive and negative derivatives of the LVDP with respect to time which reflect contractility and relaxation, respectively.
Cardiac function was evaluated in the first set of experiments when Wistar rats were fed with the high fat diet for 3 months. The results, presented in Fig. 4, show that heart rate was not modified by the HFD irrespective of the weight gain of the animals. Conversely, the LVDP was higher in the HFD- group compared to the control one (+33%) and intermediary in the HFD+ group.
A similar pattern was observed for the contractility and relaxation: the HFD- group displayed better contractility and relaxation (+38% and +36%, respectively) than the control group. The HFD+ group exhibited values ranging between these two extremes.
H ea rt r at e (b ea ts /m in ) 0 150 300 450 600 Wi ND Wi HFD-Wi HFD+ L V D P (m m H g) 0 50 100 150 200 dP /d t m ax ( m m H g. s -1 ) 0 1500 3000 4500 6000 dP /d t m in ( m m H g. s -1 ) -6000 -4500 -3000 -1500 0 a b a,b a b a,b a b a,b
Figure 4. Effects of the high fat diet on the in vivo cardiac function of Wistar rats. Panel A: heart rate; panel B: left ventricular developed pressure; panel C: dP/dt max; panel D: dP/dt min. The number of experiments was 10 for the Wi ND group and 5 for the Wi HFD- and Wi HFD+ groups. Wi ND: group of Wistar rats fed the normolipidic diet; Wi HFD-: group of Wistar rats fed the high fat diet with a stable body weight; Wi HFD+: group of Wistar rats fed the high fat diet with an increased body weight; a,b: means without a common letter are
significantly different. Extracted from (47).
A dobutamine test was also performed in vivo to stimulate -adrenergic receptors and a positive inotropic effect. In our study, it was infused via the jugular vein at different doses ranging from 0 to 10 µg/min/kg. The cardiac function was monitored by means of the Millar probe. The results are presented in Fig. 5.
Dobutamine dose infused (µg/min/kg) 0 2 4 6 8 10 12 H ea rt r at e (b ea ts /m in ) 0 100 200 300 400 500 ND HFD * *
Dobutamine dose infused (µg/min/kg)
0 2 4 6 8 10 12 L ef t v en tr ic ul ar d ev el op ed p re ss ur e (m m H g) 0 40 80 120 160 200 * * * *
Figure 5. Effect of the high fat diet on the in vivo cardiac function of Wistar rats during a dobutamine test. The number of experiments was 10 per group. Wi ND: group of Wistar rats fed the normolipidic diet; Wi HFD: group of Wistar rats fed the high fat diet. *: significantly
different. Unpublished data.
The heart rate and LVDP were augmented by the increasing doses of dobutamine. High fat diet hearts had augmented heart rate when dobutamine was infused at 5 and 10 µg/min/kg. Furthermore, in these high fat diet hearts LVDP was increased regardless of dobutamine dose.
Taken together, these data confirm an inotrope positive effect of abdominal adiposity. This improved cardiac function represents probably a compensatory mechanism in order to maintain the mobility of obese individuals, despite the increased body weight which necessitates higher energy needs to perform a similar degree of activity compared to lean people.
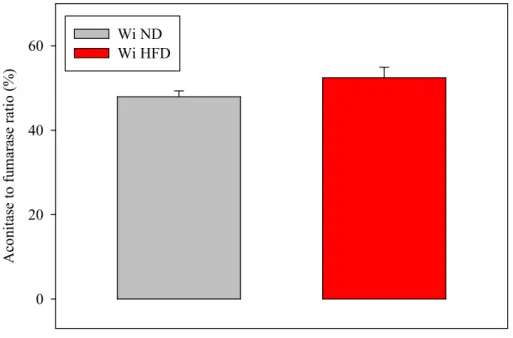
Positive inotropism involves the stimulation of the energy metabolism. Yet, the oxidative stress known to occur with obesity (52, 53) may block the Krebs cycle (Kc) through inhibition of aconitase. This Kc enzyme has been shown to be
inhibited by reactive oxygen species (54) whereas the Kc enzyme fumarase is not. We measured the ratio between the activities of aconitase and fumarase of cardiac homogenates in order to determine the mitochondrial oxidative stress. The results are presented in Fig. 6.
A co ni ta se to f um ar as e ra ti o (% ) 0 20 40 60 Wi NDWi HFD
Figure 6. Effects of the high fat diet on the aconitase to fumarase ratio of heart collected in the in vivo situation. The enzymatic activities were measured at their Vmax. The number of experiments was 10 per group. Wi ND: group of Wistar rats fed the normolipidic diet; Wi
HFD: group of Wistar rats fed the high fat diet. Extracted from (49).
The ratio tended to be higher in the hearts of the high fat-fed rats, but the difference was not statistically significant. These results suggest that the mitochondrial redox potential was slightly higher when the animals displayed an abdominal obesity. This could result from a better organ perfusion: indeed, the greater the oxygen supply, the greater the production of reduced equivalents available for potential reactive oxygen species scavenging.
2.3 - Ex vivo cardiac function in Langendorff mode perfusion model
The ex vivo cardiac function was assessed using Langendorff-mode isolated heart perfusion. The rat hearts were perfused via the aorta at a constant pressure which was fixed by a column of perfusion fluid via a Mariotte’s flask. In this model, the coronary flow depends on the vasodilatation of the coronary micro-vessels: the highest their vasodilatation status, the highest the coronary flow. After rapid collection in the animal, the heart was immediately perfused via the aorta with a
perfusion fluid composed of (in mM) NaCl 119, MgSO4 1.2, KCl 4.8, NaHCO3
25, KH2PO4 1.2, CaCl2 1.2 and glucose 11 mM as sole energy substrate. The
perfusion fluid continuously bubbled with carbogen (95% O2/5% CO2) was
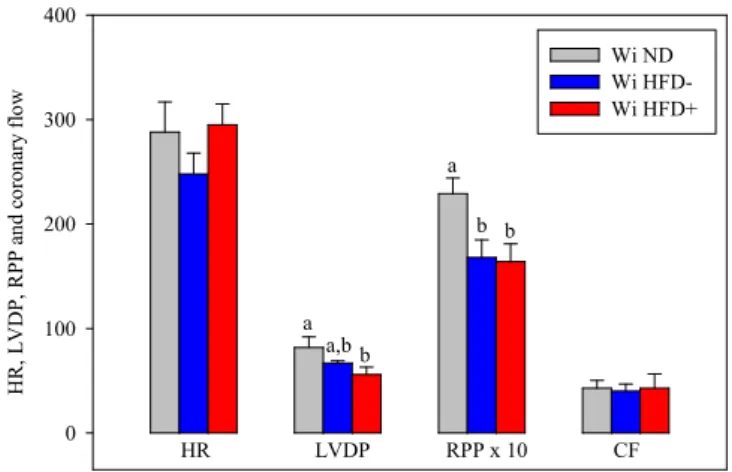
maintained at 37°C at the level of the aorta. A latex balloon related to a pressure probe was introduced into the left ventricle in order to record the cardiac cycle and to calculate the left ventricle developed pressure (LVDP), heart rate, rate pressure product (RPP: product between the LVDP and the heart rate), dP/dt max and dP/dt min. The effect of abdominal obesity was then determined in different animal models. H R , L V D P, R PP a nd c or on ar y fl ow 0 100 200 300 400 Wi ND Wi HFD- Wi HFD+ HR LVDP RPP x 10 CF a a,b b a b b
Figure 7. Effects of the high fat diet on the ex vivo activity of the isolated heart perfused at constant pressure. The number of experiments was 10 for the Wi ND group and 5 for Wi HFD- and Wi HFD+ groups. HR: heart rate; LVDP: left ventricular developed pressure;
RPP: rate pressure product; CF: coronary flow; Wi ND: group of Wistar rats fed normolipidic diet; Wi HFD-: group of Wistar rats fed high fat diet with a stable body weight;
Wi HFD+: group of Wistar rats fed high fat diet with an increased body weight; a,b: means without a common letter are significantly different. Extracted from (47).
2.3.1 - High fat-fed Wistar rats
High fat-fed rats were subdivided in 2 groups, those who did not gained body weight (HFD-) and those who did (HFD+). The coronary flow and heart rate were unaffected by the HFD (Fig. 7), but the rate pressure product (reflecting the cardiac mechanical function) was decreased in the HFD- and HFD+ groups compared to the control group (-27 and -28%). The reduced RPP was due to a decrease in LVDP in the HFD+ group (-32%), but rather to simultaneous tendencies toward reductions of the heart rate and LVDP in the HFD- group.
Heart rate (beats/min) 200 300 400 500 600 700 L V D P ( m m H g) 0 30 60 90 120 150 Wi ND Wi HFD
Heart rate (beats/min) 200 300 400 500 600 700 R P P ( m H g/ m in ) 0 30 60
Heart rate (beats/min) 200 300 400 500 600 700 dP /d t m ax ( m m H g/ s) 0 750 1500 2250 3000 3750 4500
Heart rate (beats/min) 200 300 400 500 600 700 dP /d t m in ( m m H g/ s) -2250 -1500 -750 0 * * * * * * * * * * * * * * * * * * * * * * * * * * * * * * * * * * *
Figure 8. Submaximal cardiovascular effort trial in the ex vivo situation with the influence of the high fat diet. The number of experiments was 10 per group. LVDP: left ventricular developed pressure; RPP: rate pressure product; dP/dt max and min: maximal and minimal
time-derivatives of the left ventricular developed pressure; Wi ND: Wistar rats fed the normolipidic diet; Wi HFD: Wistar rats fed the high fat diet. *: significantly different.
In a second set of experiments, the cardiac function of Wi HFD-fed rats versus Wi ND-fed animals was evaluated by pacing the hearts in a wide range of heart rates. No distinction between the animals gaining or not gaining body weight was performed in this set of experiments. The results are presented in Fig. 8. For each measured parameter (LVDP, RPP, dP/dt max and dP/dt min) and fixed electrical pacing rate, the hearts of Wi HFD-fed animals displayed lower values compared to those of the control group. This finding confirms that abdominal obesity is associated with lower ex vivo cardiac mechanical function in this model of perfusion at constant pressure.
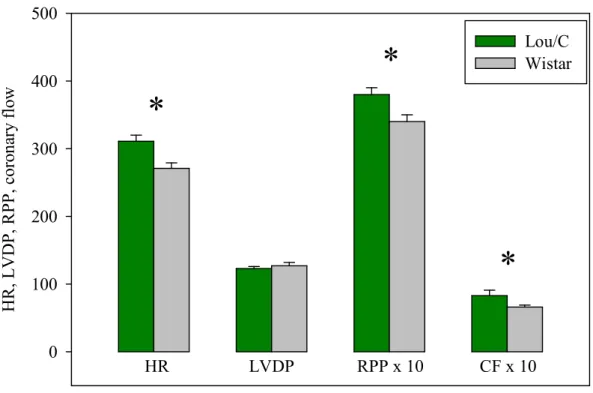
H R , L V D P, R PP , c or on ar y fl ow 0 100 200 300 400 500 Lou/C Wistar HR LVDP RPP x 10 CF x 10
*
*
*
Figure 9. Cardiac function in the anti-obese Lou/C rat. In this experiment, both types of animals were fed the normolipidic diet. The number of experiments was 10 per group. HR:
heart rate in beats/min; LVDP: left ventricular developed pressure in mmHg; RPP: rate pressure product in dmHg/min; CF: coronary flow in ml/min/g of dry weight. *: significantly
2.3.2 - Lou/C rats compared to Wistar rats
Anti-obese Lou/C rats were compared to Wistar rats to evaluate the effect of obesity since Wistar rats become rapidly obese during their life span. In this experiment, the calcium concentration of the perfusion fluid was raised to 2.5 mM in order to stimulate the cardiac mechanical function, as measured by the high rate pressure product shown in Fig. 9. Compared to the anti-obese Lou/C rat, the Wistar rat had a lower rate pressure product (12%). This was due to a lower heart rate (-13%), but the LVDP was unchanged. Interestingly, the coronary flow was significantly reduced by abdominal obesity (-20%). Myocardial oxygen consumption was not significantly modified by the animal phenotype (4.9 ± 0.4
vs. 4.1 ± 0.2 µmoles of O2/min/g for the Lou/C and Wistar rats). The metabolic
efficiency (RPP to O2 consumption ratio) was lower in the Wistar rats compared
to its Lou/C counterpart (5.4 ± 0.2 vs. 7.3 ± 0.5 mHg/µmole of O2).
Aging (month) 2 4 6 8 10 12 14 16 18 A bd om in al f at m as s (g /k g) , R P P (m H g/ m in ) 0 15 30 45 60 75 AFM RPP a b b b
Figure 10: Effect of aging on the ex vivo rate pressure product (RPP) of Wistar rats during a perfusion at constant pressure with the Mariotte’s flask. The number of experiments was 10 per group. AFM: abdominal fat mass; RPP: rate pressure product. a,b: significantly different
Notably these results confirm the deleterious effects of abdominal adiposity on the ex vivo cardiac function. The high calcium-induced stimulation of the cardiac function evoked the appearance of obesity-related changes in coronary flow and metabolic efficiency.
2.3.3 - Changes in cardiac function with aging
Fig. 10 shows that the rate pressure product decreased between the 3rd and 6th
month of life when the abdominal fat mass increased. Thereafter, the cardiac mechanical function remained low and stable when the abdominal fat mass was high and stable, from 6 to 17 months of age.
This clearly indicates that the ex vivo cardiac mechanical function is inversely related to the abdominal fat mass.
2.3.4 - The Zucker Diabetic Fatty (ZDF) rat
The homozygous fa/fa Zucker rat exhibits hyperphagia caused by a non-functioning leptin receptor which promotes onset of obesity and diabetes (55). In our study, 11 week-old animals displayed hyperglycaemia (~5 g/l), hyperinsulinemia (~4.5 ng/ml), hypertriglyceridemia (~1.8 g/l) and hypercholesterolemia (~1.4 g/l) compared to their lean counterpart (~1 g/l, 1.2 ng/ml, 0.9 g/l and 0.75 g/l for glycaemia, insulinemia, triglyceridemia and cholesterolemia). Their abdominal fat mass was increased by 365%.
The rate pressure product of these obese animals was decreased by 35% compared to their control and this was due to a reduction of the heart rate (-42%), since the LVDP was augmented (+18%). The reduction of cardiac mechanical function observed in the ZDF rats was associated with a decrease in the coronary flow (-25%).
2.4 - Discrepancies between in vivo and ex vivo measurements of cardiac mechanical function - Limitation of in vitro constant pressure perfusion
Our data show that abdominal obesity increased in vivo cardiac mechanical function. Meanwhile, the utilization of the isolated heart perfused at constant pressure indicates the inverse relationship. Why such a discrepancy? Of course, the valid method to evaluate the cardiac mechanical function is in vivo. So what are the limitations of ex vivo perfusion?
In the whole animal, the cardiac function depends on the contractile activity of the cardiomyocytes, but also on several parameters fixed by other organs. For instance, the peripheral circulation regulates the blood pressure at the level of the left atria and thus the volume of blood fulfilling the cardiac cavities during diastole. This volume is of crucial importance in determining the strength of the cardiac contraction. Indeed, according to the Starling’s law, this parameter is all the more elevated that the myofibril stretching is important: a high systolic pressure is thus synonymous of a strong contraction. Moreover, the in vivo cardiac function depends on the neurohumoral status of the organism. This might have a high importance during obesity when the inflated adipose tissue produces more leptin and less adiponectin (56). Another difference concerns the substrate availability. The isolated heart received only glucose as a substrate whereas all the possible substrates (glucose, lactate, fatty acids, certain amino acides, ketone bodies, etc.) are available to the in vivo heart. These differences between the in vivo and ex vivo situations could partly explain the discrepancies observed in our studies, but some defaults of our ex vivo perfusion model can also be involved. When isolated hearts are perfused at constant pressure, the coronary flow is high at the beginning of the perfusion procedure (higher than 22 ml/min). However, when the duration of the perfusion increases, the coronary flow gradually decreases to progressively reach values around 10-12 ml/min: this reflects
incremental vasoconstriction of the resistance arteries of the coronary circulation. Yet, the oxygen and substrate supplies to the cardiomyocytes which are mainly determined by the rate of coronary flow have a strong effect on the contractile function. Similar to a car engine: the highest the air (oxygen) and fuel (substrate) supplies, the highest the pulling force (contraction) of the engine. Figure 11 illustrates this relationship. Isolated hearts were perfused at 2 different coronary flows thanks to a peristaltic pump: 12 and 24 ml/min. The cardiac mechanical activity was then determined using a latex balloon introduced in the left ventricle and related to a pressure probe. Doubling the coronary flow almost multiplied the rate pressure product by a factor 2. Irrigation of the coronary bed thus plays a fundamental role on cardiac contractile activity.
R at e pr es su re p ro du ct ( m H g/ m in ) 0 20 40 60 80 CF = 12 ml/min CF = 24 ml/min
*
Figure 11. Influence of the coronary flow rate on the cardiac mechanical activity of Wistar rats. The number of experiments was 10 per group. CF: coronary flow. *: significantly
A metabolic index describing the extent of coronary bed irrigation and the cardiomyocyte oxygenation is the mitochondrial aconitase to fumarase ratio. Aconitase and fumarase are two Krebs cycle enzymes with differing redox potential regulation. Aconitase is strongly inhibited by the oxidative stress whereas the fumarase is not (54). The ratio between the activities of aconitase and fumarase informs on the mitochondrial redox potential and thus the degree of mitochondrial oxygenation, thus the greater the aconitase to fumarase ratio, the index suggests a greater extent of mitochondrial oxygenation. We thus determined the aconitase to fumarase ratios of the homogenates of hearts collected directly from the in vivo or ex vivo perfused hearts. The results are presented in Table 1. In the ex vivo situation, the hearts from lean animals (ZL and Wi ND groups) displayed a high aconitase to fumarase ratio. Conversely, ZDF and high fat diet-fed Wistar rat hearts had a low ratio compared to their lean counterparts. This contrasted with the in vivo situation where the lean and obese animals displayed ratios of similar magnitude. Thus, the ex vivo perfusion is inadequate to the study of cardiac function since an abnormal hypo-perfusion seems to occur principally for the hearts of rats with abdominal obesity. This hypo-perfusion does not occur in vivo.
Table 1. Effects of abdominal obesity on the aconitase to fumarase ratio measured in the in vivo and ex vivo situations
Group Aconitase to fumarase ratio ZL ex vivo ZDF ex vivo 21.5 ± 2.9 12.8 ± 2.9 * Wi ND ex vivo Wi HFD ex vivo 26.2 ± 1.9 15.7 ± 1.3 * Wi ND in vivo Wi HFD in vivo 19.0 ± 1.6 22.4 ± 1.7
In the ex vivo situation, the hearts were perfused at a constant pressure fixed by a Mariotte’s flask. The aconitase and fumarase activities were measured at their Vmax. The number of experiments was 10 per group. ZDF: Zucker Diabetic Fatty rats; ZL: lean counterparts of ZDF rats; Wi ND: Wistar rats fed the normolipidic diet containing 3% of lipids; Wi HFD: Wistar rats fed a diet containing 54% of lipids; *: significantly different. Extracted from (49) and (51).
We decided thus to improve our perfusion method by perfusing the hearts at a constant coronary flow fixed by a peristaltic pump. The perfusion pressure was set at 65 mmHg during the first 10 min of perfusion in order to avoid oxygenation
differences due to the size of the heart. The coronary flow measured at the 10th
min of perfusion was then maintained constant during all the perfusion procedure by means of a peristaltic pump. The hearts were paced electrically at a rate of 370 beats per min. A representation of the perfusion model is presented in scheme 1.
Scheme 1. Perfusion at constant coronary flow by means of a peristaltic pump.
Peristaltic pump
Computer Pressure amplifier and
flowmeter Flow probe Syringe Latex balloon Perfusion fluid pH 7,4 Water bath Carbogen (95% O2/ 5% CO2)
Heat chamber (37°C) filled with perfusion fluid
Pressure gauges
Perfusion fluid arriving into the aorta at 37°C
Electric pace-maker Electrode of electric stimulation Perfusion canula inserted
into the aorta
Recording IsoHeart software
C or on ar y fl ow ( m l/ m in /g dw ) 0 20 40 60 80 100 Wi ND Wi HFD PP at th e 10 th m in ( m m H g) 0 20 40 60 80 100 P P at th e 30 th m in ( m m H g) 0 20 40 60 80 100 dP /d t m ax ( m m H g . s -1 ) 0 1500 3000 4500 6000 A co /F um r at io ( % ) 0 10 20 30 40
*
Wi ND Wi HFD Wi ND Wi HFD Wi ND Wi HFD Wi ND Wi HFDFigure 12. Effects of the high fat diet on the characteristics of ex vivo cardiac perfusion. The enzymatic aconitase and fumarase activities were measured at their Vmax. The number of
experiments was 10 per group. PP: perfusion pressure; Aco/Fum ratio: ratio between the activities of aconitase and fumarase; dP/dt max: maximal time-derivative of the left ventricular developed pressure; Wi ND: group of Wistar rats fed the normolipidic diet; Wi HFD: group of Wistar rats fed the high fat diet. *: significantly different. Extracted from (47).
The measurements of the mechanical function were performed at the 30th min of
perfusion. In these standardized conditions, the positive derivative of the left ventricular pressure with respect to time (dP/dt max) is an excellent index of the cardiomyocyte contractility. We evaluated the influence of the high fat
diet-related abdominal adiposity on the coronary flow, perfusion pressure at the 10th
and 30th min of perfusion, aconitase to fumarase ratio and cardiac mechanical
function (Fig. 12). The perfusion pressure at the 10th min of perfusion was very
from the fixed perfusion pressures. Interestingly, the perfusion pressures at the
30th min of perfusion were only slightly increased compared to those fixed at the
10th min of perfusion, suggesting that no major vasoconstriction of the coronary
resistance arteries occurred, even in the HFD group.
In addition, the aconitase to fumarase ratios of both groups were high and unaffected by abdominal adiposity. Interestingly, the dP/dt max was increased in the HFD group (+19%) compared to the control group. The results of the in vivo situation were thus recovered in this model of perfusion at fixed coronary flow: the 3-month HFD increases the contractility of the cardiomyocytes provided that the oxygenation of the cardiac tissue is maintained.
Thus, differences between the in vitro perfusion models impacted modifications of the physiological status of the cardiac cells, with the constant pressure perfusion model (with progressive decrease in coronary flow) being inferior to the latter constant coronary flow, constant pressure and paced heart rate model. An important second messenger involved in coronary vasodilatation is nitric oxide (NO) resulting from the transformation of L-arginine to citrulline by the endothelial nitric oxide synthase (eNOS) according to the following reaction:
2 L-arginine + 3 NADPH + 3 H+ + 4 O
2 2 L-citrulline + 2 NO + 3 NADP+ + 4 H2O
After L-arginine utilization by the eNOS, restoration of its cellular pool depends on 2 pathways: the first one is based on the uptake of circulating L-arginine through the system y+ transporter (57). Plasma L-arginine concentration in the rat surrounds 80 µM (58); the second one is a rescue pathway which regenerates L-arginine from citrulline through an energy-dependent process (59). Moreover, the eNOS can be uncoupled by the oxidative stress (60) and this results to lower NO production and vasoconstriction. In our ex vivo perfusion models, L-arginine is not added to the perfusion fluid and L-arginine availability depends only on the energy-dependent rescue pathway. When the perfusion at fixed coronary flow is
performed, the upholding of the coronary flow by means of the peristaltic pump allowed the approximate maintenance of the coronary pressure, which suggests that the energy metabolism was still high enough to insure the upholding of the L-arginine pool. However, with the constant pressure model, the progressive decrease in the coronary flow reduced the energy synthesis capacities and/or augmented the oxidative stress. This may have resulted in a vicious cycle during which the L-arginine pool did not replenish, resulting in further augmented decrease in the coronary flow. The impact of this was particularly strong in hearts from rats with abdominal adiposity, suggesting a pathological status induces important disturbances of the coronary vessels in their energy metabolism and/or oxidative stress. The true reasons for these alterations (alterations of energy metabolism or biopterin depletion) cannot be directly discovered in the whole heart and complementary studies in cultured cells appear necessary.
2.5 - Other factors influencing the tissue perfusion and vascular function Amongst the mediators susceptible to produce a coronary vasodilatation, we can mention prostaglandins (PG) which are produced from polyunsaturated fatty acids of membrane phospholipids, namely arachidonic acid (C20:4 n-6 or ArA) and eicosapentaenoic acid (C22:5 n-3 or EPA). A cascade of enzymes leads to the formation of these prostaglandins: the initial step of this cascade is catalysed by the cyclooxygenase enzyme which allows the synthesis of prostanglandin H (PGH2 and PGH3 from ArA and EPA). Thereafter, the PGH molecules are transformed in different prostaglandins by several PG synthases: they include PGI2, PGD2, PGE2 and PGF2 for the 2 series prostaglandins produced from ArA and PGI3, PGD3, PGE3 and PGF3 for the 3-series prostaglandins synthesized from EPA. Thromboxane (TX) A2 and A3 are formed by a thromboxane synthase. Each prostaglandin has a specific activity: for instance, PGI2 also named prostacyclin triggers vasodilatation and inhibits platelet
aggregation; PGD2 and PGE2 have similar effects. Conversely, TX A2 and PGF2 have opposite effects, provoking vasoconstriction and platelet aggregation. The series-3 prostaglandins have in general either no effect or inverse effects as compared to the series-2 prostaglandins.
One of the most important discovery that we have done in our laboratory about abdominal obesity is that 3-month of a high fat diet in the rat strongly modify the
profile of n-6 polyunsaturated fatty acids of cardiac phospholipids (Fig. 13A).
Pr op or ti on ( % o f to ta l f at ty a ci ds ) 0 10 20 30 Wi NDWi HFD Pr op or ti on ( % o f to ta l f at ty a ci ds ) 0 10 20 30 Wi ND Wi HFD Pr op or ti on ( % o f to ta l f at ty a ci ds ) 0 10 20 30 40 ZL ZDF
A
B
C
LA AA LA AA LA AA AA/LA*
*
*
*
*
*
Figure 13. Fatty acid composition of cardiac phospholipids of high fat-fed Wistar rats (panel A), Zucker Diabetic Fatty rats (panel B) and of total plasma lipids of high fat-fed Wistar rats (panel C). The number of experiments was 5 per group. LA: linoleic acid (C18:2 n-6); ArA:
arachidonic acid (C20:4 n-6); Wi ND: group of Wistar rats fed the normolipidic diet; Wi HFD: group of Wistar rats fed the high fat diet; ZL: Zucker lean animals fed the normolipidic
diet; ZDF: Zucker Diabetic Fatty rats fed the normolipidic diet. *: significantly different. Extracted from (49) and (51).
Indeed, the proportion of linoleic acid (C18:2 n-6 or LA) is decreased (-39%) and that of ArA is increased (+30%). Advised reviewers could suggest that this difference was due to the change in the fatty acid composition of the diet: indeed, the high fat diet is composed of the low fat diet supplemented with lard. Yet, lard has a different fatty acid composition than the basal diet: it is richer in saturated and monounsaturated fatty acids and poorer in n-6 and n-3 polyunsaturated fatty acids. However, the ZDF rats ate the same basal diet than that consumed by their lean littermates. The unique difference was the amount of diet eaten by each phenotype: it was almost double for the ZDF animals compared to the ZL rats. The analysis of the fatty acid composition of cardiac phospholipids (Fig. 13B) indicates that the same excessive conversion of LA to ArA occurred in the ZDF rats compared to their lean counterpart. The differences were even ampler (-52 and +48% for LA and ArA, respectively) compared to the HFD-fed rats. Thus, the accumulation of ArA was not due to the fatty acid composition of the diet, but to the excessive energy intake. The reasons for these changes are not known. What we know is that the changes were already seen in the plasma after the 3-month high fat diet (Fig. 13C): LA was decreased by 24% and ArA was augmented by 10%. The increase in ArA was not significant, but circulating ArA was probably captured avidly by the organs, which tended to decrease its proportion in the plasma. In any case, the ArA to LA ratio of total plasma lipids was increased significantly by the HFD (+40%). Our data suggest thus that the conversion of LA to ArA did not occur in the heart, but in an upstream organ closer to the digestive tract. It could be the liver or even the microbiota.
ArA released from phospholipids by the phospholipase A2 in cultured cardiomyocytes acts as a cellular messenger. It increases both the amplitude of calcium transients and contraction of electrically stimulated cells (61). The target of ArA would be the PKC and ionic channels. The enrichment of cardiac membranes with ArA can thus explain the positive inotropic effect of the high fat
diet observed in our studies in vivo and ex vivo when the hearts were perfused at fixed coronary flow. However, positive inotropism must be associated with adequate adaptation of the coronary circulation. Otherwise, the system is not in equilibrium, energy needs surpass energy production and ischemia installs. We expected thus a vasodilatation effect induced by abdominal obesity.
Figure 14. Typical plot of the perfusion pressure obtained during the measurement of the coronary reactivity. The doses of acetylcholine and nitroprussiate injected are expressed in
pmoles. U46619: analogue of thromboxane A2 with vasoconstriction properties.
In this purpose, we evaluated the coronary reactivity to acetylcholine (endothelial-dependent vasodilatation or EDV) and nitroprussiate (endothelial-in(endothelial-dependent vasodilatation or EIV). Acetylcholine (Ach) acts directly on endothelial cells: when it interacts with its membrane receptor, it favours the entry of calcium in these cells. Increased calcium stimulates the eNOS enzyme which produces more NO. NO triggers relaxation of smooth muscle cells via a cyclic GMP-dependent mechanism and dilates the coronary vessels. Ach action reflects thus the simultaneous activities of endothelial and smooth muscle cells. When it is
solubilized in aqueous solution, nitroprussiate degrades spontaneously and produces NO which relaxes directly the smooth muscle cells. The vasodilatation induced by nitroprussiate reflects thus the specific activity of the smooth muscle cells.
In practical terms, the EDV and EIV were determined in the isolated heart perfused according to the Langendorff’s mode at constant coronary flow. In order to evaluate the effect of the vasodilatation agents, a preliminary vasoconstriction was performed using U46619, a thromboxane A2 analogue, at the concentration of 30 nM. The perfusion pressure was thus raised from 65 to values surrounding 130 mmHg. The vasodilatation agents were injected directly into the aorta at different concentrations ranging from 4 to 100 pmoles for Ach and 100 to 1000 pmoles for nitroprussiate. They entered the coronary circuit and relaxed the resistance vessels, the activity of which determines the coronary flow. Since the coronary flow was constant, the vasodilatation induced by Ach or nitroprussiate triggered a reduction of the perfusion pressure (Fig. 14): the magnitude of the vasodilatation was estimated by determining the amplitude of the decrease in the perfusion pressure and this parameter was normalized to the value of the perfusion pressure just before the injection of the vasodilatation agent. After normalisation for the input function, the dose-response curves of EDV and EIV were fitted to theoretical curves (logarithmic functions) and this allowed the estimation of the vasodilatation activity of the endothelial cells (ECVA) using the following formula:
ECVA = e[(% Ach-induced vasodilatation –b)/a], where a and b are the coefficients of the
theoretical EID curve. The results were expressed in pmole equivalents of nitroprussiate. A typical representation of the obtained results are presented in Fig. 15.
The effects of the 3-month high fat diet is presented in Fig. 16. The animals fed with the high fat diet were separated in those which gained weight (HFD+ group)
and those who did not (HFD- group). The results clearly show that abdominal obesity increased EDV irrespective of the weight gain of the animals. However, the weight gain played a role on the type of activated vascular cells: when the body weight was not increased by the high fat diet, the endothelial cells were activated and the smooth muscle cells were not. In contrast, when the high fat diet increased the body weight, the gain in EDV was only due to an activation of smooth muscle cells.
Injected Ach dose (pmoles) 0 15 30 45 60 75 E D V ( % ) 0 2 4 6 8 10
Injected nitroprussiate dose (pmoles) 0 150 300 450 600 750 E IV ( % ) 0 2 4 6 8 10 12 14 16
Injected Ach dose (pmoles) 0 10 20 30 40 50 60 70 E C V A ( pm ol es o f ni tr op ru ss ia te ) 0 400 800 1200 1600
A
C
B
Figure 15. Typical behaviour of the micro-vessel cells during the measurement of the coronary reactivity of Wistar rats. The number of experiments was 10 per group. EDV: endothelial-dependent vasodilatation; EIV: endothelial-independent vasodilatation; ECVA:
E D V ( % ) 0 5 10 15 20 25 30 Wi ND Wi HFD- Wi HFD+ (Wi HFD- = Wi HFD+) > Wi ND E IV ( % ) 0 10 20 30 40 Wi HFD+ > (Wi HFD- = Wi ND) E C V A ( pm ol es o f ni tr op ru ss ia te ) 0 100 200 300 400 500 Wi HFD- > ( Wi HFD+ = Wi ND) 4 10 20 40 60 80 100 4 10 20 40 60 80 100 100 200 400 600 800 1000
A
C
B
Figure 16. Effect of the high fat diet on the dependent and endothelial-independent vasodilatations (EDV and EIV, panel A and B, respectively) and endothelial cell
vasodilation activity (ECVA, panel C). The number of experiment was 10 for the Wi ND group and 5 for the Wi HFD groups. Wi ND: Wistar rats fed the normolipidic diet; Wi HFD-: Wistar rats fed the high fat diet without body weight gain; Wi HFD+: Wistar rats fed the high
fat diet with body weight gain. Absissa: panels A and C = injected acetylcholine doses expressed in picomoles; panel B: injected nitroprussiate doses expressed in picomoles.
Table 2. Effects of HF on NO function during vasodilatation
No inhibitor L-NAME Indo L-NAME + Indo
Wi ND 11.6 ± 1.1 a 7.6 ± 1.7 9.6 ± 1.8 8.5 ± 1.7
Wi HFD- 16.1 ± 2.1 b 4.7 ± 1.3 * 12.7 ± 1.0 6.7 ± 1.8 *
Wi HFD+ 17.4 ± 1.2 b 14.5 ± 4.1 9.8 ± 1.4 # 10.0 ± 2.0 #
N= 10 for Wi ND group and 5 for Wi HFD groups. The results are expressed in percentage of
the perfusion value preceding the injection of the vasodilatation agent. L-NAME: L-NG
-Nitroarginine methyl ester ; Indo : indomethacin ; Wi ND: Wistar rats fed the normolipidic diet; Wi HFD- : Wistar rats fed with the high fat diet without body weight gain ; Wi HFD+ :
Wistar rats fed the high fat diet displaying body weight gain; a, b: a mean of the “no inhibitor” column without a common letter is significantly different; *: significant effect of
the tested inhibitor(s) in the HFD- fed group compared to the basal value of this group without inhibitor; #: significant effect of the tested inhibitor(s) in the HFD+ fed group
compared to the basal value of this group without inhibitor. Extracted from (47).
Utilization of different inhibitors (Table 2) indicates that the increase in vasodilatation induced by the HFD was related to a NO-dependent mechanism in the HFD- group, confirming the involvement of the endothelial cells. In contrast, it was related to a prostaglandin-dependent mechanism in the HFD+ group, since it was inhibited by indomethacin: this suggests that the augmented relaxation of the smooth muscle cells due to the HFD was related to the accumulation and utilization of arachidonic acid as substrate for the formation of enzymatically oxidized fatty acids.
EDV, EIV and ECVA were also determined in the ZDF rats in comparison with their lean littermates. In these animals, the EDD and ECVA were not significantly modified, but the EIV was slightly but significantly increased (Fig. 17).
In this model of marked abdominal obesity, the ArA proportion of cardiac phospholipids was considerably increased and this probably contributed to increase the EIV. However, the high plasma glucose concentration probably attenuated the changes of vessel reactivity: indeed, we previously demonstrated
that streptozotocin-induced hyperglycaemia strongly reduces the EDV and EIV (62). E IV ( % ) 0 5 10 15 20 25 30 ZL ZDF
*
Figure 17. Endothelial-independent vasodilatation (EIV) in the Zucker Diabetic Fatty rats (ZDF) compared to their lean counterparts (ZL). Both strains were fed the normolipidic diet. The injected nitroprusside dose was 600 pmoles. N=10 per group. *: significantly different (p
< 0.05). Extracted from (51).
Aging also influences the effects of abdominal obesity on coronary perfusion. Coronary EDV, EIV and ECVA were determined at the ages of 3 (young), 6 (young adult), 11 (middle aged) and 17 (old) months in Wistar rats fed an equilibrated diet. These parameters of cardiac function were compared to the changes in abdominal adiposity and glucose tolerance.
E D V ( % ) 0 5 10 15 20 25 30 a b a,b b Y YA MA O A bd om in al f at m as s (g /k g) 0 20 40 60 80 E IV ( % ) 0 20 40 60 80 AFM EIV a b b b
*
¤ ¤ ¤ Y YA MA O A B G lu co se in to le ra nc e (a re a un de r th e cu rv e in a rb it ra ry u ni ts ) 0 200 400 600 800 E C V A ( N e qu iv al en ts in p m ol es ) 0 200 400 600 800 GI ECVA C Y YA MA O a b c a,c*
¤*
*
Figure 18. Effects of aging on the endothelial-dependent vasodilatation (EDV, panel A), the endothelial-independent vasodilatation (EIV) and abdominal fat mass (AFM, panel B) as well
as the endothelial cell vasodilatation activity (ECVA) and glucose intolerance (GI, panel C). All the animals were Wistar rats fed the normolipidic diet. N: nitroprussiate. a,b,c: means of EDV, AFM and GI without a common letter are significantly different. *,¤: means of EIV and
ECVA without a common sign are significantly different. From (48).
As seen in Fig. 18A, the EDV gradually decreased with aging, suggesting that the heart’s capacity for contractile performance was progressively compromised with time. This progression has already been described in the literature (24-26), but the influence of aging on the individual behaviour of endothelial and smooth muscle cells was not known. Our work allowed the determination of the aged-related changes in EIV (Fig. 18B), seen as high at the age of 3 months, when the smooth muscle cell relaxation capacities decreased between 3 and 6 months and thereafter plateaued at a low value. This was similar to the age-related effect on myocardial
contractility (see Fig. 10). EIV had an inverse relationship compared to the gain in abdominal fat mass: when rats were 3 month old, the abdominal fat mass was low and the EIV was high; between 3 and 6 months, when the abdominal fat mass increased, the EIV decreased and it remained low thereafter when the abdominal fat mass was maintained at a high value.
Age (month) 0 3 6 9 12 15 18 P ho sp ho ry la te d eN O S a t S er 1 17 7 (a rb it ra ry u ni t) 0,0 0,5 1,0 1,5 2,0 a b a a
Figure 19. Effects of aging on the active form (phosphorylated at serine 1177) of the endothelial nitric oxide synthase (eNOS). The assay was performed in the myocardium of
Wistar rats fed the normolipidic diet. Ser: serine. a,b: significantly different. From (48).
However, for endothelial cell vasodilatation capacity this was not related to the abdominal fat mass, but rather to the rate of glucose intolerance (Fig. 18C). Glucose intolerance was low at 3 months of age, but rapidly increased to a paroxysmal value at 6 months in parallel with the gain of abdominal fat mass; thereafter, when the abdominal fat mass was high, but stable, the animals adapted and glucose intolerance progressively recovered a value close to that measured in
3 month old animals. ECVA evolved similarly with a paroxysm at 6 months and a return to the basal values thereafter: the greater the glucose intolerance, the greater the ECVA. Fig. 19 shows that glucose intolerance-related increase in ECVA is related to the activity of eNOS. Phosphorylated eNOS at Ser 1177 reflects active eNOS: the activity of this enzyme paralleled the age-related modifications of glucose intolerance and ECVA indicating that glucose intolerance contributed to stimulate eNOS and to increase the ECVA when this parameter was measured according to the age.
2.6 - Conclusions
Our data show that abdominal adiposity is associated with an increased cardiac mechanical function supported by augmented cardiac perfusion capacities. Both phenomena help the organism to fight against the weight gain, since they contributes to maintain the physical capacities of the obese individual. They seem to be related to the accumulation of arachidonic acid in membrane phospholipids which stimulates the contractile function of cardiomyocytes and favour dilatation of the coronary micro-vessels. However, after this phase of gain in physical activity, cardiac function is known to steadily decline until the development of heart failure (24). The long-term phenomenon could also be related to the accumulation of arachidonic acid in cardiac phospholipids. Indeed, arachidonic acid favours the formation of the 2-series prostaglandins which are known to have pro-inflammatory effects (66). These molecules may contribute to deterioration of cardiac function in the long term and leading to cardiac failure. Improvement of cardiac function in obese individuals may thus be influenced through dietary n-3 polyunsaturated fatty acid intake which is recognized to decrease arachidonic acid in cardiac membrane (67, 68) and favour the formation of lipid mediators with anti-inflammatory properties (66).
3 - OBESITY PARADOX 3.1 - Introduction
Evidence in support of obesity being associated with an increased risk of developing cardiovascular disease, has been reported by Kenchaiah et al. (69). They examined the incidence of heart failure in 5881 Framingham participants according to the obesity status. For women and men: compared to normal weight subjects the overweight have an increased risk of heart failure, and compared to overweight, the obese have a higher risk of developing the pathology. If the risk of developing a cardiac pathology is augmented when the body mass index (BMI) increases, the rate of survival during or after this pathology is increased in obese individuals. Horwich et al. (70) depicted the phenomenon known as the obesity paradox by describing the rate of survival at 5 years of patients with heart failure. They showed that the highest the BMI had the lowest the mortality rate. Lavie et al. (71) examined this more closely by paralleling the 3-year survival rate of patients presenting coronary heart disease with the body composition. They categorized their patients in four groups: 1) those with low body fat and low lean mass indexes which displayed the lowest survival rate; 2) those with high body fat and low lean mass indexes which had a slight but not significant augmentation of the survival rate; 3) those with a low body fat but high lean mass indexes which continued to increase their survival rate; and 4) those with high body fat and lean mass indexes which had the highest survival rate. Only the two extreme groups (low body fat and low lean mass indexes vs. high body fat and high lean mass indexes) displayed statistical significant differences in their survival rate. However, this study highlights the importance of adipose and muscular masses on the survival after a coronary heart disease. In 2013, the same group (72) published a key-study on the obesity paradox in which they evaluated the influence of cardio-respiratory fitness on the relationship between survival rate during heart failure and BMI. They showed the classical positive relationship between survival


![Systematic investigation of composition effects on the radiation-induced attenuation mechanisms of aluminosilicate, Yb-doped silicate, Yb- and Yb,Ce-doped aluminosilicate fiber preforms [Invited]](data:image/gif;base64,R0lGODlhAQABAIAAAP///wAAACH5BAEAAAAALAAAAAABAAEAAAICRAEAOw==)