HAL Id: hal-02140712
https://hal.archives-ouvertes.fr/hal-02140712
Submitted on 27 May 2019
HAL is a multi-disciplinary open access
archive for the deposit and dissemination of
sci-entific research documents, whether they are
pub-lished or not. The documents may come from
teaching and research institutions in France or
abroad, or from public or private research centers.
L’archive ouverte pluridisciplinaire HAL, est
destinée au dépôt et à la diffusion de documents
scientifiques de niveau recherche, publiés ou non,
émanant des établissements d’enseignement et de
recherche français ou étrangers, des laboratoires
publics ou privés.
aluminosilicate, Yb-doped silicate, Yb- and
Yb,Ce-doped aluminosilicate fiber preforms [Invited]
Franck Mady, Angela Guttilla, Mourad Benabdesselam, Wilfried Blanc
To cite this version:
Franck Mady, Angela Guttilla, Mourad Benabdesselam, Wilfried Blanc. Systematic investigation of
composition effects on the radiation-induced attenuation mechanisms of aluminosilicate, Yb-doped
silicate, Yb- and Yb,Ce-doped aluminosilicate fiber preforms [Invited]. Optical Materials Express,
OSA pub, 2019, 9 (6), pp.2466. �10.1364/OME.9.002466�. �hal-02140712�
Systematic investigation of composition effects
on the radiation-induced attenuation
mechanisms of aluminosilicate, Yb-doped
silicate, Yb- and Yb,Ce-doped aluminosilicate
fiber preforms
F
RANCKM
ADY,
*A
NGELAG
UTTILLA, M
OURADB
ENABDESSELAM,
ANDW
ILFRIEDB
LANCUniversité Côte d’Azur, CNRS, Institute of Physics of Nice (INPHYNI), UMR 7010, Nice, France
*franck.mady@univ-cotedazur.fr
Abstract: We present an original experimental approach to the investigation of radiation-induced
attenuation (RIA) mechanisms in optical fiber preforms. This protocol combines thermally stimulated luminescence (TSL) measurements with the characterization of RIA annealing during TSL readouts. It is systematically applied to compositions of increasing complexity to resolve the specific role played by each dopant. Silicate, aluminosilicate, Yb-doped silicate, Yb-doped and Yb,Ce-codoped aluminosilicate preform samples are examined. Annealing processes are described in detail as a function of temperature throughout TSL readouts. The protocol reveals the temperature ranges at which trapped-carrier states forming intrinsic or dopant-related color centers are released, thus enabling the assessment of their activation energies. Metastable Ce2+
ions are proved to be formed by electron trapping under irradiation. Along with the formation of Ce3++, they play a crucial role in the RIA mitigation.
© 2019 Optical Society of America under the terms of theOSA Open Access Publishing Agreement
1. Introduction
The optical fiber technology has permitted to design high-power fiber laser sources [1,2] and offered novel metrological opportunities for the distributed sensing of temperature, pressure, strain or radiation doses [3]. Both application fields have however to deal with the formation of silica- or dopant-related color centers (CCs) which cause excess optical losses from the ultraviolet-visible (UV-VIS) down to the near-infrared (NIR) optical ranges. In fiber amplifiers and lasers, this detrimental effect is induced by pump photons through the decisive help of most rare-earth ions, notably ytterbium (Yb). It is referred to as photodarkening or PD (see e.g. [2] for a recent review). Fiber-based sensors rather use passive fibers, but they are often intended for the remote monitoring of harsh radiative environments (Ref. [3] gives a topical example). Then, the CC formation is due to ionizing radiations and it results into the so-called radiation-induced attenuation or RIA (see [4,5] for reviews of radiation effects). Space-based applications, where active fibers (in fiber optic gyroscopes or power laser sources) are simultaneously submitted to pumping and radiations, combine the PD and RIA issues and raise the question of their interaction. An interplay has been demonstrated and PD-related CCs were shown to be the same as part of those involved in RIA [6,7]. An expression of these shared origins lies in the fact that both degradation types are efficiently mitigated by cerium (Ce) co-doping [2,8–12]. This empirical recipe has enabled the fabrication of commercially-available radiation- and PD-resistant fibers, but it did not put an end to the quest for the elucidation of PD and RIA mechanisms. Radiation-induced defects have been extensively studied by the means of optical absorption (OA), luminescence, electron spin resonance (ESR) techniques and their combination (see [5,13–14] for reviews). Almost all intrinsic and dopant-related CCs that have been identified so far in
#359440 https://doi.org/10.1364/OME.9.002466 Journal © 2019 Received 1 Feb 2019; revised 4 Apr 2019; accepted 5 Apr 2019; published 6 May 2019
silica-based glasses have OA bands in the VIS and UV ranges (only one phosphorus-related color center, the P1 center, has a peak absorption at 1570 nm) [4,5,13]. For most of them, structural models have been debated, generation processes have been proposed in terms of photoionization or carrier trapping, and thermal stability has been assessed by isochronal annealing experiments [13–15]. Based on this rich and key knowledge, a much-refined understanding of the RIA or PD mechanisms is now expected which should reveal on which defect free carriers trap preferably, how trapping centers compete, how they transform over time or temperature, how they anneal. . . More quantitative information is also needed for future simulations, notably on thermal-release activation energies. Such data are important to anticipate the impact of temperature or time on the optical degradation. They also determine the dependence of photobleaching cross-sections on photon energy [16]. Optical (PD loss or RIA monitoring, fluorescence) and ESR measurements are of course of crucial interest to follow the CCs evolution with temperature, dose, pumping or annealing time. Their ability to provide an overview of the mechanisms is though limited, even if correlations between pairs of radiation-induced centers could be highlighted [12,17]. In addition, no information on activation energies can be expected from such measurements. Efforts made at modeling PD and RIA thus relied on kinetic equations including phenomenological parameters, not on an in-depth description of key physical processes [18,19].
The only luminescence technique that is known to provide thermal activation energies is the thermally-stimulated luminescence (TSL) [20], which was rarely applied to the study of PD or RIA [6,21]. The TSL technique nevertheless offers the great advantage of probing the thermal annealing of radiation-induced defects. It a priori provides an obvious solution to investigate recovery mechanisms and, by reverse reasoning, those of RIA or PD build-up. This opportunity has not been much exploited so far because a key challenge remains: trapping levels characterized by TSL have still to be associated with the CCs contributing to radiation-induced optical losses.
This work precisely aims at making a proper link between TSL and optical characterizations, to advance the understanding of the CC formation and annealing processes. We specifically focus on the question of RIA which involves a larger set of trapped states than PD [6]. Even if PD is not directly addressed, its mechanisms could be envisaged from those of RIA after making proper adjustments (particularly as regards intra-gap ionization processes). The objective of this article is in fact twofold.
First, we introduce an original experimental approach, based on the coupling of TSL character-izations (TSL curves and spectra) with the monitoring of the RIA annealing in the same heating conditions as in TSL readouts. On one hand, the TSL technique is used to probe the trapping levels at which radiation-induced states are formed, and to reveal species that are reformed by recombination during thermal annealing. On the other hand, the progressive annealing of the RIA is followed along the same heating profile as in the TSL readout. This allows us to build a ‘bleaching map’ which gives the annealing rate at any wavelength of the RIA spectrum and at any temperature of the TSL process. Since RIA spectra can be decomposed in various OA bands attributed to well-known CCs in silica, a straightforward connection is made between CCs and the trapping levels characterized by TSL. A decisive step is thus made towards the determination of the CC activation energies.
Second, we demonstrate the benefit of this approach by examining the results it provides on various fiber preform samples, the chemical composition of which is progressively complicated. Undoped silica, aluminosilicate, Yb-doped silicate, Yb-doped and Yb,Ce-codoped aluminosilicate preforms are investigated. This allowed us to gain insight into mechanisms in a systematic way, highlighting the specific role played by each newly added dopant. The way the Ce codoping hardens the glass against RIA is notably discussed, with novel conclusions compared with usual interpretations [8–12].
2. Materials and methods
Since this study aims at investigating the RIA mechanisms in terms of formation and annealing of CCs, it focuses on the characterization of the RIA that develops in the VIS and near UV ranges. In these spectral regions, where the attenuation of the pristine fiber and the RIA levels are both high, RIA is much easily characterized on short distances. Rather than fibers, we thus considered thin slices of fiber preforms as samples. OA bands of CCs formed in bulk glasses, as preforms, are not different from those observed in fibers [4]. Therefore, mechanisms investigated in preform samples are representative of those at play in fibers, at least qualitatively.
2.1. Samples
Samples consisted of 0.5-1.5 mm-thick disks cut out from silica-based fiber preforms fabricated by the standard Modified Chemical Vapor Deposition (MCVD) and solution doping techniques in our institute. The MCVD process used Heraeus F300 high-purity silica tubes as substrate. Preform slices were about 1 cm and 1 mm in external and core diameters, respectively. They were polished on both faces to allow OA measurements. The sample names, compositions and in-core dopant concentrations are summarized in Table1. Each single sample (the same glass disk) was used for both optical (RIA) and TSL measurements. The silicate sample S was made by the MCVD technique following the same process as the others, but depositing undoped silica in the substrate tube. To highlight the role of each dopant along the progressive complexification of the glass composition, the concentration of common dopants would have been kept constant when passing from one dopant (AS and S:Yb) to two (AS:Yb) or three (AS:Yb,Ce) co-dopants. This systematic variation is however hard to achieve by solution doping. We thus selected a sample series where the concentration of at least one dopant was maintained constant. When the concentration of a common dopant changes when passing from one sample to another, it varies at worst by a 2.6 factor. We report on these selected samples for simplicity, but presented results are well representative of those we obtained for other elemental concentrations.
Table 1. Names, compositions, thickness e and dopant concentrations of the preform samples used in this work (dopant contents in wt%, determined from Energy-Dispersive X-ray spectrometry
measurements)
2.2. Principle and benefits of the TSL technique
TSL measurements are conducted by heating irradiated samples at a constant heating rate to anneal radiation-induced trapped states progressively. The luminescence is then emitted upon radiative recombination of carriers released from traps with carriers of opposite polarity deeply trapped on thermally-stable levels (termed ‘recombination centers’ or RC). Carriers are progressively released from levels of increasing depths throughout the sample warming. Plotting the TSL intensity as a function of temperature gives a curve made of several peaks (one peak for each trapping level in principle) whose distribution along the temperature axis reflects that of trapping depths. Since trapping levels are closely distributed in disordered materials, TSL curves from glasses often consist of poorly-resolved broad peaks. It is natural to investigate the RIA by TSL,
since CCs specifically correspond to trapped carriers. Those formed in shallow trapped-states are the most critical for the thermal stability of PD or RIA. They are annealed by carrier detrapping and contribute to TSL peaks. Those formed in very deep states remain thermally stable during the TSL readout and serve as RC. They are only annealed thanks to recombination events, which reform their precursor in excited state and produces the subsequent TSL emission. Contrary to fluorescence techniques, which reveal CCs created by irradiation, the TSL spectrum contains characteristic emissions of those centers deleted by irradiation and reformed by annealing. This is a major asset to examine mechanisms.
2.3. Irradiations and TSL measurements
Preform samples were irradiated at room temperature (RT) in the beam of an INEL XRG3D copper-anode x-ray tube operated at 30 kV. The dose rate was 670 Gy(SiO2) min−1, as determined
by a PTW 23342 ionization chamber, the related UnidosE electrometer and proper recalibration (to pass from the dose in air given by the electrometer to that in silica). This value allowed us to irradiate samples at a typical dose of 10 kGy(SiO2) in 15 minutes.
TSL measurements were done with a laboratory-made TSL reader where the sample is placed on a copper plate that can be resistively heated from RT (∼19 °C) to 600 °C. A PID regulation is used to achieve linear temperature profiles with constant heating rates q in the 0.1-5 °C s−1
range. Presented experiments were made at q = 1 °C s−1. TSL was acquired by a water-cooled
photo-multiplier tube (PMT) Philips XP-262B to obtain UV-VIS spectrally-integrated glow curves (in the range 290-620 nm, approximately) or by a Princeton Instruments Fergie spectrometer to resolve TSL spectra in the 200-1200 nm range. Both detection types complement each other. The PMT is very efficient to detect TSL in the VIS range but is quite blind with respect to NIR emissions that are much more efficiently revealed by the spectrometer. At high temperatures, TSL is corrected from the intense NIR black body radiation which is strongly detected, even by the PMT. This correction consists in subtracting the TSL response of un-irradiated samples from that of irradiated ones. The result is not accurate at high temperature, where both the raw and background curves are very intense due to the thermal emission, but where the difference between these curves is a priori small. In TSL curves and spectra reported below, the temperature scale is therefore restricted to 450 or 500 °C, even if heating was well continued up to 600 °C. The TSL from entire samples, including core and cladding, was detected. However, cladding is made of the F300 substrate tube and we checked beforehand that this high-purity silica does not produce any detectable TSL at similar dose levels as those given to the samples. Hence the measured TSL is that of the preform core. We also checked that TSL features, including TSL curves and spectra of all samples, exhibit qualitatively the same components for doses ranging from 77 Gy(SiO2) up to 1 MGy(SiO2). This suggests that the trap structures and recombination
mechanisms we report in the following sections do not significantly depend on the dose. Part of the radiation-induced defects can be unstable at RT in silica (notably in Yb-free samples). To characterize the widest defect range, we best reduced isothermal annealing effects by limiting the irradiation time (15 minutes) and by performing TSL or RIA measurements immediately after irradiation. In view of the necessary sample handling from irradiator to other setups, the ‘fading time’ between irradiations and readouts was always fixed to 90 seconds. Short irradiation times and immediate characterization are noticeable advantages offered by X rays as compared to remote gamma irradiations. The fading effect is illustrated for the S sample. 2.4. RIA measurements and the thermal annealing protocol
A Perkin-Elmer Lambda 1050 UV-VIS-NIR spectrophotometer was used to measure the core-optical absorption above 200 nm. Adequately perforated plates were used in the sample beamline as sample holder, but also in the reference beamline, to probe the doped core only. The pure silica S sample has no guiding core; then perforated plates were used to evaluate OA in the central
region made of MCVD-deposited silica. The RIA was calculated from the absorbances Abeforeand
Aaftermeasured before and after irradiation, respectively, according to RIA (dB m−1) = 10×(Aafter
– Abefore)/e, where e is the sample thickness (in meters). Under soft X rays, radiation-induced
changes in the refractive index of silica-based glasses are very small [11]. Their impact on the reflection coefficient at the sample entrance is therefore negligible. The loss observed in the sample transmission is then largely dominated by radiation-induced absorption in the sample bulk. Consequently, the RIA estimated from the relationship above merely reflect the generation of CCs, as usually assumed (see e.g. [4–6,11]).
To make the sought connection between TSL mechanisms and RIA, thermal annealing was investigated in the TSL conditions according to the following procedure: the OA of pristine samples was measured before irradiation. After exposure to X rays at RT, the OA was again recorded, thus giving the RIA, and the sample was heated up to Tstop= 50 °C on the TSL reader,
at the same heating rate as in TSL readouts (q = 1°C s−1). The new core OA was measured after
cooling at RT. Then, the sample was heated from RT to Tstop= 100°C and the new core OA
was measured, etc. . . This step was repeated to monitor the core OA at RT after Tstop= 150,
200, 250. . . up to 550 °C. In this way, the partial RIA recovery within 50 °C intervals could be followed correlatively to TSL peaks and emissions. From these measurements, we built thermal ‘bleaching maps’ by differentiating RIA spectra with respect to Tstop. At any wavelength, the
absolute RIA variation around Tstopvalues were normalized to the total RIA to obtain the relative
bleaching in each 50 °C interval in % of the RIA at the considered wavelength. Casted into the form of a color contour plot (the Origin software was used), these data are interpolated to provide an overview of the RIA annealing rate as a function of both wavelength and temperature throughout the TSL readout.
3. The preliminary case of undoped silica (sample S)
The RIA of the S sample is shown in Fig.1together with a Gaussian decomposition attempt. Gaussian components can be assigned to the so-called SiE’ and Non-Bridging Oxygen Hole Centers (NBOHCs) [13–15]. Centers at 5.75-5.83 eV and full width at half maximum (FWHM) of 0.62-1.05 eV have been indeed widely admitted for the OA band of SiE’ centers [13,22–24]. The NBOHC band at 4.8 eV (FWHM = 1.05 eV) has similar characteristics as usually reported ones (center at 4.75-4.9 eV and width of 1.05 eV [13,22–24]). We also attributed the 6.82 eV band (FWHM = 1.29 eV) to NBOHCs, following the proposal by Hosono et al. that NBOHCs also absorb at 6.8 eV (FWHM = 1.76 eV) [25]. SiE’ centers correspond to threefold oxygen coordinated silicon atoms having an unpaired electron (≡Si•). Almost all variants of SiE’ centers have been described as holes trapped at neutral oxygen vacancies [14,15]. NBOHCs correspond to oxygen dangling bonds (≡Si–O•) that mainly result from the radiolysis of O-H bonds [14]. These centers feature a hole localized on the half-filled orbital of the non-bridging oxygen [26]. A SiE’-NBOHC pair generation mechanism has also been proposed based on the radiolysis of a strained ≡Si–O–Si≡ bridge giving ≡Si–O• + •Si≡ [28,29]. The RIA level is ‘small’ compared to the one of doped samples. It reaches about 100 dB m−1in the UV region. Consistently, the TSL
measured from this sample, displayed in Fig.2, is of low intensity.
The TSL curve measured with the PMT (Fig.2(a)) passes a maximum around 80 °C. The fact that it starts from a non-zero level reveals that a phosphorescence does exist at RT. Some carriers are already released during and after irradiation and recombine radiatively before the TSL readout. This isothermal annealing (at RT) can be confirmed by measuring the TSL after longer irradiation or fading time. Figure2(a) shows for instance the contour plot of the TSL obtained after a 1-hour irradiation. The TSL spectrum is basically the same as the one measured after the 15-min exposure (not shown), but the TSL emission now passes its maximum around 125 °C. Carriers in shallow traps had then more time to detrap during irradiation: they were released and the distribution of occupied levels submitted to the TSL readout shifted towards deeper states.
Fig. 1.RIA spectrum of the S sample after 10 kGy(SiO2) and a Gaussian decomposition
attempt (peak positions and widths are indicated, with assignment).
Fig. 2.(a): TSL curve after a 10 kGy(SiO2) dose given in 15 min (right vertical axis) and
TSL contour plot after a 1-h irradiation (see the grayscale and the emission wavelength in the left vertical axis), (b) detail of the TSL spectrum, integrated from 20 to 220 °C, and its Gaussian decomposition.
The emission peak of the contour plot is therefore shifted towards high temperatures. In fact, the demarcation energy, that roughly separates empty from occupied trapping levels at a given temperature, shifts continuously towards greater depths with time.
The detailed TSL spectrum of the S sample (Fig.2(b)) indicates that TSL is mainly emitted around 2.7 eV. This emission is characteristic of Oxygen Deficient Centers (Si-ODCs) [13,29–31]. Si-ODCs also possess a photoluminescence (PL) band at 4.4 eV [13] that is not present in the TSL spectrum, as already noted in [30] (weakly present in [29]). Conversely, the satellite emission at 2.2 eV has never been noticed in PL spectra of silica-based glasses. It might be present but not separated from the dominant 2.7 eV band in Refs. [29–31] where a 0.8 eV FWHM was found for 2.7 eV band, a much larger value than in Fig.2(b). This 2.2 eV TSL band might be also assigned to Si-ODCs since the energy model of this defect well involves a triplet-triplet transition around 2.2 eV [13]. Even if the presented spectrum is integrated between 20 and 220 °C, it remains noisy compared with the amplified PMT signal (TSL curve, Fig.2(a)). This well illustrates the advantage of PMT for measuring weak visible emissions. Whatever, Si-ODCs are clearly reformed by recombination during the thermal annealing process accompanying the TSL readout. Two structural models exist for Si-ODCs, one under the form of a neutral oxygen vacancy between two silicon atoms, [≡Si:Si≡], and the other as a twofold-coordinated silicon (=Si:)
[13,14]. Both can trap a hole to give a SiE’ center [13]. Since SiE’ centers are formed during irradiation as proved by the RIA spectrum, the reformation of Si-ODCs during TSL could be readily considered the result of the recombination of thermally-released electrons at such trapped-hole centers. This point of view was however questioned by Trukhin et al. who gave experimental evidence that Si-ODCs trap electrons [29,30]. The 2.7 eV emission was indeed found to take place upon hole detrapping in TSL and x-ray-induced radioluminescence (XRL). These authors proposed a mechanism where radiation-excited electrons trap at neutral oxygen vacancies (termed ODC(I) in [13,29]) that are then changed into modified ODC(II):e−centers,
where ODC(II) is a twofold-coordinated silicon and e−denotes an electron. The recombination
of holes at such centers was explained to produce a ‘modified’ Si-ODC luminescence where the 4.4 eV band is absent or of low intensity, as seen in Fig.2(b). According to this recombination process, the TSL curve of Fig.2indicates that holes are continuously detrapped throughout the TSL readout, at least up to 400 °C.
To go further in the mechanism investigation, a proper correlation between TSL and RIA annealing is needed. Unfortunately, we could not characterize reliably the bleaching of sample S in TSL conditions, due to its very low RIA level.
4. Adding a single dopant: aluminosilicate (AS) and Yb-doped silicate (S:Yb)
4.1. The AS sample
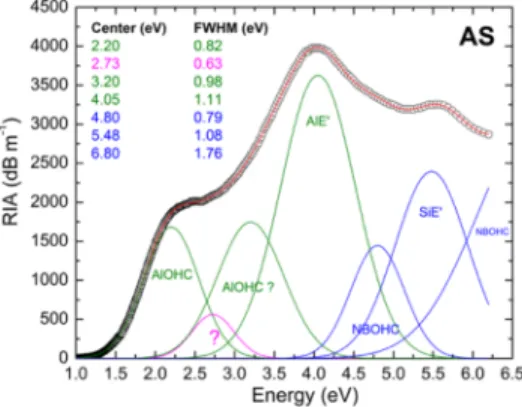
The RIA of the AS sample is presented in Fig.3. A Gaussian decomposition attempt is again proposed which includes similar SiE’ and NBOHC components as those found for the S sample. Lower-energy bands are necessarily associated with Al-related defects like the Al-Oxygen Hole Center (AlOHC) and the AlE’ center [22]. AlOHCs were argued to have OA bands at 2.3 and 3.2 eV, whereas the 4.1-eV band is assigned to AlE’ centers [22]. The fitting procedure was initiated with identical centers and widths as in Fig.1for the Si-related centers, or in accordance with values of [22] for the AlOHC and AlE’ centers. At the end of the optimization process, band positions and widths rather correspond to those of Fig.1for Si-related centers, and they still match those of [22] for Al-related centers. We nevertheless note that the OA band of SiE’ centers is slightly red-shifted down to 5.5 eV (about 5% below its usual location around 5.8 eV). This shift could be due to an enhanced contribution of a SiE’ center variant in this sample, namely SiE’-β centers that have an OA band at 5.41 eV (FWHM = 0.62 eV) [23]. The consequence is that the width of the NBOHC band at 4.8 eV is reduced to 0.8 eV instead of 1.05 eV (see [13,22–24] and Fig.1). Finally, an additional OA band is required around 2.7 eV.
Fig. 3.RIA spectrum of the AS sample after 10 kGy(SiO2) and a Gaussian decomposition
AlOHC correspond to holes trapped at negatively-charged fourfold oxygen coordinated aluminum units [≡Al–O–Si≡] [15,32]. AlE’ centers are formed by electrons trapped at neutral oxygen vacancies shared by two Al atoms [≡Al Al≡] (see [32]) or more probably at positively charged oxygen ‘pseudo vacancies’ [≡Al+Si≡] [14,15]. AlE’ centers therefore correspond to
[≡Al•] units. Adding Al (0.5%wt) to S markedly increases the RIA. Its maximum level now reaches ∼4000 dB m−1around 4 eV (310 nm). Beyond Al-related OA bands, the presence of Al
stimulated the formation of SiE’ centers and NBOHCs whose bands have been increased from ∼70 to 2500 dB m−1and from 30 to 150 dB m−1, respectively.
TSL features of the AS sample are presented in Fig.4(a) and (b). The glow curve (Fig.4(b), solid line), measured with the PMT, is plotted in log scale to highlight a broad shoulder between 200 and 350 °C. The contour plot shows that TSL is made of the same visible emission throughout the temperature range, the peak intensity being reached at ∼65 °C. The TSL spectrum of Fig.4(a) is an average of the most intense spectra measured between 50 and 100 °C. The TSL spectrum of the S sample, taken from Fig.2(b), is also displayed for comparison (relative intensities are not significant). The 470 nm (2.7 eV) emission band of the S sample is still present for the AS sample, even enhanced, again revealing the reformation of silica-related ODCs (Si-ODCs) during thermal annealing. The main additional band at 405 nm (3.05 eV), together with the sharp peak at 313 nm (3.96 eV) are due to the presence of Al. Since these various emission bands parallel each other along the TSL process, they all result from the recombination of the same type of carriers. If the Si-ODC emission (470 nm) is due to the recombination of thermally-released holes (see the S sample section), this must be the case of Al-related emissions. Consequently, Al-induced recombination centers must be trapped-electron centers. The only Al-centers unambiguously described as trapped electrons in Al-doped silica are AlE’ centers (electrons trapped at Al-related oxygen vacancies). Thus, the main TSL band at 405 nm can be assigned to oxygen vacancies reformed upon recombination of holes at AlE’ centers. This interpretation is tempting because the involvement of such Al-related oxygen deficient centers – hereafter termed Al-ODCs – in TSL parallels the intrinsic process where Si-ODCs are reformed. It is noteworthy that, even in Ge-doped silica, the TSL annealing mechanism involve the reformation of Ge-ODCs (revealed by their typical blue-violet emission [33,34]). Further support is provided by Putsovarov et al. who reported a 198-nm-excited PL band at 3 eV (FWHM ∼ 1 eV) in amorphous alumina (a-Al2O3)
[35]. These authors attributed this PL band, which is very like our Al-related TSL band at 405 nm (3.05 eV, FWHM ∼ 0.95 eV), to oxygen vacancies in a-Al2O3.
The results of the thermal annealing protocol conducted on the AS sample are summarized in Fig.4(c) and (d). Its straightforward illustration is given in Fig. 4(c): the RIA decreases progressively as the Tstoptemperature is increased by steps of 50 °C. RIA is almost completely
annealed at Tstop= 450 °C. In fact, full bleaching is achieved when heating is continued to 600 °C
and we observed that repeating a TSL readout on the bleached sample does not produce any further signal. Therefore, the trap levels probed by TSL are well related to CCs responsible for RIA and the temperature range of the TSL readout is sufficient to bleach all the significant radiation-induced OA bands. The bleaching map of Fig.4(d) was built from data in Fig.4(c) according to the procedure detailed in section2.4. In this map, which can be directly correlated with TSL in the figure above, black lines mark the centers of the OA bands used in the Gaussian decomposition of Fig.3. As a reading guideline, we can mention for instance that ∼22% of the RIA at 350 nm is bleached between 50 and 100 °C. AlE’ centers present an intense recovery peak at 50-100 °C followed by a significant tail between 150 and 350 °C. They in fact anneal in a way that parallels the TSL curve of Fig.4(b), thus confirming that TSL is emitted upon recombination at AlE’ centers (that then disappear). Whereas the recovery of AlE’ centers goes with a partial annealing of AlOHCs around 75 °C (main TSL and recovery peaks), it rather accompanies the disappearance of SiE’ centers around 275 °C. The annealing of AlOHCs is completed above 325 °C. Since AlE’ centers are recombined by holes, it is clear that trapped holes are continuously
Fig. 4.(a) Mean TSL spectrum (between 50 and 100 °C) of the AS sample compared to
that of obtained for the S sample, (b) TSL curve (right vertical scale) and TSL contour plot (grayscale) after irradiation at 10 kGy(SiO2), (c) RIA and its annealing at successive Tstop
temperatures (Tstopvalues in plot labels), (d) Bleaching map built from (c), lines mark the
centers of the RIA bands used in Fig.3.
released along the recovery process. In the main peak (50-100 °C), holes can be released neither from SiE’ centers nor from AlOHCs, since these centers are still present at the onset of their final recovery at ∼225 and ∼325 °C, respectively (they correspond to deeper trapped states). It is more likely that holes are released from shallow intrinsic levels, as in the case of the S sample, in the main TSL peak. They are rather detrapped from SiE’ centers between 200 and 350 °C, giving rise to the TSL shoulder seen within this range, and from AlOHCs above 325 °C. Holes released from AlOHCs only contribute to the tail of TSL (close to the noise level) since the reservoir of AlE’ centers has been already exhausted below 350 °C. It remains that the AlE’ recovery peak in the 50-150 °C range is accompanied by a partial loss of AlOHCs. This could be due to some AlE’-AlOHC pair annealing process (their creation by pair was suggested [22]) or, alternatively, to the recombination of AlOHCs by electrons released from shallow intrinsic traps. The last hypothesis is preferred since it explains why SiE’ centers also anneal between 50 and 100 °C (about 7-10% of the RIA at 5.8 eV is bleached within this range). This recovery is however limited because a SiE’ generation process is expected to take place simultaneously. Indeed, holes released from shallow states, that mainly recombine at AlE’ centers, may also increase the number of SiE’ centers between 50 and 150 °C by re-trapping to form such deeper states. Supporting this idea, we emphasize that a low-temperature increase of the SiE’ density, preceding complete recovery, was already demonstrated [22]. The same effect should exist for AlOHCs, but their greater relative recovery in the 50-100 °C range suggests that re-trapping at the corresponding precursors is less efficient.
4.2. The S:Yb sample
The attenuation spectra of the S:Yb sample, before and after irradiation, are presented in Fig.5. Also shown are the RIA spectrum and a possible Gaussian decomposition. The absorption pattern of Yb3+ions can be seen between 1.2 and 1.5 eV (resonant absorption line at 1.27 eV, 976 nm).
The attenuation of the pristine sample features a broad OA band peaking at 5.4 eV. Because this strong UV absorption was not present in the pristine S sample, it must be due to ytterbium. The most natural candidate is the charge transfer (CT) absorption of Yb3+ions. Absorption in this
CT band transfers an electron from a nearby oxygen ligand to an Yb3+ion which is then reduced
into a divalent ion Yb2+. The CT absorption of Yb3+ions has been characterized by Engholm
et al. [36–38] or Rybaltovsky et al. [39] in aluminosilicate glasses, where it was associated
with strong OA bands at 5.3 and 6.4 eV [37] or 5.1 and 6.5 eV [39]. In the absence of Al, the assumed CT band is narrowed around 5.4 eV. Adding ytterbium (1.2 wt%) to silica enhances its RIA dramatically (compare Fig.5to Fig.1). Clear evidences were given for the formation of Yb2+ions in Yb-doped silica under ionizing irradiation [6,11,40,42]. In this case however, free
electron-hole pairs are generated across the bandgap and Yb2+ions are no longer created by CT.
They rather result from electron trapping at an Yb3+ion that can be remote from the trapped hole.
Such trapped-electron states are very stable since the ground level of divalent Yb ions is deeply located in the bandgap [41]. Yb2+ions were shown to have several OA bands above 3 eV (3.2,
3.7, 4.2, 5.33 and 6 eV in [36], 3.1, 3.7, 4.2 and 4.6 in [39] or 3.2, 3.7, 4.2, 4.6, 5.5 and 6.1 eV in [42]). In the Gaussian decomposition of Fig.5, the main Yb2+-ion OA bands are found at
3.41, 3.82, 4.12, 4.45, and 5.27 eV if the positions and widths of the Si-related bands (NBOHCs and SiE’ centers) remain close to those of Fig.1. The fit of the RIA spectra in its visible part required introducing two additional bands at 2.2 and 2.8 eV. The latter might be associated with self-trapped holes, namely the STH2 and STH1 centers, which absorb light at 2.15 and 2.6 eV, respectively [15]. This assignment is however questionable since STH are not expected to be stable at RT (they were found to anneal below 200 K) [15]. Correlatively to the creation of Yb2+ions, the number of trivalent ions must decrease, as their CT absorption band. This surely
explains why the RIA is significantly lower within the range of the CT band, above the maximum of the NBOHC peak. The excess absorption brought by SiE’ centers is partly compensated by the loss in CT absorption.
Fig. 5. Attenuation spectrum of the S:Yb sample before irradiation, after irradiation
at10 kGy(SiO2), and the RIA spectrum. A possible Gaussian decomposition of the RIA is
shown (peak positions and widths are indicated, with probable assignment).
TSL characteristics of the S:Yb sample are displayed in Fig.6(a) and (b). Spectrally-resolved measurements only reveal a NIR emission presenting a sharp peak at 976 nm. The NIR TSL curve raises and then decays rather symmetrically around its maximum at 225 °C (Fig.6(b)).
Undoubtedly, this emission is due to the de-excitation of Yb3+ions between the2F5/2and2F7/2
levels. Relative intensities of the 976-nm line and satellites bands at 920 and 1020 nm vary with temperature, reflecting changes in the occupation probability of the Stark sublevels (Fig.6(a)). However, the inset of Fig.6(a) shows that the emission pattern at 30 °C somewhat differs from the usual shape of the emission cross-section of Yb3+ions in aluminosilicate glasses (see [43] for
instance). It much more resembles the luminescence measured by Engholm et al. upon excitation in the CT band [36]. The latter is triggered by the relaxation of the CT under excitation, when some holes recombine with Yb2+to reform Yb3+ions. Therefore, the NIR TSL demonstrates
the recombination of thermally-released holes with Yb2+ions. Some Yb2+-hole recombination
events can be observed at RT already, due to shallow traps (the NIR TSL curve does not starts strictly from zero at 20°C in Fig.6(b)), and this explains why this emission can be observed in fluorescence experiments [36]. Measuring TSL with the PMT results in a different TSL curve that rapidly reaches a maximum at ∼72 °C before decaying slowly up to 300 °C. This proves that a VIS TSL does also exist, which is in fact too low before the NIR luminescence to be seen in spectra of Fig.6(a) and (b). Using proper (very long) integration times enabled us to identify the 2.7 eV band (Si-ODC emission) as the dominating emission in this VIS TSL. The VIS glow curve is very comparable to the ones measured on the S and AS samples (Fig.2(a) and 4(b)).
Fig. 6.(a) TSL spectra of the S:Yb sample at 30, 140 and 280 °C. Inset: comparison of
the 30°C spectrum (in black) with the usual emission cross-section of Yb3+ions (in red)
and the emission of the CT relaxation (in blue) reproduced from [36], (b) NIR TSL curve (right vertical scale), VIS TSL curve (acquired with PMT, renormalized), and TSL contour plot (grayscale) after a 10 kGy(SiO2) dose, (c) RIA and its annealing at successive Tstop
temperatures (in plot labels), (d) Bleaching map built from (c), lines mark the centers of the bands used in Fig.5.
Conducting the thermal annealing protocol on the S:Yb sample led to the results of Fig.6(c) and (d). Figure6(c) illustrates the progressive annealing of the RIA as the stopping temperature
Tstopis increased. It was used to build the bleaching map of Fig.6(d), which correlates to TSL of
Fig.6(b). Above 225 nm, thermal annealing is found to take place between 125 and 350 °C and presents an intense recovery peak at 225 °C. The recovery of the OA bands attributed to Yb2+
ions notably parallels the NIR TSL emission revealing the reformation of Yb3+. This strongly
support the assignment of the bands between 3 and 4.5 eV (280 and 425 nm) to Yb2+ions. This
also shows that, below 600 °C, Yb3+ions are restored by the recombination of holes at Yb2+ions,
and not by the thermal release of electrons from Yb2+ions. This finding is consistent with the
deep location of the Yb2+ground level in the bandgap [41]. Recovery is more difficult to interpret
below 300 nm (above 4.1 eV), a region where annealing of SiE’ centers (at 5.8 eV), annealing of Yb2+ions (at 4.45 and 5.27 eV according to OA bands used in Fig.5) and restoration of the
Yb3+ CT (at 5.5 eV) overlap. Basically, a positive annealing can be obtained either when the
disappearance of Yb3+ions exceeds the net creation of SiE’ and Yb2+ions or, conversely, when
the creation of Yb3+ions is less important than the net annealing of SiE’ or Yb2+ions (in terms
of OA). We proposed from the study of the AS sample that both holes and electrons are released from shallow intrinsic traps below ∼150 °C. This here imply that, within this range: (i) Yb3+can
re-trap electrons to form deeper trapped states (Yb2+ions), (ii) new SiE’ can be formed by hole
trapping into more stable (deeper) states or (iii) SiE’ can be removed due to recombination by free electrons. The positive values of the relative annealing observed below 250 nm and 150 °C, between 12 and 20%, indicate that the disappearance of the CT absorption by Yb3+ions
outreaches the net OA production (creation minus destruction) by SiE’ centers and Yb2+ions.
Holes released from shallow traps also recombine to reform Si-ODCs, thus producing the VIS TSL that peak at ∼72 °C. A new regime appears above 125 °C, where the restoration of Yb3+
begins to prevail (as seen from TSL). Since trapped-holes forming SiE’ centers were argued to detrap between 200 and 350 °C in the AS sample, it is most probable that holes recombining with Yb2+ ions around 225 °C are here again released from SiE’ centers (supported by the
simultaneous annealing of companion NBOHCs). Now, the positive – but smaller – annealing percentage below 240 nm (above 5.2 eV), conversely indicates that the disappearance of the SiE’ and Yb2+ OA bands slightly dominates the restoration of the Yb3+ ion CT band. Since CT
absorption is strong and hence difficult to balance, it is not surprising to observe a lower recovery percentage around 225°C than below 100 °C. The unknown OA bands at 2.2 and 2.8 eV anneal together with Yb2+ions, also due to hole recombination probably.
5. Cases of co-doping: Yb- and Yb,Ce-doped aluminosilicate glasses
5.1. The effect of Al and Yb co-doping
The RIA of the AS:Yb sample is plotted in Fig.7(a) together with the attenuations measured before and after irradiation. The pristine attenuation presents a strong UV absorption above 4.5 eV with a main band centered at 5.3 eV, in good agreement with the CT bands of Yb3+ions
previously described in aluminosilicate glasses [37]. The RIA of the AS:Yb sample is rather small in the range of the CT band, notably above 4 eV, due to destruction of Yb3+ ions under
irradiation. This loss in trivalent ions is also detectable in the NIR range, where a “hole” is dug in the tail of the RIA spectrum at the position of the resonant absorption by Yb3+ions (Fig.7(b)).
The number of OA bands that possibly take part in the RIA is now too large (intrinsic, Yb- and Al-related bands) to give a Gaussian decomposition; this effort would be meaningless. Instead, we propose two valuable comparisons. Figure7(a) first compares the RIA of the S:Yb and AS:Yb samples to illustrate the impact of aluminum. The S:Yb RIA has been renormalized in order to align the maxima of both spectra in the region of the Yb2+ion absorption. This correspond to a
case where the amount of radiation-induced Yb2+ions is roughly the same. Then, the RIA of the
AS:Yb is smaller than that of S:Yb above 4 eV. For a similar amount of Yb2+ions, the production
of SiE’ centers and NBOHCs is apparently smaller in the AS:Yb sample. The AS:Yb RIA is conversely greater between 2 and 3 eV, in the absorption range of AlOHC. Clearly, the density
of SiE’ and NBOHCs has decreased in the presence of Al in favor of AlOHCs which are other trapped-hole centers. In Fig.7(c), the RIA of the AS:Yb sample is now compared to that of the AS sample to highlight the impact of ytterbium. To simulate a similar concentration of AlOHCs, the AS RIA has been renormalized to present the same level level as the AS:Yb spectrum at 2.3 eV. The most striking effect is the quenching of the strong OA band of AlE’ centers, suggesting that the latter have been mostly replaced by Yb2+ions (which are other trapped-electron centers).
Fig. 7.(a) Attenuation spectrum of the AS:Yb sample before and after irradiation and the
corresponding RIA spectrum. The renormalized RIA spectrum of the S:Yb sample is shown for comparison. (b) Detail of the RIA in the 1-1.5 eV range showing the absorption loss at 976 nm. (c) Comparison between RIA of the AS:Yb and AS samples (the AS RIA is renormalized with respect to that of AS:Yb at 2.3 eV).
TSL characteristics of the AS:Yb sample are displayed in Fig.8(a). Measuring the TSL with the spectrometer only revealed the intense NIR emission of Yb3+ions. Normalized TSL spectra
recorded at 30, 140 and 280 °C are not shown here in addition to the contour plot of Fig.8(a), because they are identical to those reported in Fig.6(a) for the S:Yb sample.
The NIR TSL of Fig.8(a) attest that Yb3+ions are reformed by recombination of holes at
Yb2+ions. The shape of the NIR TSL curve is however specific. After a wide plateau between
100 and 300 °C, it passes a peak at ∼375 °C. The fact that this curve covers the entire temperature range confirms that holes are continuously released along the TSL readout and hence that a continuous and broad distribution of trapped-hole states spreads above the valence band. As for the S:Yb sample, the measurement done with the PMT reveals that a very weak VIS TSL does exist. It is again too low before the NIR emission to be seen in spectra, but proper examination showed it still consists of ODC emissions. The VIS TSL curves also resembles that of previous samples: it passes a peak at ∼75 °C before decaying slowly and showing a shoulder around 275-300 °C. In fact, the most striking property of the TSL contour plot of the AS:Yb sample –
Fig. 8. (a) NIR TSL curve (right vertical scale), VIS TSL curve (acquired with PMT,
renormalized), and TSL contour plot (grayscale) of the AS:Yb sample after irradiation at 10 kGy(SiO2), (b) Bleaching map (black lines locate the main OA band centers)
Fig.8(a) – is the absence of the intense Al-related VIS TSL band at 405 nm observed for the AS sample (Fig.4(a) and (b)), although both samples have approximately the same Al content (0.6 and 0.5 wt%, respectively). In section4.1, this 405-nm TSL band was attributed to Al-ODCs reformed upon recombination of holes at AlE’ centers (themselves formed under irradiation by the trapping of electrons at Al vacancies). Since holes are obviously still released throughout the TSL process, the most straightforward explanation for the remarkable ‘quenching’ of the Al-ODC luminescence is the suppression of the huge majority of AlE’ centers. It thus appears that electrons are much more efficiently captured by Yb3+ions, forming deeply-trapped electrons
in Yb2+ions, instead of being trapped at Al-ODCs to form AlE’ centers. This conclusion, made
from TSL results, is fully consistent with the one drawn from the RIA comparison in Fig.7(c). Efficient electron trapping at Yb3+ions can also explain the weakness of the VIS TSL noticed for
the S:Yb and AS:Yb samples. The latter is likely due to recombination of free holes at some remnant trapped-electron centers (ODC(II):e−centers in S:Yb or AlE’ + ODC(II):e−centers in
AS:Yb). This implies that trapped-hole states have different “affinities” with trapped-electron states: holes recombining at remnant ODC(II):e−or AlE’ centers are preferably released from
shallow traps (low-temperature VIS TSL peak in Fig.6(b) and 8(a)), whereas holes recombining with Yb2+ions are mainly detrapped from deeper states (NIR TSL peak at 225 °C in Fig.6(b),
NIR TSL plateau between 100-300 °C and peak at 375 °C in Fig.8(a)).
The bleaching map obtained with the AS:Yb sample, in Fig.8(b), becomes difficult to analyze because of the multiplicity of centers whose OA bands overlap. In this map, black areas represent
regions of ‘negative annealing’, i.e. generation of excess absorption. The relative bleaching was obtained following the same method as for the previous samples but, because of the non-monotic behavior of the RIA against Tstop (annealing and generation), indicated percentages are less
significant (possibly greater than 100% when integrated at given wavelength). In what follows, we propose an interpretation which is consistent with almost all the observations reported on the present and previous samples.
Basically, it appears that the TSL-induced thermal annealing can be divided in two phases on both sides of a temperature around 200 °C. Below 200 °C, annealing remarkably correlates with the VIS TSL. Above 200 °C, bleaching has more to do with the NIR TSL plot and the restoration of Yb3+ions. We already analyzed the bleaching map of the S:Yb sample based on a
two-regime interpretation. Such an analysis can be taken up here, the major modification being due to AlOHCs and the stronger CT band of Yb3+ions.
In the low-temperature phase, both electrons and holes are thought to be released from shallow traps. Holes mainly recombine to produce the VIS TSL, but virtually not at Yb2+ions. The
restoration of Yb3+ions is then negligible. The concentration of SiE’ centers and AlOHCs may
be increased by hole retrapping or decreased by electron recombination. Released electrons may also ‘condense’ in deep traps to form new Yb2+ions. The annealing effect apparently prevails for
AlOHCs since the bleaching rate is positive around 539 nm (2.3 eV). It is more difficult to decide whether SiE’ centers are mainly created or removed since their OA band at 216 nm (5.75 eV) is largely masked by the strong and broad CT absorption band of Yb3+ions, which is expected to
reduce. The SiE’ OA band also overlap with the 5.27-eV (235 nm) band attributed to Yb2+ions
(see Fig.5). The high bleaching level observed below 300 nm and 150 °C however indicates that the net OA production by SiE’ (and possibly by Yb2+ ions) is largely exceeded by the loss of
Yb3+CT absorption in this region.
When temperature approaches 200 °C, shallow electron traps get empty. The annealing of AlOHCs (and SiE’ centers) and the production of Yb2+ions slows down while the detrapping
of holes, that mainly serve to restore Yb3+ions, has become dominant (NIR TSL). In addition
to their recombination at Yb2+ions, free holes can also retrap to form new AlOHCs and SiE’
centers. The generation of AlOHCs explains the negative bleaching rate at 539 nm around 200 °C. A negative bleaching, in fact more pronounced (not discernible with this color scale), is also seen it this region below 300 nm. It shows that the restoration of the CT band prevails over the net annealing of the SiE’ and Yb2+absorptions. This balance shifts as the detrapping of holes
from SiE’ centers, i.e. SiE’ annihilation, strengthens. From 225 °C, the bleaching rate becomes positive again and its maximum is reached at ∼275 °C, a temperature that well corresponds to the region where SiE’ centers release their trapped hole and have their annealing peak in the AS and S:Yb samples. Below 300 nm, the bleaching rate becomes negative again around ∼350 °C. Because of its good correlation with the NIR TSL peak at 375 °C, this negative zone can be attributed to the dominant reformation of Yb3+ions and of their CT band. This prevalence is
reinforced by the fact that SiE’ centers have been almost all annealed at this stage (recombination responsible for the 375-°C NIR TSL peak is thus poorly due to holes released from SiE’ centers). In this region, holes are rather emitted from AlOHCs which anneal definitively under this NIR TSL peak (Fig.8(b)). This statement is supported by the fact that AlOHCs were already shown to mainly anneal above 350 °C in the AS sample (Fig.4(d)). According to this correlation, Yb2+
ions are preferably recombined by holes released from AlOHCs. 5.2. The effect of cerium co-doping
The benefit of cerium co-doping for improving the radiation resistance of silicate glasses has been proved for more than 55 years [8,9]. From these first observations, it was proposed that Ce3+ ions (resp. Ce4+) inhibit the formation of trapped-hole (resp. trapped-electron) CCs by
capturing holes (resp. electrons). Since then, this simple idea has remained popular [12,42,44]. Yet the results below lead to envision further important mechanisms brought by Ce.
The addition of Ce has a dramatic impact on the attenuation and RIA properties of the glass (Fig.9). In Yb,Ce-co-doped aluminosilicate glasses, Ce can be present under the form of both Ce3+ and Ce4+ ions [44]. It was however demonstrated recently that the trivalent form
is substantially prevalent (at least 85%) in preforms containing similar concentrations of Al as ours, although these preforms were also made in the oxidizing conditions of MCVD [45]. The pristine attenuation of the AS:Yb,Ce sample of Fig.9(a) presents a strong and broad UV absorption that encompasses CT bands of Yb3+ions, OA bands of Ce3+ions and, probably in a
lesser extent, CT band of Ce4+ ions. 4f-5d OA bands of Ce3+ ions have been reported at 3.9,
4.4, 5, 5.9 and above 6 eV whereas the CT band of Ce4+ions was located at 4.8 eV in Ce-doped
silica [46]. Since the UV absorption is significantly broader than in Ce-free samples, notably below 4 eV, the contribution of Ce3+ions must be important. After irradiation, the attenuation is
increased in the VIS range, but markedly decreased in the UV region. We therefore obtain a quite unusual negative RIA above 3.7 eV. As we did in Fig.7(a), we tried to compare this RIA with the one obtained for the AS:Yb sample in the case of a comparable production of Yb2+
ions. In Fig.9(b), the AS:Yb RIA was renormalized to the same level as the one reached by the AS:Yb,Ce RIA around 3.4 eV (this energy being the center of the main OA band of Yb2+ions,
see Fig.5). This rough qualitative attempt indicates that, for a comparable amount Yb2+, the
production of AlOHC and other VIS-absorbing CCs is heavily dropped. Given that the AlOHC band at 2.3 eV has a significant tail in the NIR region, this is one of the key reasons why Ce provides efficient mitigation of the NIR RIA. Obviously, the negative RIA above 3.7 eV is also due to Ce. If Ce4+ions only represent a small fraction of Ce ions in the glass [45], it most likely
reflects a massive loss of Ce3+ions. The deficit of AlOHCs related to the disappearance of Ce3+
ions is a priori consistent with the standard vision of the role of Ce: trivalent ions may have disappeared by capturing holes, thus competing with AlOHC precursors. In these conditions, the reduction of the Ce3+amount would however imply the production of an equal quantity of Ce4+
ions, or rather of Ce3++ions (Ce3++centers correspond to holes trapped at Ce3+sites [8,47],
so their OA properties differ slightly from those of Ce4+ ions. However, both species have a
strong UV absorption [46]). Then, the negative variation of the UV absorption due to Ce3+
suppression should be roughly balanced by the enhancement of the Ce4+or Ce3++bands (no
strong negative contribution to the RIA), unless the ‘oscillator strength’ is much smaller in the case of CT. Though, that does not seem to be the case according to Fasoli et al. [46]. These authors plotted the OA bands of Ce3+ions from a ‘reduced’ silica and the CT band of Ce4+
ions from an ‘oxidized’ silica, and both show comparable optical intensities. If the trapping of holes at Ce3+ions is proved, it is probably not the only mechanism of Ce3+loss in view of
the largely negative RIA of Fig.9. In what follows, we use the notation Ce3++ to distinguish
radiation-induced Ce4+from native Ce4+ions of the pristine glass.
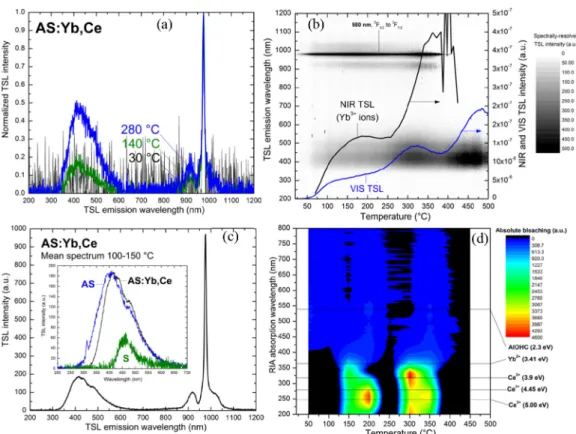
The results of TSL characterization of the AS:Yb,Ce sample are presented in Fig.10(a)-(c). TSL is now emitted in the VIS and NIR ranges with pretty equivalent intensities. The NIR TSL is not strongly affected by Ce: it is again made of the characteristic emission of Yb3+ions
reformed upon recombination with holes (Fig.10(a) or (c)), and the shape of the NIR TSL curve is quite similar to the one observed with the AS:Yb sample (compare Fig.10(b) to Fig.8(a)). It notably exhibits the same main peak around 375 °C. By contrast, the addition of cerium has a huge impact on the VIS TSL. An asymmetric band is restored around 415 nm comprising a significant shoulder at 470 nm (Fig.10(a) or (c)). This VIS TSL curve is unprecedented in shape compared with previously examined samples. It progressively increases, passing two peaks at 325 and 475 °C. In Fig.10(a), intensities of the 976, 920 and 1020 nm emissions remain in the same ratios at 30, 140 and 280 °C as for the S:Yb or AS:Yb samples. This confirms that these ratios only depend on temperature, not on composition. However, the absolute intensity of the
Fig. 9.(a) Attenuation spectrum of the AS:Yb,Ce sample before and after irradiation and
the corresponding RIA spectrum. (b) Comparison between RIA spectra of the AS:Yb,Ce and AS:Yb samples. The latter is renormalized at the same maximum, in the spectral range of the main OA band of Yb2+ions (3.4 eV).
NIR emission is small, about 21 times smaller than the one of AS:Yb at the maximum of the common NIR TSL peak at 375 °C. Since the Yb content of AS:Yb,Ce is only one half that of AS:Yb, this difference is mainly due to the presence of Ce.
A smoother TSL spectrum is obtained by averaging TSL spectra over a given temperature range, as shown in Fig.10(c). The inset of this figure compares the VIS TSL spectrum of AS:Yb,Ce with those of S and AS. What matters is determining whether this emission is due to the restoration of the VIS emission bands from Si- or Al-ODCs (at 470 nm (2.7 eV) and 405 nm (3.1 eV)) respectively, since they were previously shown to be suppressed by the introduction of Yb, or if it relates to Ce3+ions. PL characterizations of Ce-doped MCVD preforms brought
out a Ce3+emission band around 400 nm (3.1 eV) for Al-containing samples [45]. In addition,
XRL measurements conducted on Al-free Ce-doped sol-gel silica glasses revealed a composite Ce3+emission made of two overlapping bands, one around 2.7 eV and the other around 3 eV [46].
Emission mechanisms are expected to be the same in XRL and TSL, and these XRL sub-bands well correspond to those of the VIS TSL of AS:Yb,Ce which are located at 470 nm (2.65 eV) and 415 nm (3.0 eV), see Fig.10(c). However, the shoulder at 470 nm (2.65 eV) was already present in S and AS where it was attributed to the emission of Si-ODCs. Therefore, only the 415-nm component can be unambiguously related to Ce3+ions. The assignment to Ce3+ions, instead of
Al-ODCs, is supported by two further arguments. First, the 415-nm band is slightly different, both in position and width, from the one at 405 nm (3.1 eV) attributed to Al-ODCs (see inset of Fig.10(c)). Second, the presence of the Al-ODC luminescence in the TSL spectrum would imply that AlE’ centers are recombined by holes during thermal annealing and hence that AlE’ were formed under irradiation. However, the strong OA band of AlE’ centers should appear clearly in the RIA spectrum if a significant amount of these centers had been generated by irradiation. The AlE’ OA band peaks at ∼4000 dB m−1in the RIA spectrum of the AS sample (Fig.3), a preform
where the Al content is though 2.6 times lower than that of the present sample. If the OA band of AlE’ centers was present in the RIA spectrum of Fig.9(b), it should at least raise it up around 4 eV, a region where it is yet clearly negative. As a result, the density of AlE’ centers generated in AS:Yb,Ce must be very weak and the recombination process responsible for the VIS TSL rather correlates with the main contributors to the negative RIA, namely Ce3+ions. We therefore
conclude from RIA and TSL results that Ce3+ions are undoubtedly destructed under irradiation
Fig. 10.(a) TSL spectra of the AS:Yb,Ce sample at 30, 140 and 280 °C, (b) TSL contour
plot (grayscale), NIR TSL curve and VIS TSL curve acquired with PMT (right vertical scale) after a 15-min irradiation at 10 kGy(SiO2), (c) TSL spectrum averaged between 100 and 150
°C, inset: detail of the VIS TSL spectrum compared to the ones of the S and AS samples, (d) Bleaching map (lines mark the main centers of some important RIA bands).
The destruction of Ce3+ions can result from their oxidation by hole trapping to form Ce3++
or, alternatively, from their reduction into Ce2+ ions by electron trapping. Whereas the first
destruction route has been largely emphasized from the 60s [8,9,12,42,44], the second one has never been mentioned so far. The reason is probably that Ce2+ions are thought to be unstable
in glasses, their ground level being close to the conduction band [41]. Nevertheless, reduction of trivalent into divalent rare-earth ions increasingly appears to be a rather usual feature under irradiation or pumping: it has already been demonstrated for Yb [6,11,40,42] but also for erbium [21] and thulium [48]. There is no obvious reason to rule out this possibility about cerium, even if a trend cannot serve as proof. Precisely, our RIA and TSL results bring evidence that metastable Ce2+ions are formed under irradiation and play a major role in RIA processes. We
already argued that the loss of Ce3+by the sole formation of Ce3++fails in explaining the strong
negative RIA seen in Fig.9. The analysis of TSL results bring further decisive arguments. First, similarity between the NIR TSL curves of the AS:Yb and AS:Yb samples – which reflects hole detrapping and recombination at Yb2+ions – proves that the addition of Ce does not
have much impact on those trapped-holes states that can be released below 600 °C (Fig.8(a) and 10(b)). Even if the formation of Ce3++ions by hole trapping during irradiation is well proved by
the deficit it induces in other trapped-hole CCs (Fig.9(b)), it therefore appears that hole trapped in the form of Ce3++states are not released below 600 °C. They are apparently too deeply located
Second, the unprecedented VIS TSL curve of the AS:Yb:Ce sample (Fig.10(b)) proves that Ce introduces other specific traps that are not sufficiently deep to remain stable across the TSL readout. Because of the preceding point, and because the VIS TSL curve present different shape and peaks from the NIR one (surely related to hole traps), these traps must be electron traps. Electrons released from these levels recombine to reform Ce3+ions, as demonstrated by the VIS
TSL spectrum (see Fig.10(a),(d) and the discussion above). Recombination necessarily takes place with those holes trapped at Ce3++ions.
Now, the crucial question is to state whether Ce-related trapped-electron states responsible for the VIS TSL curve correspond to radiation-induced Ce3+(electrons trapped at Ce4+ions) or Ce2+
ions (electrons trapped at Ce3+ions). Given that irradiation leads to a large loss of Ce3+ions, the
reduction of native Ce4+into Ce3+ions by electron trapping must be much less efficient than the
destruction of Ce3+. This is by the way consistent with the fact that Ce3+ions are expected to be
much more abundant than Ce4+ions in pristine aluminosilicate glasses, even in MCVD samples
[45]. The minority process during irradiation, namely the creation of Ce3+ ions by electron
trapping at Ce4+ ions, cannot become responsible for the dominant Ce3+restoration process
reflected by the VIS TSL (electron detrapping and recombination at Ce3++ions). In addition,
the ground state of Ce3+ions is much more deeply located in the glass bandgap than that of
Ce2+ions [41]. As for Yb2+ions, the few electron trapped into Ce3+ions are expected to remain
thermally stable during TSL: they most probably anneal upon recombination by free holes. By contrast, electrons trapped into Ce2+ions, which are much more numerous since they participate
in the decrease of Ce3+amount, lie in shallower levels and appear to be obvious candidates for
the sought VIS TSL traps. We therefore come to the original conclusion that metastable Ce2+
ions are formed under irradiation, due to electron trapping. The distribution of the Ce2+levels
below the conduction band is reflected by the VIS TSL curve.
Although the RIA annealing obtained by reading the TSL up to 600 °C finally results in the restoration of Ce3+ions and in the destruction of Ce2+ and Ce3++ions, the process is not
monotonic along the TSL readout. Transient regimes do exist, where Ce3+ions are well reformed
or conversely destructed depending on the quantity of holes released from intrinsic levels, SiE’ centers and AlOHCs. The bleaching map of Fig.10(d) provides an insight into the different phases, in correlation with the TSL curves of Fig.10(b). Here, the contour plot displays the absolute annealing in dB m−1. The RIA being equal to zero when its spectrum crosses the energy
axis, it cannot be used as denominator to obtain the relative bleaching rate. Black zones again represent regions of negative annealing, where the RIA increases (absorbing centers appear). Below 400 nm, the recovery process involves in principle a variety of absorption bands related to cerium ions, but also to Yb2+ions, SiE’ centers, Ce- or Yb-related CT. . . For simplicity we
focus the analysis on the OA bands of Ce3+ions, the primary RIA contributors (the main OA
band of Yb2+ions, at 364 nm is also marked). Below 125 °C, electron release from intrinsic traps
or Ce2+ions dominates: AlOHCs anneal (539 nm band) while Yb2+and Ce3+ions are formed
upon electron retrapping and recombination, respectively. Between 125 °C and 225 °C, intrinsic electron traps get exhausted – as argued for preceding samples – while the release of holes, which follows the NIR TSL curve, goes to a secondary maximum or plateau at 175 °C. Then, the net annealing of AlOHCs, recombined by electrons released from Ce2+, is continued but some Yb2+
ions disappear (recombined by holes) and a net destruction of Ce3+ions is observed: the effect
of hole retrapping (at Ce3+ions) apparently prevails over electron release from Ce2+ions and
recombination at Ce3++ ions. A similar phase starts at 275 °C, at the onset of the main NIR
TSL peak at 375 °C. Here again, the effect of hole retrapping is dominant despite the secondary maximum of the VIS TSL curve (325 °C) which reveals a peak of electron release from Ce2+
ions. As for the AS and AS:Yb samples, hole release from AlOHCs takes place between 300 and 400 °C, thus leading to final annealing of these centers and explaining the NIR TSL peak at 375 °C. Above 375-400 °C, hole traps are exhausted and the peak of electron release from Ce2+at
475 °C is the sole remaining process that ensures the annealing completion. In this phase, Ce3+
ions are just reformed.
6. Summary of mechanisms and first insight into activation energies
In undoped silica (sample S), irradiation-excited holes trap to form SiE’ centers, NBOHCs and a continuous distribution of shallow trapped-holes states. Counterpart electrons trap at oxygen vacancies (a type of oxygen-deficient center, Si-ODC [29]). The annealing process consists in the recombination of thermally-release holes with trapped electrons and is accompanied by the characteristic emission of Si-ODCs.
When aluminum is added to silica (AS sample), AlE’ centers and AlOHC appear next to an enhanced concentration of intrinsic centers (SiE’ centers and NBOHCs). A continuous distribution of holes trapped in shallow states is again found, probably of intrinsic character, together with an even shallower distribution of trapped-electron states. Holes detrapped from shallow intrinsic levels tend to increase the amount of SiE’ centers by retrapping into such deeper states. Electrons released from shallow traps can recombine at AlOHC and SiE’, thus contributing to their low-temperature annihilation. The main annealing process involves detrapping and recombination of free holes with electrons deeply trapped at AlE’ centers and Si-ODCs. Si-ODCs and Al-ODCs are then reformed. Holes are emitted from intrinsic trapped states (from RT to ∼350 °C in the TSL readout, with a peak at 65 °C), from SiE’ centers (around 275 °C) and finally from AlOHC (above 350 °C), see Fig.4(b) and (d).
If ytterbium is added to silica instead of Al (S:Yb sample), irradiation-excited electrons are efficiently captured by Yb3+ ions, thus forming Yb2+ which strongly contribute to the RIA
(Fig.5). The number of electrons trapped at Si-ODCs is thus markedly dropped. Holes still trap to form SiE’ centers and NBOHCs, but related RIA is partly compensated by the decrease of the Yb3+-ion CT absorption. Again, continuous distributions of trapped electrons and holes are
apparently created. Below 100 °C, electrons released from shallow intrinsic traps can recombine with SiE’ centers, but they also condense into deeper Yb2+ states, thus decreasing again the
population of Yb3+ions. Holes released from shallow traps can form deeper SiE’ states, but they
also recombine with electrons captured at Si-ODCs, giving rise to VIS TSL (peak at 72 °C). The annealing of Yb2+(restoration of Yb3+) dominates above 125 °C, due to their recombination
by holes released from SiE’ centers (correlated bleaching and TSL peaks at 225 °C in Fig.6(b) and (d)). Yb2+and SiE’ centers are therefore closely related, as if they were formed as pairs of
trapped electrons and holes.
When both Al and Yb are present in silica (AS:Yb sample), the radiation-induced hole and electron states are the same as in the S:Yb sample. The main difference is the additional creation of AlOHC centers, to the detriment of SiE’ centers and NBOHCs. The production of AlE’ centers by electron trapping is almost totally quenched due to Yb3+ions which capture the huge
majority of electrons to form divalent ions. As for the S:Yb sample, the recombination of the very few electrons deeply trapped in the form of AlE’ centers or at Si-ODCs takes place at low temperature (TSL peak at 75 °C, Fig.8(a)), resulting from the release of holes from shallow traps. Holes recombining with Yb2+are preferably emitted from SiE’ centers (peak at 275 °C in the
bleaching map and plateau of the NIR TSL, Fig.8), and even more from AlOHCs (NIR TSL and recovery peak at 375 °C, as in the AS sample).
Adding finally Ce to the Yb-doped aluminosilicate glass (i.e. considering the AS:Yb,Ce sample) does not change the basic Si-, Al-and Yb-related mechanisms. Ce is just involved in parallel but competing processes. A large part of Ce3+ions, the most abundant in the pristine
glass, are lost during irradiation. They indeed capture both holes and electrons, forming Ce3++
and Ce2+ ions, respectively. More marginally, native Ce4+ ions may reduce into thermally
stable Ce3+ ions by electron trapping. During TSL, electrons trapped into Ce2+ states are


![Fig. 6. (a) TSL spectra of the S:Yb sample at 30, 140 and 280 °C. Inset: comparison of the 30°C spectrum (in black) with the usual emission cross-section of Yb 3+ ions (in red) and the emission of the CT relaxation (in blue) reproduced from [36], (b) NIR T](https://thumb-eu.123doks.com/thumbv2/123doknet/13549515.419316/12.918.183.743.458.866/spectra-comparison-spectrum-emission-section-emission-relaxation-reproduced.webp)
![[PDF] Débuter en PowerPoint cours pdf](data:image/gif;base64,R0lGODlhAQABAIAAAP///wAAACH5BAEAAAAALAAAAAABAAEAAAICRAEAOw==)