HAL Id: halshs-01161599
https://halshs.archives-ouvertes.fr/halshs-01161599
Preprint submitted on 8 Jun 2015
HAL is a multi-disciplinary open access archive for the deposit and dissemination of sci-entific research documents, whether they are pub-lished or not. The documents may come from teaching and research institutions in France or abroad, or from public or private research centers.
L’archive ouverte pluridisciplinaire HAL, est destinée au dépôt et à la diffusion de documents scientifiques de niveau recherche, publiés ou non, émanant des établissements d’enseignement et de recherche français ou étrangers, des laboratoires publics ou privés.
in Developing Countries
Urbain Thierry Yogo
To cite this version:
Urbain Thierry Yogo. Ethnic Diversity and the Efficiency of Public Spending in Developing Countries. 2015. �halshs-01161599�
C E N T R E D'E T U D E S E T D E R E C H E R C H E S S U R L E D E V E L O P P E M E N T I N T E R N A T I O N A L
Ethnic Diversity and the Efficiency of Public Spending in
Developing Countries
Thierry Urbain YOGO
Etudes et Documents n° 13
Juin 2015CERDI
65 BD. F. MITTERRAND
63000 CLERMONT FERRAND – FRANCE TEL.+33473177400
FAX +33473177428 www.cerdi.org
To cite this document:
Yogo T. U. (2015) “Ethnic Diversity and the Efficiency of Public Spending in Developing Countries”,
Etudes et Documents, n° 13, CERDI.
http://cerdi.org/production/show/id/1692/type_production_id/1
2
The authors
Thierry Urbain Yogo
Post-doctoral research fellow and Associate researcher
Clermont Université, Université d'Auvergne, CNRS, UMR 6587, CERDI, F-63009 Clermont Fd CEREG, University of Yaoundé II/Cameroon
Email: [email protected]; [email protected]
Corresponding author: Thierry Urbain Yogo
Etudes et Documents are available online at: http://www.cerdi.org/ed
Director of Publication: Vianney Dequiedt Editor: Catherine Araujo Bonjean
Publisher: Chantal Brige-Ukpong ISSN: 2114 - 7957
Disclaimer:
Etudes et Documents is a working papers series. Working Papers are not refereed, they
constitute research in progress. Responsibility for the contents and opinions expressed in the working papers rests solely with the authors. Comments and suggestions are welcome and should be addressed to the authors.
This work was supported by the LABEX IDGM+ (ANR-10-LABX-14-01) within the program “Investissements d’Avenir” operated by the French National Research Agency (ANR)
3
Abstract
This paper examines the effect of ethnic diversity on the efficiency of public spending in a set of developing countries. For this purpose, we use Data Envelopment Analysis to assess the efficiency of public spending in the sectors of health, education and infrastructure in 77 developing countries over the period 1996-2012. Further, we investigate the effect of ethnic diversity on the cross country variation in efficiency. Two main findings emerge. First, barely 12% of the sample of countries under study makes an efficient use of public expenditure. Second, no matters the level of aggregation, ethnic polarization is positively associated with higher efficiency. In contrast, ethnic fractionalization does have a negative or at the best no effect on efficiency, especially at the finest level of disaggregation.
Key words: Ethnic diversity, Public spending efficiency, Developing countries JEL codes: H5, O11, O23
4
1. Introduction
An extensive literature exists on the relationship between ethnic diversity and the provision of public goods. An important strand of this literature underlines the cost associated with ethnic heterogeneity. Conflict of preferences and lack of coordination may lead to reduced provision of public goods (Alesina and La Ferrara, 2005; Miguel and Gugerty, 2005; Desmet et al, 2012). In contrast, several other studies suggest that ethnic diversity brings about various abilities, experiences, flexibility and know-how that may lead to higher innovation and productivity (McLeod et al, 1996; Alesina et al, 1999; Alesina and La Ferrara, 2005; Egel, 2013). This study adds further to this later literature by investigating the effect of ethnic diversity on the efficiency of public spending.
The literature highlights three important mechanisms that shape the relationship between ethnic diversity and the provision of public goods. The first mechanism points out the diversity in preferences between different ethnic groups. In fact individuals may have a taste for homogeneity and attribute negative utility to the well-being of members of other groups (Alesina et al, 1999). Therefore, they may be less willing to contribute for the provision of public goods since this will benefit other groups. An alternative mechanism hinges on the idea that coordination may be higher in homogeneous group compared to ethnic heterogeneous ones (Miguel and Gugerty, 2005). In ethnically diverse societies, people may be less likely to trust their fellow citizens and less likely to coordinate in order to fund the public good. Finally, since people differ in their cognitive and productive skills that are complement in the production function, ethnic heterogeneity may lead to higher productivity. Although valuable, few studies have tested this latter mechanism at the macro level. This paper builds on the literature of performance measurement to assess the efficiency of public spending and how it relates with ethnic diversity in developing countries.
Our contribution is threefold. First, we use Data Envelopment Analysis to assess the efficiency of public spending in the sectors of health, education and infrastructure in a set of developing countries over the period 1996-2012. The outputs used are respectively infant mortality, years of education and the percentage of paved roads. Second, we relate our measure of efficiency to measures of ethnic diversity. Following Desmet et al (2012), we use both ethno linguistic fractionalization and ethno linguistic polarization at different degree of aggregation. Finally, we take into account the potential endogeneity of ethnic diversity by using historical and geographic variables as exclusion restrictions in a recursive framework1. The paper is organized as follows: Section 2 summarizes the existing literature. In Section 3, we present the data on efficiency and ethnic diversity. Section 4 is about econometric model. In Section 5, we present the results. The last section concludes.
2. Literature Review
Following the seminal paper of Easterly and Levine (1997), the effect of ethnic diversity on economic performance has been extensively studied. Racial and ethnic cleavage is often associated with ethnic conflict, low provision of public goods, low school attainment and bad infrastructure quality among other (Easterly and Levine, 1997; Alesina et al, 2003; Garcia-Montalvo and Reynal-Querol 2005a,b; Desmet et al, 2012). The cost of diversity stems from the conflict of preferences because individuals may attribute positive utility to the well-being
1 Note that the IV approach and the recursive bivariate models are two distinct econometric approaches to tackle
the endogeneity problem. Thus, our model can be viewed as a simple recursive bivariate model where we add more information about the potential predictors of ethnic diversity.
5
of members of their own group and negative utility to that of members of other groups (Alesina and La Ferrara, 2005). The diversity doesn‟t only affect preferences, but also the strategies of individuals. In this line, the literature suggests that when there are market imperfections, individuals prefer to transact with members of their own group since they are more trustworthy (Greif, 1993; La Ferrara, 2003a). This leads to less trade and poor economic performance. Although this literature is widespread, some papers highlight the potential benefits of ethnic diversity (Huntington, 1998; Rauch, 2001; Rauch and Casella, 2003; Alesina and La ferrara, 2005; Egel, 2013). As suggested by Alesina and La ferrara (2005), diverse ethnic mix bring about variety in abilities, experiences and cultures that may lead to innovation and more productivity. Likewise, Page (2014) shows that people with diverse productive and cognitive abilities can find optimal solutions to difficult problems. Therefore, diverse group of people with low abilities can outperform a more homogenous group with high abilities. Similar finding is provided by Nathan (2014). In a recent experimental study, Chakravarti and Fonseca (2014) show that while high fragmentation leads to lower contribution to public goods by members of the majority group, homogenous groups performs as well as fragmented groups.
In the empirical literature, ethnic diversity has been associated with a wide range of outcomes including political instability, investment, fiscal policy, trade openness, market distortion and growth.
Early evidence provided by Easterly and Levine (1997) suggests that more ethnically fragmented countries grow less. They argue, in the specific case of Africa that ethnic diversity is associated with social and political divisions that make impossible the adoption of sound policies. This result has been challenged by Arcand et al (2000) who pointed out that the few number of observations for Africa may cast a doubt on this relationship. Moreover, they argued that the ethno linguistic measure used is not appropriate as it is largely dependent on ethnic group. However, a later paper of Alesina et al (2003) confirmed the previous results using both ethno linguistic and polarization data. Conversely, Alesina and La Ferrara (2005) showed that under reasonable condition on technology, ethnic fractionalization may have a positive effect on output at higher level of development. Likewise, Collier (2000), Easterly (2001) suggest that the negative effect of ethnic fractionalization may be mitigated in democratic regimes.
Ethnic diversity has also been associated with political instability and violence. In this line, Collier (2001) found that ethnic divided societies are more prone to ethnic violence and political instability. Similarly, Garcia-Montalvo and Reynal-Querol (2005a,b) show that ethnic polarization is a significant predictor of civil war. They argue that the lack of correlation between ethnic diversity and conflict found in the previous literature is due to the use of an index of fractionalization rather than an index of polarization. Finally, Desmet et al (2012), using linguistic tree found that deep ethnic cleavage is a powerful predictor of the onset of civil conflict.
Several papers have pointed out the incertitude generated by political instability as one of the main explanation of the low level of investment observed in ethnic diverse societies (Annett, 2001; Garcia-Montalvo and Reynal-Querol, 2005a). This evidence confirms the previous finding of Easterly and Levine (1997). They have shown that ethnically diverse societies may suffer from rent-seeking behavior, implying a non-productive use of inputs and low investment.
The existing empirical literature suggests that ethnic diversity matters for fiscal policy (Easterly and Levine, 1997; Alesina et al, 1999; Alesina et La Ferrara, 2005; Stichnoth and
6
Van der Straeten, 20132). In his seminal paper Easterly and Levine (1997) stressed that public goods provision in ethnic diverse societies may favor only the leading ethnic group. A subsequent work of Alesina et al (1999), using US data showed that productive public goods (education, roads, libraries) are inversely related to city‟s ethnic fragmentation. Therefore, the supply of public goods should be lower in ethnically divided countries. In contrast, Annett (2001) find that ethnic fractionalization is positively related to government consumption. The main explanation of this finding is that the fearing of political instability leads the government which risks being overthrown to use government expenditures to appease the competing groups and mitigate the possibility of ethnic conflict. Furthermore, ethnic fractionalization seems to be negatively correlated with infrastructure quality, literacy, school attainment while it is positively correlated with infant mortality (Alesina et al, 2003; Kuijs, 2000). In an early study, Mueller and Murrell (1986), using a sample of OECD countries, show that public spending is negatively associated with ethnic diversity. Alesina et al (2001), using US data over the period 1960-1998 do not find a significant effect of ethnic diversity on social spending. However, they find a significant negative relationship between racial fractionalization and social spending. The above studies have been criticized on several aspects. One of those aspects is related to the comparison of social spending across countries. In this line, Durlauf (2001) points to the fact that the structure of social spending may vary across countries. Therefore cross country analysis may be misleading. Another issue is related to the measurement of ethnic diversity. Three main concerns are raised in the literature. First, data used in most of the empirical studies date back to 1960s and assume implicitly that ethnic diversity doesn‟t change or change slowly (Chandra, 2001; Posner, 2002). Second, as pointed out by Laitin and Posner (2001), ethnic identity has more than one dimension and could not be restricted to ethno-linguistic groups. Third, some authors point out the relevance of the measure used. For instance, Collier (2001) calls to a clear distinction between ethnic fragmentation and ethnic dominance while Arcand et al (2000) advise to use polarization index rather than fractionalization index. Recent studies analyze the effect of ethnic diversity at the sub national level. Hopkins (2009) suggests that it is not ethnic diversity per se that lead to the reduction of the provision of public goods, but rather sudden changes in ethnic composition of the population. This contrasts with a previous finding according to which the effect of ethnic diversity is positive at the county level and negative at the state level (Cutler et al, 1993).
In order to shed the light on the force behind the aggregated results, several studies have been undertaken at the micro level, focusing on individual behavior. As reported by Stichnoth and Van der Straeten (2013), the mechanism through which ethnic diversity affect social spending is individual‟s preferences. In fact, ethnic diversity may make people less supportive of redistributive policies, implying a decrease of public spending. This operates mainly through two main channels: social capital and attitude towards the welfare states (Stichnoth and Van der Straeten, 2013). Several studies have shown that the level of social capital is lower in more heterogeneous communities (Alesina and La Ferrara, 2000; Alesina and La Ferrara, 2002; Costa and Kahn, 2003). In most recent studies, Hungerman (2008, 2009) use the participation to charity activities as a measure of social capital and find that homogeneous communities tend to be less active compared to the heterogeneous ones. Hungerman (2009) shows that the crowding-out of charitable activities by government spending is only significant in ethnically homogeneous communities. Besides, several papers (Luttmer, 2001; Lind, 2007; Senik et al, 2009) have shown that people tend to be less supportive of welfare
2
Stichnoth and Van der Straeten, 2013 provide an extensive survey on the relationship between ethnic diversity and public spending.
7
spending in ethnically diverse societies. In addition, Miguel and Gugerty(2005) examine the relationship between ethnic diversity and the provision of local public goods in Kenya. Their findings suggest that ethnic diversity is associated with lower primary school funding and worse school facilities, and poor water well maintenance. In contrast, Egel (2013) on a sample of 4000 Yemeni local tribes find that areas with greater tribal heterogeneity receive larger allocation of publicly provided teachers and classrooms. They interpret this finding as evidence of tribes' roles in influencing both political patronage from the state and targeted development transfers from development donors.
To summarize, the relationship between ethnic diversity and the provision of public good remains controversial. Moreover, studies analyzing the potential benefits of ethnic diversity on productivity are scarce, especially at the macro level.
3. Methodology and data measurement
This section describes the methodology and the main data used in this paper.
3. 1. Measuring the efficiency of public spending
Since the pioneer paper of Farrel (1957), various methods have been proposed to assess the efficiency3 of a productive unit. The most used can be classified into parametric and non-parametric approaches (Herrera and Pang, 2005). The non-parametric approach uses econometric tools and imposes specific assumptions, both for the functional form of the relationship between the input and the output, and for the inefficiency term calculated as the deviation of the observed values from the frontier. In contrast, the non-parametric approach uses linear programming techniques to compute an unobserved efficiency frontier for each productive unit. Alongside with this bourgeoning literature, Wagstaff and Wang (2011) proposed a hybrid method which make use of both underlined approaches.
In this paper, we use a non-parametric method, specifically the Data Envelopment Analysis (DEA) to assess the efficiency of public spending.
We measure the input oriented technical efficiency of three types of public spending: education, health and infrastructure, on the sample of 77 countries over the period 1996-2012. This choice is only dictated by data availability and the necessity to keep a relative stable sample since the DEA method is very sensitive to changes in the sample size. We use a single input-single output approach. The input oriented analysis is chosen because unlike output, input choice is under the control of policy makers. As inputs, the respective public spending on health, education and infrastructure are used. It is worth mentioning that public spending are orthogonalized prior use in the dynamic programing. Specifically, public spending are purged from the potential effect of GDP since richer countries may have higher public spending. Data on public spending are drawn the World Bank-World Development Indicator (2012). We use gross fixed capital formation as a proxy of spending on infrastructure. The outputs used are respectively infant mortality, years of education and the percentage of paved roads. Years of education are taken from the Barro and Lee (2014) database on education attainment while infant mortality and the percentage of paved road are from the World Development Indicators (2012). The choice of infant mortality is justified by the fact it is one
3 It is worth noting that we focus mainly on the technical efficiency in this paper. This is when a productive
agent use more inputs than technically required to obtain a given level of output. The second type of efficiency (Allocative) is more difficult to assess since it requires comparable input prices across countries (Herrera and Pang, 2005).
8
of the key target in the health sector, according to the Millennium Development Goals (MDGs). The number of years of education is chosen since it is the result or an outcome of all the other indicators such as school enrolment rate and completion rate. Finally, since we want to assess the quality of infrastructure, we use the number of paved roads in percentage of the total road network.
Figure 1 displays the distribution of efficiency score in the health sector across regions. The figure suggests that the most efficient region is Sub-Saharan Africa while the least efficient one is Latin America and Caribbean. The good performance of Africa may find an explanation in recent efforts made by government, together with donors in order to improve the quality of the management of public expenditures in the health sector. This includes matching public services with citizens „preferences, ensuring equity and efficiency in service provision, and finally more accountability (World Bank, 2005).
Figure 1: Cross-region distribution of efficiency of public spending on health
Source: Author‟s calculation based on data from WDI(2012), World Bank
Figure 2 presents the distribution of the efficiency scores in the education sector. According to this figure, the best performer is Europe and Central Asia while the poor performer is South Asia. Finally, Figure 3 portrays the distribution of efficiency scores in the sector of infrastructure. The figure illustrates that the efficiency of public spending in infrastructure is higher in Europe and Central Asia, while it is lower in East Asia and Pacific.
0 .2 .4 .6 .8 Ef fi ci e n cy sc o re -D EA East As ia & Paci fic Euro pe & Cen tral As ia Latin Am erica & C aribb ean Midd le Ea st & Nort h Af rica Sout h As ia Sub-S ahara n Af rica
9
Figure 2: Cross-region distribution of efficiency of public spending on education
Source: Author‟s calculation based on data from WDI(2012), World Bank
Figure 3: Cross-region distribution of efficiency of public spending on infrastructure
Source: Author‟s calculation based on data from WDI(2012), World Bank
0 .2 .4 .6 .8 Ef fi ci e n cy sc o re -D EA East As ia & Paci fic Euro pe & Cen tral As ia Latin Am erica & C aribb ean Midd le Ea st & Nort h Af rica Sout h As ia Sub-S ahara n Af rica 0 .2 .4 .6 .8 Ef fi ci e n cy Sc o re -D EA East As ia & Paci fic Euro pe & Cen tral As ia Latin Am erica & C aribb ean Midd le Ea st & Nort h Af rica Sout h As ia Sub-S ahara n Af rica
10
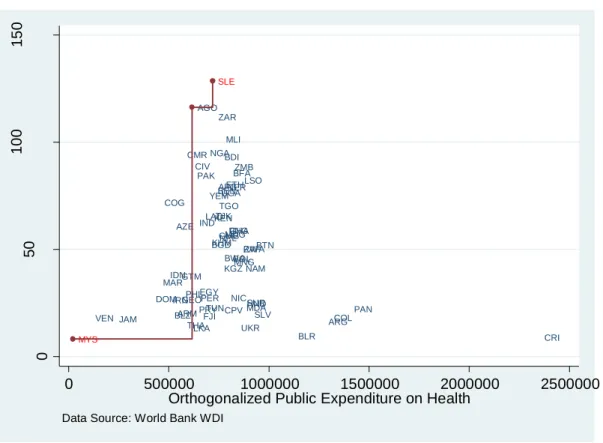
Figures 4, 5 & 6 provide a more detailed view as they look at the specific situation of country. Figure 4 shows the DEA estimation of the efficiency frontier for health spending. Countries with higher health expenditure per capita seem to be less efficient. In other word they spend more to reach the same level of output (infant mortality) as companion countries. This is the case for Costa Rica and Argentina. The two best performers in the sector are Malaysia and Sierra Leone. 4
Figure 4: Correlation of public expenditure on health and infant mortality
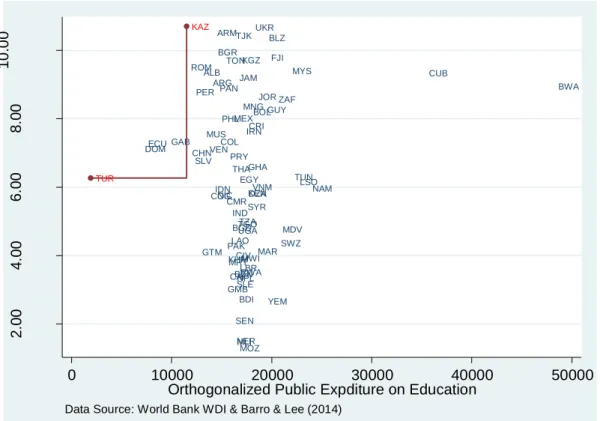
In the sector of education, Figure 5 illustrates the fact that the most inefficient countries are African countries, especially Lesotho and Namibia. The most efficient are Kazakhstan and Turkey. Finally in the infrastructure sector (Figure 6), five countries are top performers, namely Jordan, Mexico, South Africa, Turkey and Ukraine.
4 These countries are in red in the figures.
AFG AGO ARG ARM AZE BDI BEN BFA BGD BLR BLZ BOL BTN BWA CIV CMR COG CPV CRI DOM EGY ETH FJI GEO GHA GMB GTM HND IDN IRN JAM KEN KGZ KHM LAO LKA LSO MAR MDA MDG MLI MNG MYS NAM NER NGA NIC NPL PAK PAN PER PNG PRY RWA SLE SLV SUR TGO THA TJK TUN UGA UKR VEN YEM ZAF ZAR ZMB COL IND PHL 0 50 1 0 0 1 5 0 In fa n t mo rt a lit y 0 500000 1000000 1500000 2000000 2500000 Orthogonalized Public Expenditure on Health
11
Figure 5: Correlation of public expenditure on education and years of education
Figure 6: Correlation of public expenditure on infrastructure and % of paved roads
ALB ARG ARM BDI BEN BGD BGR BLZ BOL BWA CAF CHN CIV CMR COG COL CRI CUB DOM DZA ECU EGY FJI GAB GHA GMB GTM GUY IDN IND IRN JAM JOR KEN KGZ KHM LAO LBR LSO MAR MDV MEX MLI MNG MOZ MRT MUS MWI MYS NAM NER NIC NPL PAK PAN PER PHL PRY ROM RWA SEN SLE SLV SWZ SYR TGO THA TJK TON TUN TZA UGA UKR VEN VNM YEM ZAF KAZ TUR 2 .0 0 4 .0 0 6 .0 0 8 .0 0 1 0 .0 0 Ye a rs o f e d u ca ti o n 0 10000 20000 30000 40000 50000
Orthogonalized Public Expditure on Education
Data Source: World Bank WDI & Barro & Lee (2014)
AGO AZE BEN BFA BGD BGR BLR BLZ BOL BRA BTN CHN CIV COG CRI DMA DZA EGY ETH GEO GHA GMB GRD GTM IDN IND IRN JAM JOR KAZ KEN KGZ KHM LAO LKA LSO MAR MDA MDG MEX MKD MLI MNG MYS NAM NER NGA NIC NPL PAK PAN PER PHL PRY SLV SUR SYR TGO TUN TUR UGA UKR VCT VEN ZAF ZAR ZMB BRA IND JOR MEX PHL TUR UKR ZAF 0 20 40 60 80 1 0 0 Pa ve d ro a d % o f th e t o ta l ro a d n e tw o rk 0 500 1000 1500 2000
Orthogonalized Gross fixed capital formation
12
2. Measuring ethno linguistic diversity
Data on ethno linguistic diversity are drawn from Desmet, Ortuño-Ortín and Wacziarg (2012). This database is the most comprehensive and the most recent one5. These authors use the language tree approach to generate the measure of linguistic diversity at different level of aggregation. The language tree describes the linguistic differentiation that occurred from the major language family.
Two measures are considered: the polarization measure and the fractionalization measure. The index of ethno linguistic fractionalization is computed as the probability that two randomly picked individual belong to different groups. The measure is maximized when each individual belongs to a different group (Desmet, Ortuño-Ortín and Wacziarg, 2012). The polarization index measures to what extent the distribution of ethnic groups is bipolar (Montalvo and Reynal-Querol, 2005). These measures are computed for the 15 levels of aggregation available in the linguistic classification in 15th edition of Ethnologue (Desmet, Ortuño-Ortín and Wacziarg, 2012).
In this paper our measure of ethnic diversity is the index of ethno linguistic fractionalization. This choice is based on the fact that this measure is extensively used in the literature (see Alesina et al, 1999; Alesina et al, 2003; Alesina and La Ferrara, 2005). Moreover, as shown by Desmet, Ortuño-Ortín and Wacziarg (2012), what matters most is the level of aggregation and not whether one measures diversity using languages, ethnicities or religions6.
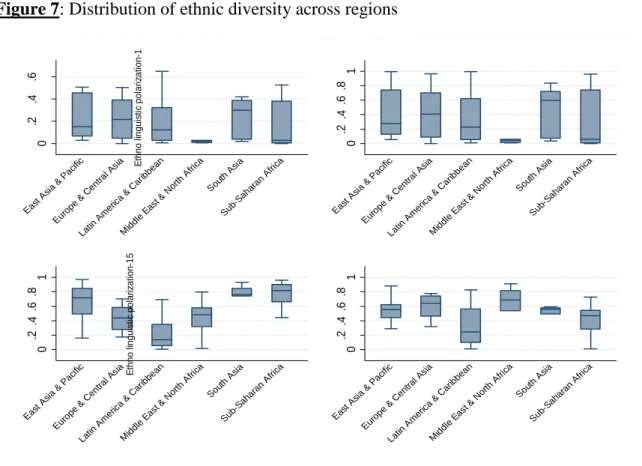
Figure 7 illustrates the distribution of ethnic diversity across regions. The figure shows that at the highest level of aggregation, the East Asia and Pacific region seems to be the more ethnic diverse one. However, at the highest level of disaggregation, Sub-Saharan Africa is the most diverse region. It is worth mentioning that the comparison is more relevant as the level of disaggregation increases. In fact the probability that two peoples chosen randomly belong to different groups increases with the level of disaggregation.
5 Desmet, Ortuño-Ortín and Wacziarg (2012) provides an extensive discussion concerning the correlation
between this measure of ethnic diversity and the ones provided in the literature including Easterly and Levine (1997), Alesina et al (2003).
13
Figure 7: Distribution of ethnic diversity across regions
Source: Author‟s calculation based on Desmet et al (2012)
3. Econometric model
The relationship between ethnic diversity and the efficiency of public spending is examined using a censored (Tobit) regression because the input efficiency score is a continuous variable distributed over a 0-1 interval. Our main empirical specification is as follows:
i i i i Ethnic X ef* ' (1) * i
ef is the latent variable of our outcome measure (efficiency of education spending, efficiency of spending on infrastructure, efficiency of health spending) for country i ; Ethnic is the
measure of ethnic diversity (alternatively ethnic fractionalization and ethnic polarization), and X is a vector of control variables which include the logarithm of urban population in percentage of total population, the logarithm of GDP per capita, tax revenues in percentage of GDP, the logarithm of total percentage of educated people (primary and secondary education), the initial level of inequality, geographic factors (latitude and longitude), initial level of corruption, governance effectiveness and democracy index. In addition, we control for heterogeneity across region by including regional fixed effects. We expect a positive sign on the variable of urban population since the clustering of agent in urban area compared to rural ones make cheaper the provision of public goods (Herrera and Pang, 2005). The logarithm of GDP per capita controls for the income effect. In fact richer countries may be less efficient given the higher level of wage in these countries. But they are also likely to be well organized and therefore more efficient. Education is include into the model because high skilled people are more able to capitalize new efficient organization practices and are more likely to put strong emphasis on social expenditure (Kuijs, 2000). Tax revenues control for the fact that public spending is constrained by the availability of public resources (Kuijs, 2000).
0 .2 .4 .6 E th n o l in g u is ti c f ra cti o n a liz a ti o n -1 Eas t Asi a & Pac ific Eur ope & Cen tral A sia Latin Am eric a & C arib bean Mid dle E ast & Nor th A frica Sou th A sia Sub -Sah aran Afri ca 0 .2 .4 .6 .8 1 E th n o l in g u is ti c p o la ri za ti o n -1 Eas t Asi a & Pac ific Eur ope & Cen tral A sia Latin Am eric a & C arib bean Mid dle E ast & Nor th A frica Sou th A sia Sub -Sah aran Afri ca 0 .2 .4 .6 .8 1 E th n o l in g u is ti c f ra cti o n a liz a ti o n -1 5 Eas t Asi a & Pac ific Eur ope & Cen tral A sia Latin Am eric a & C arib bean Mid dle E ast & Nor th A frica Sou th A sia Sub -Sah aran Afri ca 0 .2 .4 .6 .8 1 E th n o l in g u is ti c p o la ri za ti o n -1 5 Eas t Asi a & Pac ific Eur ope & Cen tral A sia Latin Am eric a & C arib bean Mid dle E ast & Nor th A frica Sou th A sia Sub -Sah aran Afri ca
14
Higher income is expected to negatively impact efficiency while better quality of institution raises the level of technic efficiency.
The link between the latent variable and the actual observed variable is such that:
( ) {
(2) Where are the censoring thresholds. Although the literature argues that ethnic diversity is a highly time persistent variable that is likely to be largely historical determined well before the dependent, the possibility of reverse causality cannot be totally ruled out (Alesina et al, 2003; Desmet et al, 2012). In order to address this issue, we propose a two stage modelling approach where in the first stage, ethnic diversity is regressed on a set of historical potential determinants and controls. The model looks as follows:
1 1 Ethnic (3) 2 2 * ) ( g ef ef (4) Where ' 1 ' 1 X X and ' 2 X . Note that (1,2) (0,), [ ], is the degree of correlation between the error terms of equation (3) & (4), and measure the endogeneity of ethnic diversity in the reduced form equation (1). The main advantage of this approach is that it does assume neither exogeneity nor the endogeneity of ethnic diversity. These assumptions are explicitly tested in the model. Specifically, in specifications, a significant arthro suggests that ethnic diversity were actually not exogenous.
is a set of exclusion restrictions including terrain ruggedness index and distance in kilometers to slave markets respectively for Atlantic trade, Indian trade and Saharan trade. While the exogeneity of ethnic diversity has often been taken as granted in the literature, recent papers have shown that it might rather been driven by historical and geographical factors (Michalopoulos, 2012; Alesina et al, 2011; Ahlerup and Olsson, 2012). Ahlerup and Olsson (2012) show that ethnic diversity is higher in countries with a longer uninterrupted duration of human settlement, which lie closer to equator and have a natural fragmented geography. A potential explanation of this correlates is that the ethnic fragmentation process takes time and will therefore have come further in countries with a longer history of human settlement. Moreover, fragmented geography reduces people mobility and allows ethnic identity to form over time. It is also worth mentioning that a fragmented geography could also help keeping more homogenous ethnic groups since less interaction implies that peoples for very different origins are less likely to be pooled in the same area. This later argument explains why artificial states measures are positively correlated with ethnic diversity (Alesina et al, 2011). In addition, Michalopoulos (2012) models ethnic diversity as a consequence of geographic characteristics of countries and regions. His findings suggest that geographic variability captured by variability in land quality and elevation, is a fundamental determinant of contemporary linguistic diversity. He argues that differences in land endowments gave rise to location-specific human capital, leading to the formation of localized ethnicities. We take advantage of this rich literature by using historical and geographical facts as potential exogenous sources of ethnic diversity in a set of developing countries. Our first exclusion restriction (terrain ruggedness) captures small scale terrain irregularities and is drawn from Nunn and Puga (2012). Rugged terrains have both direct geographical effects and indirect
15
historical effects. The direct effect follows the argument of Michalopoulos (2012) and suggests that building costs and transportation costs associated with irregular terrain lead to higher ethnic diversity. Conversely, rugged terrain is expected to have lower ethnic diversity by having protected these areas from negative long term consequences of slave trade and colonization. Therefore, ethnicities living in rugged area are expected to have been less affected by slave trade and to have been able to keep a relative homogeneity. The three remaining exclusion restrictions (distance in kilometer to slave markets, respectively for Altantic, Indian and Saharan trade) reflect the fact that the most countries have been affected by historical events such as slave trade (ethnicities located close to slave markets), the more diverse they are today.
4. Results
This section reports the main results of the estimation of the effects of ethnic diversity on public spending efficiency in selected developing countries. In each table, we report the results for both fractionalization and polarization measures. We also report the estimates respectively at the highest level of aggregation (ELF1 & POL1) and at the finest level of disaggregation (ELF15 & POL15).
Table 1 reports the estimates of the effect of ethnic diversity on the efficiency of public spending on health. The first two columns present the results for fractionalization measure while the last two other are about ethnic polarization. The first-step exclusion restrictions are presented at the bottom of the table, alongside with the arthrho which measure the level of the correlation between the errors terms of the two equations. The Chi2 test suggests that our exclusion restrictions are jointly statistically significant at the 1% level. However, as shown by the significance of arthrho, the issue of endogeneity is of concern in three out of four specifications.
Turning to the results, at the highest level of aggregation, we find a positive and significant effect of fractionalization on the efficiency of public health spending. However, at the finest level of disaggregation, this effect is no longer significant. This result suggests that less ethno linguistic diversity favor more efficiency in the health sector. This result is somewhat in line with the literature showing that the provision of public goods is lower in ethnically diverse countries (Laporta et al, 1999; Miguel and Gugerty, 2005)7.
When we make use of the polarization measure, we find that at both level of aggregation, the effect of ethnic diversity is positive and significant8. A possible explanation of this result is that in polarized societies, people are more likely to coordinate and define a type of turnover rule to benefit from public good. Besides, the results suggest that the efficiency is negatively associated to corruption and inequality while it is positively related with the size of urban population.
The relationship between ethnic diversity and the efficiency of public spending in education depends upon the measure (Polarization or fractionalization) and the level of disaggregation.
7 It is difficult to accurately compare our findings with those of the literature because to the best of our
knowledge, the output is not measured the same way. Most of the paper use infrastructure quality index, school attainment, infant mortality as measure of public goods (see Desmet et al, 2012).
16
Table 1:Effect of ethnic diversity on the efficiency of public spending on health
Ethnolinguistic Fractionalization Ethnolinguistic Polarization
Dependent Variable Efficiency score-DEA Efficiency score-DEA Efficiency score-DEA Efficiency score-DEA
ELF1/POL1 0.340*** 0.221***
(0.108) (0.0681)
ELF15/POL15 0.0791 0.226***
(0.110) (0.0841)
Log(Urban Population % total) 0.132** 0.0686 0.137** 0.0790
(0.0642) (0.0653) (0.0652) (0.0652)
Log(GDP Per capita) -0.0426 -0.0119 -0.0525 -0.0273
(0.0487) (0.0461) (0.0499) (0.0501)
Tax revenue in % of GDP 0.00145 -0.000866 0.00267 -0.000872
(0.00397) (0.00380) (0.00412) (0.00404)
Log(total % educated people) -0.0517 -0.0837 -0.0482 -0.0782
(0.0668) (0.0639) (0.0678) (0.0686)
Initial Inequality-Gini index -0.340 -0.239 -0.366* -0.292
(0.212) (0.206) (0.216) (0.219)
Latitude 0.00180 0.000898 0.00190 0.00241
(0.00244) (0.00234) (0.00247) (0.00258)
Longitude -0.00182 -0.000803 -0.00209 0.000113
(0.00169) (0.00162) (0.00173) (0.00174)
Initial level of corruption-ICRG -0.0481* -0.0395 -0.0495* -0.0326
(0.0252) (0.0242) (0.0256) (0.0263)
Region dummies Yes Yes Yes Yes
First step-exclusion restrictions
Terrain ruggedness index, 100m 0.0646* -0.127 0.121* 0.0510*
(0.0367) (0.0882) (0.0664) (0.0280)
17
(0.0413) (0.0874) (0.0754) (0.0352)
Distance from slave market-indian -0.107*** -0.212*** -0.188*** -0.223***
(0.0353) (0.0756) (0.0639) (0.0348)
Distance from slave market-Saharian -0.550** -0.853* -0.808* -0.656***
(0.264) (0.463) (0.479) (0.205) Constant 1.088*** 1.004*** 1.170*** 0.916** (0.390) (0.375) (0.398) (0.406) Observations 49 49 49 49 Log Likelihood 58.44 47.80 44.61 62.98 arthrho -1.187*** -0.0352 -1.196*** -1.768***
Prob>Chi2 (joint test of exclusion Restri) 0.0045 0.000 0.0130 0.000
18
Table 2 shows that the lower is the level of fractionalization, the higher is the efficiency in education. Specifically, one observes that at the finest level of disaggregation, ethnic fractionalization negatively affect the efficiency of education spending. In contrast, the effect of ethnic polarization on efficient is positive and significant no matter the level of aggregation. In addition, the Table 3 shows that the efficiency of education spending is positively correlated with the size of urban population, the level of governance, whereas it is negatively affected by corruption. Besides in all specifications, the null hypothesis of the correlation between the errors terms of two equations of the model is not rejected.
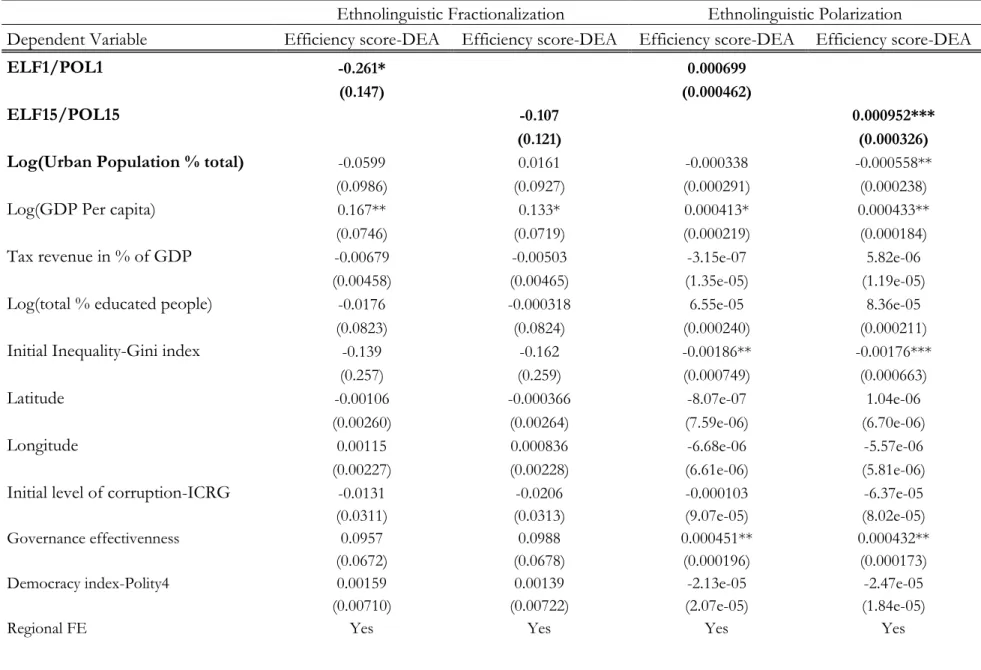
Finally Table 3 reports the estimates of the effect of ethnic diversity on the efficiency of public spending in the sector of infrastructure. The effect of ethnic diversity is negative and significant at the lowest level of fractionalization. This effect loses its significance as the level of disaggregation increases. As regard to the polarization measure, the impact of ethnic diversity is only significant at the highest level of polarization. However, the magnitude of the effect is very small. Concerning the control variables, the efficiency of spending in infrastructure is positively correlated with the level of development and governance, while it is negatively associated with inequality.
Overall, the empirical analysis point out to three main results. First, no matter the level of aggregation, ethnic polarization is positively associated with the efficiency of public spending. Second, the effect of ethnic fractionalization depends on the level of aggregation. Finally, the efficiency of public spending is mainly affected by the size of urban population and governance either measured by governance effectiveness or corruption.
19
Table 2: Effect of ethnic diversity on the efficiency of public spending on education
Ethnolinguistic Fractionalization Ethnolinguistic Polarization
Dependent Variable Efficiency score-DEA Efficiency score-DEA Efficiency score-DEA Efficiency score-DEA
ELF1/POL1 0.382*** 0.236***
(0.0929) (0.0527)
ELF15/POL15 -0.174** 0.253***
(0.0719) (0.0786)
Log(Urban Population % total) 0.150*** 0.173*** 0.155*** 0.102**
(0.0504) (0.0508) (0.0518) (0.0468)
Log(GDP Per capita) -0.0574 -0.0205 -0.0687* -0.0235
(0.0398) (0.0376) (0.0412) (0.0354)
Tax revenue in % of GDP 0.00471* -0.00148 0.00522* 0.00111
(0.00271) (0.00268) (0.00279) (0.00232)
Log(total % educated people) 0.0675 0.00233 0.0722 0.0365
(0.0556) (0.0518) (0.0569) (0.0494)
Initial Inequality-Gini index -0.0818 0.113 -0.0926 -0.00742
(0.149) (0.143) (0.153) (0.133)
Latitude 0.00463*** 0.00224 0.00456*** 0.00453***
(0.00157) (0.00152) (0.00160) (0.00146)
Longitude 0.00337*** 0.00438*** 0.00307** 0.00486***
(0.00127) (0.00119) (0.00131) (0.00111)
Initial level of corruption-ICRG -0.0358* -0.0252 -0.0362* -0.00581
(0.0205) (0.0195) (0.0210) (0.0191)
Governance effectivenness 0.0752** 0.0547 0.0793** 0.0672**
(0.0371) (0.0362) (0.0381) (0.0336)
Democracy index-Polity4 0.00142 0.00299 0.00136 0.000669
(0.00395) (0.00388) (0.00405) (0.00359)
20 First step-exclusion restrictions
Terrain ruggedness index, 100m -0.0415 -0.0768 -0.0596 -0.0947**
(0.0329) (0.0546) (0.0542) (0.0440)
Distance from slave market-Atlantic -0.0808** -0.0591 -0.124** -0.128***
(0.0379) (0.0617) (0.0628) (0.0444)
Distance from slave market-indian -0.0763** -0.0780 -0.123** -0.167***
(0.0320) (0.0660) (0.0540) (0.0500)
Distance from slave market-Saharian 0.256 -0.830*** 0.538 -0.0459
(0.216) (0.306) (0.355) (0.308) Constant -0.353 -0.558* -0.256 -0.710** (0.324) (0.308) (0.335) (0.294) Observations 53 53 53 53 Log Lik 80.26 75.19 66.91 81.53 arthrho -1.818*** 1.668*** -1.903*** -1.497***
Prob>Chi2 (joint test of exclusion
Restri) 0.05 0.06 0.1202 0.0079
21
Table 3: Effect of ethnic diversity on the efficiency of public spending on Infrastructure
Ethnolinguistic Fractionalization Ethnolinguistic Polarization
Dependent Variable Efficiency score-DEA Efficiency score-DEA Efficiency score-DEA Efficiency score-DEA
ELF1/POL1 -0.261* 0.000699
(0.147) (0.000462)
ELF15/POL15 -0.107 0.000952***
(0.121) (0.000326)
Log(Urban Population % total) -0.0599 0.0161 -0.000338 -0.000558**
(0.0986) (0.0927) (0.000291) (0.000238)
Log(GDP Per capita) 0.167** 0.133* 0.000413* 0.000433**
(0.0746) (0.0719) (0.000219) (0.000184)
Tax revenue in % of GDP -0.00679 -0.00503 -3.15e-07 5.82e-06
(0.00458) (0.00465) (1.35e-05) (1.19e-05)
Log(total % educated people) -0.0176 -0.000318 6.55e-05 8.36e-05
(0.0823) (0.0824) (0.000240) (0.000211)
Initial Inequality-Gini index -0.139 -0.162 -0.00186** -0.00176***
(0.257) (0.259) (0.000749) (0.000663)
Latitude -0.00106 -0.000366 -8.07e-07 1.04e-06
(0.00260) (0.00264) (7.59e-06) (6.70e-06)
Longitude 0.00115 0.000836 -6.68e-06 -5.57e-06
(0.00227) (0.00228) (6.61e-06) (5.81e-06)
Initial level of corruption-ICRG -0.0131 -0.0206 -0.000103 -6.37e-05
(0.0311) (0.0313) (9.07e-05) (8.02e-05)
Governance effectivenness 0.0957 0.0988 0.000451** 0.000432**
(0.0672) (0.0678) (0.000196) (0.000173)
Democracy index-Polity4 0.00159 0.00139 -2.13e-05 -2.47e-05
(0.00710) (0.00722) (2.07e-05) (1.84e-05)
22 First step-exclusion restrictions
Terrain ruggedness index, 100m -0.148*** -0.212*** -0.187*** -0.0840**
(0.0461) (0.0380) (0.0398) (0.0384)
Distance from slave market-Atlantic -0.234*** -0.110*** -0.193*** 0.00654
(0.0536) (0.0340) (0.0527) (0.0424)
Distance from slave market-indian -0.167*** -0.174*** -0.165*** -0.0424
(0.0529) (0.0352) (0.0454) (0.0423)
Distance from slave market-Saharian -0.300 1.282*** -0.284 0.650**
(0.257) (0.231) (0.194) (0.253) Constant -0.769 -0.750 0.766*** 0.780*** (0.568) (0.577) (0.00166) (0.00147) Observations 46 46 46 46 Log Lik 52.48 56.68 326.4 330.3 arthrho 0.427 -0.375 -1.879*** -1.759***
Prob>Chi2 (joint test of exclusion
Restri) 0.000 0.000 0.000 0.000
23
5. Conclusion
This paper has uncovered new evidences on the relationship between ethnic diversity and the provision of public goods in developing countries. While the existing literature focuses on output of public goods such as infant mortality, infrastructure quality and school attainment, we put a strong emphasis on the efficiency of the related spending. Specifically, we investigate the effect of ethnic diversity on the ability of a government to reach a desirable output at the lowest cost.
For this purpose, input efficiency is scored in a sample of 77 countries using data from 1996 to 2012. Further, we investigate the effect of ethnic diversity on cross country variation in efficiency. Two main findings are drawn from this study. First, barely 12% of the sample of countries under study makes an efficient use of public expenditure. That means there still a room for governments to achieve social improvements at low cost. Second, results show that the effect of ethnic diversity on the efficiency depends mainly on the measure used, the level of aggregation and the nature of the expenditure. Specifically, no matters the level of aggregation, ethnic polarization is positively associated with higher efficiency. In contrast, ethnic fractionalization does have a negative or at the best no effect on efficiency, especially at the finest level of disaggregation.
Those findings add to the existing literature by highlighting the fact that even in ethnic diverse countries, while diversity in preferences and lack of coordination may reduce the provision of public goods, there is still a room of improvement in the management of public spending.
24
References
Ahlerup, P. and Olsson, O. (2012), “The Roots of Ethnic Diversity”. Journal of Economic
Growth, 17, 71-102.
Alesina, Alberto, and La Ferrara Eliana (2005), “Ethnic Diversity and Economic Performance” Journal of Economic Literature, 43: 762–800.
Alesina, Alberto, Arnaud Devleeschauwer, William Easterly, Sergio Kurlat, and Romain Wacziarg. (2003). “Fractionalization. ” Journal of Economic Growth, 8(2): 155–94.
Alesina, A., E. Glaeser, and B. Sacerdote (2001), “ Why doesn‟t the U. S. have a European style welfare system?”, Brookings Papers on Economic Activity 2: 187–278.
Alesina, A., Baqir, R., Easterly, W. (1999), “ Public goods and ethnic divisions”, Quarterly
Journal of Economics, 114:1243–1284.
Annett, A. (2001), “Social fractionalization, political instability, and the size of government”.
IMF Staff Papers,48(3): 561–592
Arcand, Jean-Louis, Patrick Guillaumont, and Sylviane Guillaumont Jeanneney. (2000), “How to Make a Tragedy: On the Alleged Effect of Ethnicity on Growth. ” Journal of
International Development, 12(7): 925–38.
Banerjee, A., Somanathan, R. (2007) “ The political economy of public goods: some evidence
from India”, Journal of Development Economics 82:287–314.
Chandra, K. (2001), “Cumulative findings in the study of ethnic politics”, apsa-cp (Newsletter of the Organized Section in Comparative Politics of the American Political Science
Association) 12(1), 7–11.
Costa, D. L. and Kahn, M. E. (2003), “Understanding the American decline in social capital”, 1952–1998. Kyklos 56: 17–46.
Collier, Paul. (2001), “Implications of Ethnic Diversity. ”, Economic Policy, 32(16): 127–66. Collier, Paul. (2000). “Ethnicity, Politics, and Economic Performance. ” Economics and
Politics, 12(3): 225–45
Cutler, D. M., Elmendorf, D. W. and Zeckhauser, R. (1993), “Demographic characteristics and the public bundle”, Public Finance 48: 178–198.
Desmet, K. ; I. Ortuño-Ortín and Wacziarg, R. (2012), “The Political Economy of Linguistic Cleavage”, Journal of Development Economics, 97:322-338
Durlauf, S. N. (2001). [Why doesn‟t the United States have a European-style welfare state?]. Comments and discussion. Brookings Papers on Economic Activity, 255–277.
Easterly, William. (2001), “Can Institutions Resolve Ethnic Conflict?” Economic
Development and Cultural Change, 49(4): 687–706.
Easterly, William, and Ross Levine (1997) “Africa‟s Growth Tragedy: Policies and Ethnic
25
Egel, D. (2013), “Tribal heterogeneity and the allocation of publicly provided goods: Evidence from Yemen”, Journal of Development Economics, 101:228-232
Farrell, M. (1957), “The measurement of productive efficiency”, Journal of the Royal Statistical Society, Series A. Vol. 120, No. 3, pp. 253-290
Greif, Avner. (1993). “Contract Enforceability and Economic Institutions in Early Trade: the Maghribi Traders‟ Coalition. ” American Economic Review, 83(3): 525–48.
Herrera, S. and Pang, G. (2005), “Efficiency of Public Spending in Developing Countries: An Efficiency Frontier Approach”, Unpublished paper
Kuijs, L. (2000), “The impact of ethnic heterogeneity on the quantity and quality of public spending”, Working Paper 00/49, International Monetary Fund, Washington, DC.
La Ferrara, Eliana. (2003a), “Kin Groups and Reciprocity: A Model of Credit Transactions in Ghana. ” American Economic Review, 93(5): 1730–51.
Laitin, D. and D. Posner (2001), “The implications of constructivism for constructing ethnic fractionalization indices”, apsa-cp (Newsletter of the Organized Section in Comparative Politics of the American Political Science Association) 12(1), 13–17. Lind, J. T. (2007), “Fractionalization and the size of government”, Journal of Public
Economics 91: 51–76.
Luttmer, E. F. P. (2001) Group loyalty and the taste for redistribution. Journal of Political
Economy 109(3):
500–528.
Hungerman, D. M. (2009) Crowd-out and diversity. Journal of Public Economics 93: 729– 740.
Hungerman, D. M. (2008), “Race and charitable church activity”, Economic Inquiry 46: 380– 400.
Hopkins, D. J. (2009), “The diversity discount: when increasing ethnic and racial diversity prevents tax increases”, The Journal of Politics 71(1): 160–177.
Huntington, Samuel P. (1998), “The Clash of Civilizations and the Remaking of the World Order”. New York: Simon and Schuster.
McLeod, P. L., Lobel, S. A. and Cox, T. H. JR. (1996), “Ethnic Diversity and Creativity in Small Groups”, Small Group Research, 28:248-264
Michalopoulos, Stelios. (2012). "The Origins of Ethnolinguistic Diversity. " American
Economic Review, 102(4): 1508-39.
Miguel, E., Gugerty, M. K., (2005), “Ethnic diversity, social sanctions, and public goods in Kenya. Journal of Public Economics”, 89: 2325–2368.
Montalvo, J. G and Reynal-Querol, M., (2005b), “ Ethnic polarization, potential conflict and civil war”. The American Economic Review vol. 95 (no. 3), 796–816
26
Montalvo, J. G and Reynal-Querol, M., (2005a), “ Ethnic Diversity and Economic Development”. Journal of Development Economics, 76:293–323
Mueller, D. C. and P. Murrell (1986), “Interest groups and the size of government”, Public
Choice 48, 125–45.
Nathan, M. (2014), “ Same difference? Minority ethnic inventors, diversity and innovation in the UK”, Journal of Economic Geography, doi: 10. 1093/jeg/lbu006
Nunn, N. and Puga, D. (2012), “Ruggedness: The Blessing of Bad Geography”, Review of
Economics and Statistics, 94:20-36
Page, S. E. (2014), “Where Diversity comes from and Why it Matters?”, European Journal of Social Psychology, 44:267-279
Posner, D. (2002). Ethnic fractionalization in Africa: How should it be measured? What does it explain about economic growth? Unpublished working paper, University of California, Los Angeles.
Rauch, James E., and Alessandra Casella. (2003). “Overcoming Informational Barriers to International Resource Allocation: Prices and Ties. ” Economic Journal, 113(484): 21–42. Senik, C., Stichnoth, H. and Van der Straeten, K. (2009), “Immigration and natives‟ attitudes towards the welfare state: evidence from the European Social Survey”, Social Indicators
Research 91:345–370.
Stichnoth, H. AND Van Der Straeten, K. (2013), “Ethnic Diversity, Public Spending and Individual Support for the Welfare State: A Review of the Empirical Literature”, Journal of
Economic Surveys, 27:364-389
Surajeet Chakravarty, Miguel A. Fonseca. (2014), “The effect of social fragmentation on public good provision: An experimental study”, Journal of Behavioral and Experimental
Economics, 53:1-9
Wagstaff, A. and Wang, L. C. (2000), “A Hybrid Approach to Efficiency Measurement with Empirical Illustration from Education and Health”, World Bank Policy research Wp N°5751 World Bank (2005), “Public Expenditure Analysis”, World Bank Public Sector Governance and Accountability Series, Edited by Anwar Shah, World Bank, Washington, 2005
27
APPENDIX
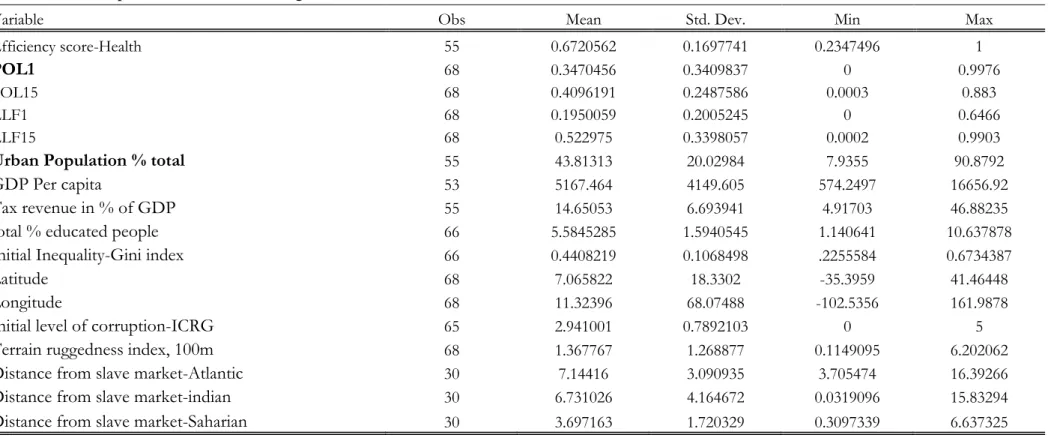
Table A1: Descriptive statistics, Health regression
Variable Obs Mean Std. Dev. Min Max
Efficiency score-Health 55 0.6720562 0.1697741 0.2347496 1
POL1 68 0.3470456 0.3409837 0 0.9976
POL15 68 0.4096191 0.2487586 0.0003 0.883
ELF1 68 0.1950059 0.2005245 0 0.6466
ELF15 68 0.522975 0.3398057 0.0002 0.9903
Urban Population % total 55 43.81313 20.02984 7.9355 90.8792
GDP Per capita 53 5167.464 4149.605 574.2497 16656.92
Tax revenue in % of GDP 55 14.65053 6.693941 4.91703 46.88235
total % educated people 66 5.5845285 1.5940545 1.140641 10.637878
Initial Inequality-Gini index 66 0.4408219 0.1068498 .2255584 0.6734387
Latitude 68 7.065822 18.3302 -35.3959 41.46448
Longitude 68 11.32396 68.07488 -102.5356 161.9878
Initial level of corruption-ICRG 65 2.941001 0.7892103 0 5
Terrain ruggedness index, 100m 68 1.367767 1.268877 0.1149095 6.202062
Distance from slave market-Atlantic 30 7.14416 3.090935 3.705474 16.39266
Distance from slave market-indian 30 6.731026 4.164672 0.0319096 15.83294
Distance from slave market-Saharian 30 3.697163 1.720329 0.3097339 6.637325
28
Table A2: Descriptive statistics, Education regression
Variable Obs Mean Std. Dev. Min Max
Efficiency score-Education 77 0.2865227 0.2280796 0.0801498 1
POL1 89 0.320236 0.3377312 0 0.9976
POL15 89 0.440991 0.244056 0.0014 0.9141
ELF1 89 0.176373 0.1923945 0 0.6466
ELF15 89 0.5145404 0.3199767 0.0007 0.9718
Urban Population % total 74 3.743807 0.5070626 2.071346 4.509531
GDP Per capita 72 8.341128 0.8680146 6.530031 9.720581
Tax revenue in % of GDP 74 15.10706 6.964017 7.33897 46.88235
total % educated people 83 1.816542 0.4687386 0.1315904 2.478202
Initial Inequality-Gini index 96 0.4110049 0.1125333 0.2174829 .6734387
Latitude 89 11.52661 21.01122 -35.3959 53.54239
Longitude 89 14.82286 65.8656 -174.8472 167.7031
Initial level of corruption-ICRG 100 3.120847 0.7912727 1 6
Governance Effectivenness 74 -0.4145048 0.5323268 -1.736698 0.8966388
Democracy index-Polity4 80 3.219167 5.586597 -9.2 10
Terrain ruggedness index, 100m 89 1.366529 1.344923 0.0028978 6.740056
Distance from slave market-Atlantic 36 7.099007 3.038361 3.705474 16.39266
Distance from slave market-indian 36 6.993432 4.18446 0.0319096 15.83294
Distance from slave market-Saharian 36 3.597452 1.691004 0.3097339 6.637325
29
Table A3: Descriptive statistics, Infrastructure regression
Variable Obs Mean Std. Dev. Min Max
Efficiency score-Education 64 0.4099851 0.2359504 0.0834613 1
POL1 64 0.3741594 0.3641579 0 0.9974
POL15 64 0.4787062 0.2149218 0.0086 0.8269
ELF1 64 0.2093531 0.210498 0 0.6466
ELF15 64 0.5570359 0.2980435 0.0043 0.9475
Urban Population % total 64 30.769654 0.4807815 20.557499 40.499608
GDP Per capita 63 80.387351 0.8575391 60.353065 90.720581
Tax revenue in % of GDP 64 150.23202 70.472802 20.859736 460.88235
total % educated people 52 10.821814 0.4306263 0.3749122 20.379931
Initial Inequality-Gini index 63 0.4120539 0.1172901 0.2174829 0.6734387
Latitude 64 140.68523 200.22016 -290.58041 530.54239
Longitude 64 130.74973 610.65404 -1020.5356 1220.8681
Initial level of corruption-ICRG 64 30.013951 0.7923696 0 5
Governance Effectivenness 64 -0.4097157 0.525245 -10.789034 0.8966388
Democracy index-Polity4 53 20.836478 50.335217 -90.2 10
Terrain ruggedness index, 100m 64 10.317582 10.374201 0.0028978 60.740056
Distance from slave market-Atlantic 24 70.004835 30.122478 30.888797 160.39266
Distance from slave market-indian 24 70.576112 40.13097 0.9039161 150.83294
Distance from slave market-Saharian 24 30.291081 10.784042 0.3097339 60.637325
30
Table A4: Efficiency scores
Health Education Infrastructure
Country Efficiency Score-DEA Rank Country Efficiency Score Rank Country Efficiency Score Rank Sierra Leone 1.000000 1 Kazakhstan 1.000000 1 Jordan 1.000000 1 Malaysia 1.000000 2 Turkey 1.000000 2 Mexico 1.000000 2 Cote d'Ivoire 0.911439 3 Armenia 0.791537 3 South Africa 1.000000 3 Congo, Dem. Rep. 0.905394 4 Bulgaria 0.701215 4 Turkey 1.000000 4
Cameroon 0.897054 5 Tajikistan 0.687857 5 Ukraine 1.000000 5
Pakistan 0.867765 6 Albania 0.679526 6 Bulgaria 0.931897 6
Venezuela, RB 0.866016 7 Ukraine 0.642240 7 Dominica 0.745970 7
Mali 0.859056 8 Tonga 0.625606 8 Kyrgyz Republic 0.700880 8
Mexico 0.822700 9 Peru 0.617000 9 Venezuela, RB 0.665630 9
Niger 0.813407 10 Argentina 0.584485 10 El Salvador 0.658535 10
Jamaica 0.813384 11 Ecuador 0.575166 11 Georgia 0.639625 11
Afghanistan 0.804843 12 Kyrgyz Republic 0.569087 12 Kazakhstan 0.637978 12
Lao PDR 0.783932 13 Belize 0.562560 13 Brazil 0.582942 13
Benin 0.777861 14 Dominican Republic 0.553007 14 Egypt, Arab Rep. 0.547547 14
Morocco 0.771401 15 Panama 0.532288 15 Angola 0.531399 15
Burundi 0.769458 16 Jamaica 0.508820 16 Sri Lanka 0.519010 16
Uganda 0.760060 17 Fiji 0.491725 17 Belarus 0.498934 17
India 0.758371 18 Gabon 0.446757 18 Moldova 0.486664 18
Togo 0.754658 19 Malaysia 0.403040 19 Tunisia 0.482782 19
Zambia 0.751977 20 Philippines 0.390445 20 Pakistan 0.403717 20
Rwanda 0.750284 21 Jordan 0.388449 21 Algeria 0.402518 21
Indonesia 0.745708 22 Mongolia 0.388331 22 Azerbaijan 0.401180 22 Cambodia 0.730717 23 Mexico 0.362936 23 Iran, Islamic Rep. 0.392598 23
Tajikistan 0.730357 24 Mauritius 0.362193 24 Panama 0.369153 24
31
Bangladesh 0.701240 26 South Africa 0.341522 26 Malaysia 0.365404 26
Lesotho 0.698243 27 Guyana 0.327878 27 Indonesia 0.365245 27
Gambia, The 0.694882 28 China 0.304686 28 Nigeria 0.353786 28
Guatemala 0.682271 29 Costa Rica 0.303404 29 Nepal 0.346870 29
Ghana 0.669066 30 Colombia 0.294465 30 Jamaica 0.344006 30
Nepal 0.666118 31 Iran, Islamic Rep. 0.288387 31 Guatemala 0.337978 31 Iran, Islamic Rep. 0.647399 32 Venezuela, RB 0.282268 32 Cote d'Ivoire 0.334291 32 Philippines 0.644756 33 El Salvador 0.254297 33 India 0.331533 33 Papua New Guinea 0.638568 34 Cuba 0.242996 34 Morocco 0.316106 34
Bolivia 0.611965 35 Paraguay 0.214005 35 Bolivia 0.306284 35
Armenia 0.610936 36 Botswana 0.160274 36 Paraguay 0.299555 36
Egypt, Arab Rep. 0.609777 37 Thailand 0.159740 37 Namibia 0.277382 37 Kyrgyz Republic 0.590986 38 Ghana 0.152262 38 Costa Rica 0.274218 38
Belize 0.590720 39 Guatemala 0.150908 39 Zambia 0.266102 39
Thailand 0.590170 40 Congo, Rep. 0.141050 40 Togo 0.262638 40
Botswana 0.581507 41 Indonesia 0.136563 41 Congo, Rep. 0.262218 41 Peru 0.570269 42 Nicaragua 0.134696 42 Congo, Dem. Rep. 0.258346 42
Paraguay 0.563815 43 Cameroon 0.126303 43 Kenya 0.257561 43
Sri Lanka 0.546591 44 Pakistan 0.125468 44 Philippines 0.254162 44 South Africa 0.541023 45 Gambia, The 0.125210 45 Benin 0.253360 45
Fiji 0.538913 46 Cambodia 0.124835 46 Cambodia 0.251781 46
Tunisia 0.532557 47 Mauritania 0.124442 47 Burkina Faso 0.251684 47 Nicaragua 0.532224 48 Central African Republic 0.123649 48 Uganda 0.250821 48
Honduras 0.508799 49 Lao PDR 0.122467 49 Peru 0.249796 49
Namibia 0.474395 50 India 0.121561 50 Niger 0.247730 50
El Salvador 0.447922 51 Bangladesh 0.121527 51 Gambia, The 0.244697 51
Colombia 0.326367 52 Benin 0.119786 52 Ethiopia 0.241303 52
32
Argentina 0.262823 54 Cote d'Ivoire 0.118740 54 Bangladesh 0.240373 54 Costa Rica 0.234750 55 Sierra Leone 0.118159 55 Mali 0.239245 55
Niger 0.118127 56 Nicaragua 0.227528 56 Mali 0.118107 57 Ghana 0.226981 57 Nepal 0.118096 58 Bhutan 0.224213 58 Togo 0.117386 59 Lesotho 0.222109 59 Uganda 0.117298 60 Lao PDR 0.221010 60 Burundi 0.116491 61 Suriname 0.196682 61 Tanzania 0.116326 62 China 0.187838 62
Egypt, Arab Rep. 0.115964 63 Mongolia 0.158533 63
Liberia 0.115804 64 Grenada 0.083461 64 Mozambique 0.115783 65 Rwanda 0.115625 66 Malawi 0.114975 67 Kenya 0.110194 68 Algeria 0.109938 69 Vietnam 0.107523 70 Morocco 0.104412 71 Yemen, Rep. 0.098851 72 Swaziland 0.092602 73 Maldives 0.091778 74 Tunisia 0.090728 75 Lesotho 0.084718 76 Namibia 0.080150 77
33
Table A5: Efficiency scores, less efficient versus most efficiency
Health Education Infrastructure
Most efficient Less efficient Most efficient Less efficient Most efficient Less efficient Sierra Leone Argentina Kazakhstan Lesotho Jordan Mongolia Countries Malaysia Costa Rica Turkey Namibia Mexico Grenada
South Africa Turkey Ukraine Mean of ELF1 0 .3421 0.0847 0 .37825 0.23905 0.16304 0.02145 Mean of ELF15 0.78775 0.13125 0.4946 0.53425 0.45384 0.19785 Mean of POL1 0.59725 0.16125 0.7182 0.3789 0.31014 0.04285 Mean of POL15 0.5568 0 .234 0.61165 0 .5096 0.526 0 .33