The Autoignition Characteristics of Turbocharged Spark
Ignition Engines with Exhaust Gas Recirculation
by
Jacob Elijah McKenzie
B.S., University of California, Berkeley (2009)
S.M., Massachusetts Institute of Technology (2012)
Submitted to the Department of Mechanical Engineering
in partial fulfillment of the requirements for the degree of
Doctor of Philosophy in Mechanical Engineering
at the
MASSACHUSETTS INSTITUTE OF TECHNOLOGY
L-ARCHNES
MASSACH USETT !NSTITUTE
OF ECHO'.LQLGY
JUL 3
0
2015
LIBRARIES
June 2015
Massachusetts Institute of Technology 2015. All rights reserved.
Signature redacted
A u th o r ...
Department of Mechanical Engineering
May 10, 2015
Signature redacted
C ertified b y ... ...
Wai K. Cheng
Professor of Mechanical Engineering
Thesis Supervisor
Signature redacted
A ccepted by ... . . . ...
David Hardt
Professor of Mechanical Engineering
Chairman, Department Committee on Graduate Theses
The Autoignition Characteristics of Turbocharged Spark Ignition
Engines with Exhaust Gas Recirculation
by
Jacob Elijah McKenzie
Submitted to the Department of Mechanical Engineering on May 10, 2015, in partial fulfillment of the
requirements for the degree of
Doctor of Philosophy in Mechanical Engineering
Abstract
The societal demand for vehicles with high efficiency and low emissions has spurred considerable changes to the automotive internal combustion engine within the past decade. Reductions in the displacement volume and increases in maximum output per unit of displacement are among the characteristics adopted to meet the fuel economy targets of world governments. However, the extent to which these changes in engine configuration may be pursued in search of efficiency is limited by several fundamental phenomena. The intent of this research project is to investigate the modeling
of one of these phenomena - the autoignition of an unburned portion of the air-fuel mixture - and a
potential strategy intended to delay the occurrence of this frequently damaging type of combustion reaction. The autoignition abatement approach studied entails the recirculation of burned exhaust gasses which serve to dilute the air-fuel mixture and reduce maximum unburned gas temperatures
Experimental testing was performed on two different types of exhaust gas recirculation (EGR)
system - one which extracts exhaust gases from upstream of the catalytic converter and another
which extracts gases from downstream - in order to determine if the changes in composition that
occur across the catalyst affect the autoignition abatement characteristics of the recirculated exhaust. This testing indicated that differences between the alternative installations are dominated by changes in the flow dynamics of the exhaust system, with no definite changes attributable to compositional differences. An empirical method of predicting the occurrence of autoignition using experimental data was then developed based on an approach originally proposed by Livengood and Wu. Ignition delay correlations were developed that provide accurate autoignition prediction over a range of speeds, loads, air-fuel equivalence ratios and dilution rates. Additionally, a new statistical model for autoignition is proposed that captures the cycle-to-cycle variation in autoignition intensity and relates these variations to the thermodynamic state of the charge.
Thesis Supervisor: Wai K. Cheng
Acknowledgments
I would like to thank the members of my thesis committee Professor Wai K. Cheng, Professor John B. Heywood and Professor William H. Green, for their insightful guidance and helpful analysis of the often complex but always interesting internal combustion engine. Thanks to the members of the Engine and Fuels Research Consortium: Borg-Warner, Chrysler, Ford Motor Company and General Motors who sponsored this research project and Rick Davis of GM, Tom Leone of Ford and David Roth of Borg-Warner who all provided invaluable feedback, suggestions and practical advice. Additional thanks go to my many colleagues at the Sloan Automotive Laboratory who have helped to make this work a success. Finally, my deepest appreciation goes to Emma Duong, whose support and love has made this document possible.
Contents
1 Introduction
1.1 M otivation . . . .
1.2 Background and Literature Review . . . .
1.3 Research Objectives . . . .
2 Experimental Apparatus and Procedures
2.1 E ngine . . . .
2.2 Dynamometer and Auxiliary Systems . . . .
2.3 Data Acquisition and Processing . . . .
2.4 Experimental Procedures . . . . 3 Effects of EGR Source on Engine Operation
3.1 Recirculated Exhaust Composition . . . .
3.2 Thermo-physical Effects of EGR Source . . . . .
3.3 Combustion Effects of EGR Source . . . .
4 Knock Onset and Intensity Correlation
4.1 Chemical and Empirical Autoignition Models
4.2 Computational Formulation of the Knock Integral
4.3 Stoichiometric Knock Integral Correlation . . . .
4.4 Non-Stoichiometric Knock Integral Correlation . 4.5 Statistical Autoignition Model. . . . . 5 Summary and Conclusions
5.1 Pre-Catalyst and Post-Catalyst EGR . . . .
5.2 Knock Modeling and Prediction . . . .
5.3 Recommendations for Future Work . . . .
21 21 23 31 33 . . . . 33 . . . . 40 . . . . 42 . . . . 44 47 . . . . 48 . . . . 51 . . . . 56 75 . . . . 75
and Ignition Delay . . . . 88
. . . . 97 . . . . 103 . . . . 110 125 . . . . 125 . . . . 126 . . . 128 135 Acronyms
A Fuel Properties 137
List of Figures
1-1 A substantial portion of the work extracted from the combustion of fuel is used to
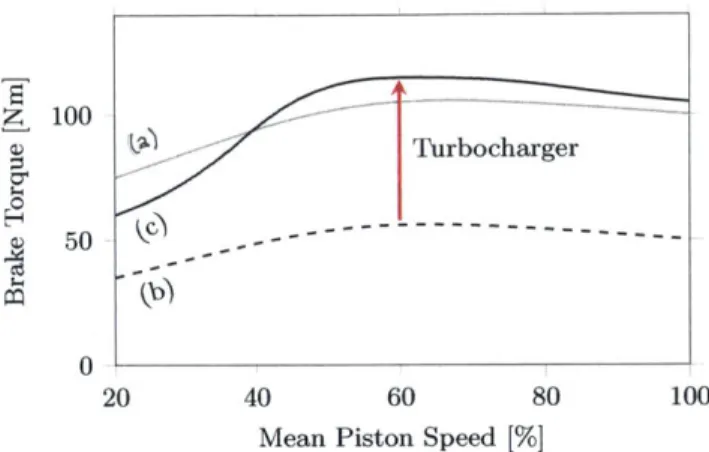
draw air through the throttle restriction, significantly reducing efficiency at low loads. 22 1-2 The maximum torque output of a naturally aspirated engine is illustrated by the
curve (a). If the displacement is reduced the shape of the maximum output curve (b) is scaled to smaller values. The addition of a turbocharger increases the maximum
output from (b) to (c), which is similar to (a). . . . . 23
1-3 The ignition delays predicted by Eq. 1.8 and Eq. 1.6 differ in their sensitivity to
temperature with Eq. 1.8 exhibiting considerably stronger temperature dependence. 27
1-4 The percentage difference between ignition delays predicted by Eq. 1.8 and Eq. 1.6
is shown. As indicated the range within which these expressions agree to 10 % is
limited to a very narrow temperature band. The region of the pressure and tempera-ture map studied by He et. al. provides some potential insight into the reason for the observed differences. The best fit form of the ignition delay function depends strongly on the region of the p-T map over which the fit is computed. The fit used by Douaud and Eyzat relied heavily on testing in CFR research engines which cause the end gas
to reach higher pressures prior to autoignition. . . . . 27
1-5 An uncooled high-pressure EGR loop (a), and a cooled low-pressure EGR loop (b)
are shown on a schematic diagram of a turbocharger spark ignition engine. . . . . . 28
1-6 The spatial and temporal evolution of exothermic centers (ETCs) is shown in this image produced by Maly which shows the extent of burned regions during the au-toignition event. ETCs such as B develop into deflagrations, this is the dominant mode by which the end gas is consumed. Alternatively the center which is marked A proceeds into a developing detonation. The combined effect of the rapid combustion of the end gas forces the main flame produced by the spark plug backward. Reproduced
2-1 Positions of sensors in the intake air path. Only sensors connected to the data acqui-sition system are shown. The factory installed sensors connected to the engine control module (ECM) and used for engine control exist alongside these data acquisition sensors. 35 2-2 Diagram of the direct injection system on the LNF. Under some light-load conditions
the side-mounted injector spay interacts with the piston bowl. During most high-load operation this interaction does not occur as the fuel is injected while the piston is
lower in the stroke. Image
@
General Motors. . . . . 362-3 Diagram of fuel system. Fuel leaving either of the two tanks proceeds through a low pressure pump, secondary fuel filter and pressure regulator before reaching the fuel source selection valve. Fuel from the selected tank flows into a fuel delivery selection valve which directs the fuel to either a purge outlet or the engine. Fuel flowing to the engine enters a small damping tank before proceeding through the high pressure fuel
pump. The high pressure fuel is then delivered to the direct injectors. . . . . 36
2-4 The cylinder pressure transducer is located within the cylinder head between the intake and exhaust valves. The transducer is approximately 20 mm from the cylinder
w all. . . . . 37
2-5 Positions and types of sensors in the exhaust and EGR system. The dotted line between the point just downstream of the catalyst and the EGR cooler represents an alternative configuration of the EGR loop that draws exhaust gasses from downstream
of the catalyst. . . . . 38
2-6 Gaseous fuels were added to a point in the intake path between the air heater and throttle plate. Fuel gasses were delivered through a flow proportioning valve and
flame arrestor. ... ... . ... ... 39
2-7 Diagram of the cooling system used with the LNF engine. Coolant is supplied from a tank and a portion of the flow through the engine is directed through the EGR cooler. The coolant temperature is reduced using a heat exchanger fed with municipal water
or increased using an electric heater. . . . . 42
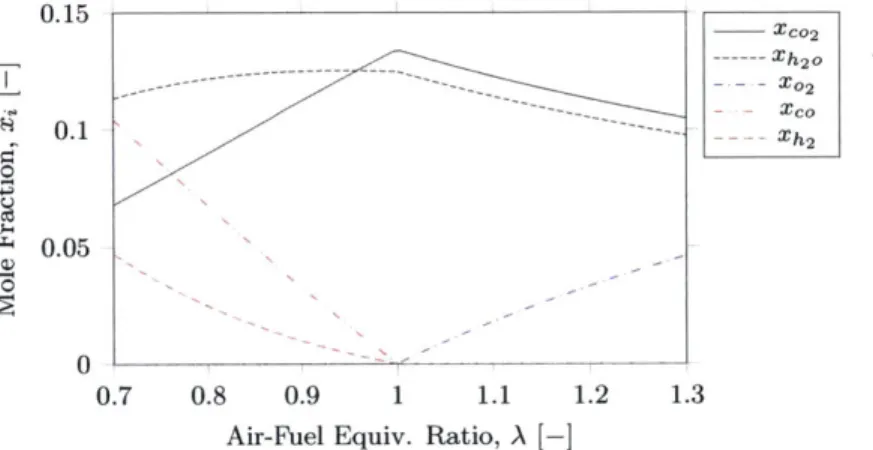
3-1 The mole fractions of carbon dioxide, water vapor, oxygen, carbon monoxide and
hydrogen as a function of air-fuel equivalence ratio. . . . . 50
3-2 A spark sweep performed with the EGR system installed in the pre-catalyst location results in a higher net indicated fuel conversion efficiency than when the EGR system is installed in the post-catalyst configuration or removed entirely. This installation
effect occurs in the absence of recirculation flow (with the EGR valve fully closed). . 52
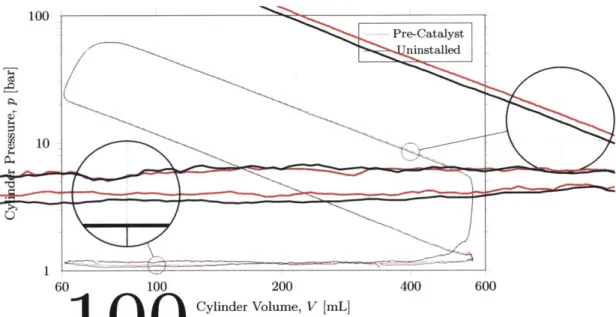
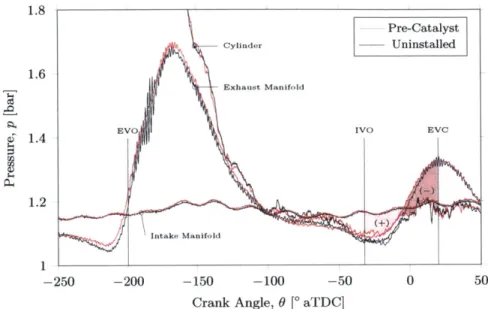
3-3 The majority of the efficiency improvement realized by installing the EGR system
in the pre-catalyst location is attributable to an overall increase in pressures in the
3-4 The blowdown and scavenging characteristics of engine change when the EGR system is installed in the pre-catalyst location. During valve overlap the positive pressure differential across the intake valve is reduced (area indicated by a +) while the area of a negative pressure differential across the exhaust valve is increased (area indicated
by a -). These two changes tend to cause a higher fraction of residuals to be trapped
due to less effective scavenging during the + region and increased reverse flow across
the exhaust valve during the - region. . . . . 54
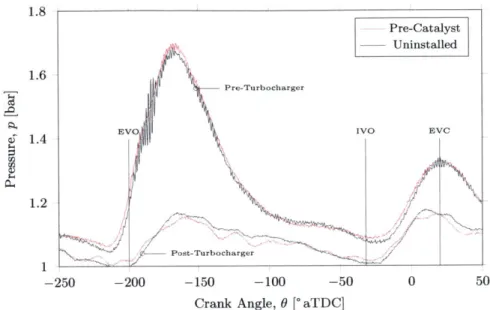
3-5 The pressure drop across the turbocharger is larger over the majority of the blowdown
event when the EGR system is installed in a pre-catalyst location. The post-turbine pressure does not rise as high as when the EGR system is not installed. During the energetic blowdown phase pressure oscillations occur when no EGR system is installed that are largely eliminated when the EGR system is installed in a pre-catalyst location. The pressure oscillations may be caused by cylinder interactions within the scroll of
the turbocharger, which is operating near the surge limit. . . . . 55
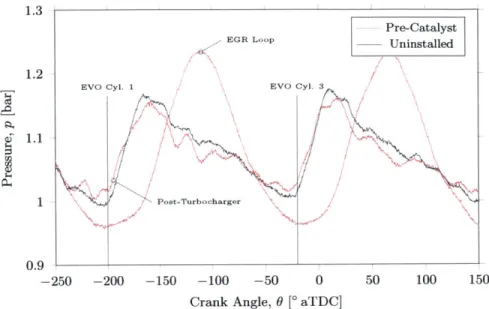
3-6 The pressures measured when the EGR system is installed in the pre-catalyst location indicate that during the early phase of the blowdown there is flow into the EGR loop volume. During the later part of the blowdown and the exhaust displacement stroke the pressure in the EGR loop exceeds the post-turbine pressure and mass flows out of the EGR loop through the catalyst. Compared to the pressures observed when no EGR system is installed the amplitude of pressure fluctuations due to pulsating flow
observed just upstream of the catalyst is reduced. . . . . 56
3-7 Configuration of EGR loop for pre-catalyst EGR. . . . . 57
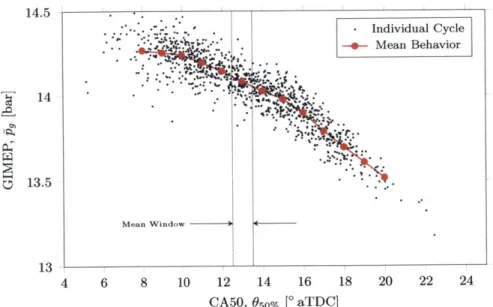
3-8 Data is reduced by computing the mean value within a the crank angle of fifty percent
heat release (CA50) window. The window width used is 10 and windows that do not contain at least 15 cycles are neglected. The data shown here represents a range of spark timing values between 9.75* bTDC and 16.5 bTDC under stoichiometric
conditions with no EGR. . . . . 58
3-9 As indicated by this surface plot the burn duration is more heavily dependent on CA50
than EGR rate. Nevertheless increasing the EGR rate does result in an increase in
the burn duration as expected. . . . . 59
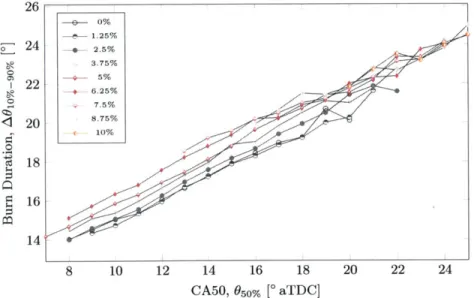
3-10 Under the conditions studied the burn duration increases by 2* when the EGR rate is increased from 0% to 8.75% at fixed CA50. The increase in burn duration does not appear to be a strong function of combustion phasing. The increased scatter on the upper right side of the plot is due to increases in cycle to cycle variation at late
3-11 The burn duration at fixed CA50 of 140 aTDC increases uniformly for EGR rates higher than 1.25%. The magnitude of the observed changes in burn duration is on
the order of 20 for a change in EGR rate of 8.75%. . . . . 60
3-12 The relationship between spark timing and CA50 appears to be uniform over the range of EGR rates and combustion phasing values studied. The spark timing must be advanced just over 2* to maintain constant CA50 when the EGR rate is increased from 0% to 10%. The range of variation in CA50 that is observed at constant spark timing is considerable which complicates the interpretation of data that is presented
with spark timing as the abscissa . . . . 61
3-13 The gross indicated mean effective pressure (GIMEP) plotted as a function of CA50 shows only a slight dependence on EGR rate. The reduction in peak GIMEP from
the 0% EGR case is accounted for by a reduction in the combustion efficiency. . . . . 61
3-14 The efficiency improvements that are offered by EGR take the form of improvements that alter the thermodynamic characteristics of the charge and improvements that
alter the autoignition behavior, which allow more favorable combustion phasing. . . 64
3-15 The knock limited CA50 is indicated on a normalized plot of GIMEP. Increasing the EGR rate from 0% to 6.25% decreases the knock limited CA50 by just over 3*. If a conservative strategy is adopted as would be required in a production engine due to cycle-to-cycle variation in CA50 the improvement in GIMEP is approximately 1.4%. The aggressive CA50 limit indicates the CA50 at which the engine could operate with
only 10% knocking cycles if there was no cycle-to-cycle variation in CA50. . . . . 65
3-16 As EGR is first introduced the initial effect is to slow the early phases of flame development without changing the knock limited CA50. However, beyond EGR rates of 2.5% the majority of the spark advance is used to advance the CA50 to take
advantage of the improved knock tolerance of the charge. . . . . 66
3-17 During rich operation (A = 0.95) the response of GIMEP to increasing EGR rates is similar to the stoichiometric case. Maximum brake torque (MBT) output appears to
decrease with increasing EGR rate. . . . . 66
18 Burn duration are very similar between rich and stoichiometric operation (cf. Figure
3-10), although a larger range of EGR rates was possible. . . . . 67
3-19 The burn duration at a fixed combustion phasing of 14 aTDC increases along similar lines as the stoichiometric case, however beyond 7.5% EGR the burn duration appears to stabilize. Because such EGR rates could not be obtained at this combustion phasing
3-20 The change in knock limited spark advance up to 6.25% EGR is very close to the change observed under stoichiometric conditions, however the change in the knock
limited CA50 is reduced from 3* in the stoichiometric case to 20. This may indicate
that at the same dilution rate rich EGR provides less knock abatement however the fact that the knock limited CA50 has already been advanced 1.6" due to the change
in air-fuel ratio may contribute to this difference in behavior. . . . . 68
3-21 The smaller change in knock limited CA50 and more optimal initial combustion phas-ing under rich operation mean that improvements in GIMEP are smaller than the
stoichiom etric case. . . . . 68
3-22 The MBT CA50 and overall characteristics of the GIMEP profiles are unchanged from
the conditions observed with pre-catalyst EGR. . . . . 69
3-23 Burn durations and their dependence on EGR rate is also very similar to the pre-catalyst EGR conditions, however the data indicates that spark to 10% burn durations
are reduced by 3' across all conditions. . . . . 70
3-24 The relationship between spark timing and CA50 demonstrates the change that has occurred in the early stages of flame development when the EGR system was changed. The post-catalyst configuration results in shorter flame development periods. This is believed to be caused by an increase in scavenging during valve overlap which tends
to enrich the charge. . . . . 70
3-25 Changes in the knock limited spark advance and knock limited CA50 are similar to those observed with pre-catalyst EGR at a slightly higher external EGR rate. This may be due to displacement of residual gasses in the pre-catalyst configuration that
does not occur using the post-catalyst installation. . . . . 71
3-26 The knock limited CA50 with no EGR is close to MBT timing, thus improvements in efficiency due to improvements in autoignition tolerance result in a considerably
lower efficiency gain. . . . . 71
3-27 The replacement of gasoline with hydrogen fuel in the percentages indicated above each point indicate that the initial effect of hydrogen addition is to decrease the spark to 50% burn duration without substantial changes in the knock limited CA50. Beyond 3% hydrogen by energy the additional hydrogen reduces changes in the unburned gas temperature resulting in improved knock resistance and earlier knock limited CA50
3-28 The addition of CO initially results in shortened spark to 50% burn durations and a modest improvement in the knock limited combustion phasing (1*). Beyond 4.5% of the fuel energy no additional improvement in the knock limit is realized however the burn durations continue to be reduced. It is unlikely that CO in the fractions present
in EGR is capable of altering the gross combustion characteristics. . . . . 73
3-29 Nitric oxide appears to degrade the knock resistance of the air-fuel mixture despite relatively minute concentrations. This effect, although possible, is not likely to occur
in practice because the formation rate of NO in engines operating with EGR is low. 74
4-1 Schematic diagram of a combustion bomb (adapted from Keck[31l) and a rapid
com-pression machine showing their construction and key parts. The combustion bomb is filled with an air-fuel mixture which is ignited by the extended spark plug electrodes. The spherical flame that develops compresses the end gas near the chamber walls which may cause it to autoignite. The rapid compression machine (RCM) is filled with an air-fuel mixture and the hydraulic section is pressurized to hold the piston at the bottom of its stroke. A pneumatic pressure is then applied to a driving piston pre-loading the piston shaft. Once the hydraulic pressure is removed the piston is
driven forward at high speed, compressing the air fuel mixture. . . . . 76
4-2 Schematic representation of two-stage ignition in a rapid compression machine. The
temperature of the mixture may rise by 75 K during the cool flame stage which
rep-resents the release of well under 5 % of the total fuel energy. . . . . 76
4-3 The ignition delay isobars that are described by Eq. 4.4 are shifted upward by
in-creasing a, downward by inin-creasing b and increasing c increases the slope of the line
while maintaining the same y-intercept. . . . . 79
4-4 Ignition delay data from Fiewegerl 1 for primary reference fuel (PRF) 90. The
ex-ponential temperature dependence in
r
can only accurately model a portion of theignition delay characteristics of a real fuel. . . . . 79
4-5 The reciprocal of the ignition delay is accumulated until the area under the curve equals unity. Errors accumulated up to t, must be balanced by an additional area
between t, and t,
+
At.. . . . . 814-6 Contour plot of (Ar/r)(1/(T
+
AT)) which is the controllable factor that influencesuncertainty in ignition delay prediction (At,). The upper left portion of the map represents the most damaging situation per unit integration time and the lower right
4-7 Three functional relationships between T and AT are explored that result in identi-cal values of U from Eq. 4.18 and therefore are expected to result in similar errors in autoignition prediction. A slight improvement in accuracy near the autoignition conditions allows considerably more latitude for errors at higher ignition delays. A comparison of these functions with contours over which the integrand of U is constant
indicate that when AT oc T2 the integrand of U is nearly independent of r and thus
errors are accumulated uniformly over time. . . . . 84
4-8 A fit to ignition delay data observed in shock tubes experimentally by Fieweger22
was computed by weighting the data according to (r - 2.5 ms)2 . The center of the
weighting function is dictated by the operating characteristics of a particular appara-tus, with ignition delays of 2 ms to 3 ms being common near the time of autoignition
in CFR engines[171. For an engine that operates at higher temperatures and pressures
the weighting target would be shifted to the left resulting in a higher slope. . . . . . 85
4-9 The cylinder pressure transducer is located in the cylinder head between the intake
and exhaust valves. . . . . 89
4-10 The high-pass filtered cylinder pressure (P) oscillates during an autoignition event.
The first 1 bar threshold crossing, indicated by the square, occurs roughly 50 Ps after
anomalous pressure fluctuations are first observed. . . . . 93
4-11 Comparing the measured cylinder pressure (p) to the low-pass filtered cylinder pres-sure aids in the manual identification of knock onset time, indicated by the circle, which is placed at the first sign of pressure rise beyond the smoothed curve that is
followed by oscillatory ringing. . . . . 93
4-12 The three stages of autoignition are distinguishable on an i0 contour. During normal
combustion i, has a low, consistent slope which increases rapidly to a maximum value during the active autoignition stage. Following the active stage of autoignition the pressure oscillations are damped out, causing the slope to decay towards the value
present during normal combustion. . . . . 95
4-13 Two intersecting lines are fit to the ipo, contour for a cycle in the region surrounding the maximum filtered pressure. The intersection of the two fit lines is identified as the time of knock onset as indicated by a circle. Note that adjustment of the fit window to incorporate only normal combustion and active autoignition does not materially
affect the identified knock onset time. . . . . 96
4-14 The difference between manually and automatically identified knock onset time for the
proposed algorithm (p = 20 ps, a = 37 ps) and the thresholding approach (p = -72 ps,
4-15 Correlation between the experimentally observed knock time (tke) correlates well with the knock time predicted by the autoignition model (tkm). Each cluster of points
represents a different engine speed. Total of 4219 knocking cycles (max ;>I 1) under
336 steady state operating conditions. . . . . 99
4-16 The data presented on a time basis (cf. Figure 4-15) may be plotted in terms of crank
angles to collapse differences in timescale due to engine speed variation. . . . . 99
4-17 Histogram of error between modeled and experimental knock time. The distribution has a mean of 26 ps and a standard deviation of 53 ps. The positive mean value indicates that the model consistently predicts autoignition slightly before it is observed. 100
4-18 Iso-delay contours are plotted for 0.5 ms to 250 ms on the p-T plane with wd =
0.
The pressures and temperatures observed at autoignition are indicated as points and a representative p-T trajectory for an adiabatic and isentropic compression is shown. Ignition delays ranging from 0.5 ms to 1 ms are most common at the autoignition con-ditions. Alternative iso-delay contours for non-zero dilution rates may be constructed
by multiplying the contour levels by (1 - Wd)- 0.6 18 . . . . . 101
4-19 Error in the knock integral correlation is initially uncorrelated with CA50 for early combustion phasing, however near MBT combustion phasing the errors begin to de-viate from the mean value. This can be traced back to the longer induction times
when the engine is operated with late combustion phasing . . . . 102
4-20 The best correlation is found between the ignition delay at knock and the error. Such a correlation most likely arises due to oversimplification of the mathematical form of the ignition delay. Recalling the typical shapes of ignition delay measurements
(cf. Figure 4-4) the direction of the observed errors is consistent with the expected
overestimation of smaller ignition delays and underestimation of larger delays. . . . . 102
4-21 The iso-delay contours on the p-T map are very similar for Eq. 4.48 (black) and for Eq. 4.50 (red, dashed). They are particularly similar near the conditions at
autoigni-tion which are shown as points. . . . . 103
4-22 Correlation between the experimentally observed knock crank angle (Oke) and the crank angle of knock predicted by the autoignition model (Okm). This correlation is not as strong as the stoichiometric correlation indicating that there is some work still
to do in the identification of appropriate correlating parameters. . . . . 110
4-23 Histogram of error between modeled and experimental knock time. The distribution
has a mean of 32
ps
and a standard deviation of 59ps.
The positive mean value4-24 The error in autoignition prediction is correlated with the ignition delay at knock. This correlation is consistent with a mathematical ignition delay model that overes-timates the ignition delay when it is lower than typical values at autoignition and
overestimates ignition delay values that are larger. . . . . 110
4-25 Variation in CA50 alone is insufficient to describe the presence of both knocking and
non-knocking cycles at a steady state operating point. . . . . 111
4-26 Variation of knock intensity from one cycle to the next. . . . . 113
4-27 Some of the variation in knock intensity may be attributed to variation in CA50. However, as evidenced by the vertical spread, combustion phasing alone does not
account for all of the CA50 variation . . . . 114
4-28 The probability density histogram of experimental data agrees well with a lognormal
fit. ... ... 114
4-29 If the values of the autoignition integral for macro-scale end gas parcels are normally distributed a portion of the end gas will cross the autoignition limit in time At. The factors that govern the rate at which the available fuel crosses the autoignition limit
are primarily the rate of change of I,, and the distribution width I. . . . . 117
4-30 The intensity of knock does not appear to be correlated with the available mass of
fuel at the inception of autoignition. . . . . 118
4-31 The mean knock intensity scales with the ignition integral slope (1/r), the mean
knock intensity appears to increase exponentially. . . . . 119
4-32 Frequency distributions for ranges of 1/kr. As 1/r increases the center of the distri-bution moves towards higher knock intensities and the length of the distridistri-bution tail to the right is increased. This behavior mirrors the behavior of a lognormal distribution
with increasing scale parameter (p). . . . . 119
4-33 Correlation between the ignition integral slope and location parameter is nearly linear
for knocking cycles. . . . . 121
4-34 Cycles below with an ignition integral slope of below 800s 1 are very unlikely to
knock, thus the data in this range is of limited use. . . . 121 4-35 The scale parameter is approximately constant for values of the ignition integral slope
greater than 800 s-1. . . . 122 4-36 The probability that a cycle will exceed 1 bar in knock intensity grows according to
the cumulative density function Pk = 1 - F(1, 1/kr,m). . . . . 123
4-37 Similarly the probability that a cycle will exceed 5 bar in knock intensity is modeled
List of Tables
2.1 The geometry and characteristics of the General Motors LNF engine are typical of
many turbo-downsized four cylinder engines produced between 2007 and 2015. . . . 34
2.2 The cam phasers can adjust the intake and exhaust cam phasing by 500. The default
or parked position of the intake and exhaust cams are given as well as the fully phased position. The intake cam timing is advanced and the exhaust cam timing is delayed
with increased phaser activity . . . . 40
2.3 Fixed valve timing values used to collect the experimental data presented in this
doc-ument except where alternative valve timing is specifically stated. This cam phasing
has moderate overlap at 52* using the 0.25 mm lift definition of opening and closing. 40
4.1 Uncertainty types as functions of T. . . . . . . . . . . . . . . . . . . . . . . . . . . . 83
4.2 Experimental conditions for T determination consist of 4219 individual knocking cycles
from 336 unique steady state operating points. . . . . 98
4.3 Composition of the exhaust and charge for lean, stoichiometric and rich operation
with EGR. Note that
6
is negative for the fuel rich case. . . . 1084.4 Table of operating points for optimization of k, and kI, this data set consists of 4537 non-stoichiometric knocking cycles. . . . 109
Chapter 1
Introduction
The design and operation of internal combustion engines has been an area of intense academic and practical research for well over a century. With a history of such length and a device of such ubiquity there is often a temptation to believe that there is little left to do and few improvements to make. However, this is most certainly not the case. The degree to which internal combustion engines have become a part of lives throughout the world has fostered cultural connections to the services that engines provide. This connection between people and engines has driven their development to adapt to the constantly shifting social, political and environmental concerns of world societies. These shifting societal ideals ensure that new technologies, methods and theories are always in demand. Of special interest now, at the beginning of the 21st century, are the carbon dioxide and other gaseous emissions of internal combustion engines. The link between carbon dioxide emissions and changes to the climate of Earth have driven many countries to institute minimum fuel mileage standards throughout the transportation sector, prompting vehicle manufacturers to search for and implement strategies that improve the efficiency with which chemical fuel energy is used to move vehicles about. The research effort detailed in this document seeks to develop a detailed quantitative understanding
of the autoignition of air-fuel mixtures - a key factor that limits the efficiencies possible using
spark-ignitied engines - and a promising method of autoignition abatement that relies on dilution of a
combustible mixture with inert chemical species.
1.1
Motivation
The principal motivation for current research on autoignition is the demand for high efficiency, low emission vehicles. Beginning in the mid 1970s concerns regarding vehicle emissions and efficiency began to take legislative hold in the United States. Initially, high levels of harmful gaseous emissions and gross overuse of fuel were the primary concerns, however with the widespread introduction of the three way catalyst and electronic fuel injection systems levels of avoidable emissions have decreased
substantially. The corporate average fuel economy (CAFE) standards, which were imposed in the wake of the 1973 oil crisis to improve the fuel economy of vehicles sold in the United States, require that vehicles offered for sale meet or exceed a fleet averaged fuel efficiency, which is often stated as a number of miles per gallon of fuel consumed. CAFE standards initially rose the minimum fleet averaged fuel economy from 18 mpg in 1978 to 26mpg by 1983, however over the subsequent 27 years CAFE standards were stagnant, increasing to only 27.5 mpg by 2010. Beginning in 2011 concerns regarding carbon dioxide emissions and fossil fuel consumption in the United States led to the adoption of updated CAFE standards that plan to reach a fleet averaged minimum fuel economy of 54.5 mpg by 2025 for cars and light duty trucks. The task of reducing fuel consumption by nearly half in under 15 years presents many technical and economic challenges.
An approach that has seen widespread adoption over the past five years is the simultaneous reduction of displacement volume and increase in maximum output per unit of displaced volume
- which is usually accomplished using a turbocharger. This strategy, which is often called turbo
downsizing[4 11, replaces a large naturally aspirated engine with a smaller turbocharged engine, and is
an effective method of increasing the average engine efficiency achieved during use without compro-mising maximum torque output. Turbo downsizing accomplishes this by recognizing that automotive engines are frequently operated well below their maximum output. A naturally aspirated engine op-erating under these conditions restricts the flow of air into the intake manifold, which reduces the intake manifold pressure to a level well below atmospheric pressure. The pumping work associated with maintaining this pressure differential consumes a considerable fraction of the work extracted from combustion at low loads, greatly reducing the net efficiency (cf. Figure 1-1). Alternatively, if the displacement of the engine is reduced, the engine is less throttled for the same torque output;
therefore the pumping work is reduced and the efficiency is improved15 01. A turbocharger is then
added to the downsized engine to allow the intake manifold pressure to exceed atmospheric pressure. This allows the turbo downsized engine to burn fuel and air at roughly the same rate as a larger engine, thereby achieving a similar maximum torque output (cf. Figure 1-2).
100 10 "t) Wpumping 1 0.5 50 100 1000 Cylinder Volume [cc]
Figure 1-1: A substantial portion of the work extracted from the combustion of fuel is used to draw air through the throttle restriction, significantly reducing efficiency at low loads.
11
100-Turbocharger
50
0
20 40 60 80 100
Mean Piston Speed [%]
Figure 1-2: The maximum torque output of a naturally aspirated engine is illustrated by the curve (a).
If the displacement is reduced the shape of the maximum output curve (b) is scaled to smaller values. The
addition of a turbocharger increases the maximum output from (b) to (c), which is similar to (a).
Although the part-load efficiency of a turbo-downsized engine is higher than its naturally aspi-rated counterpart, several factors limit the efficiency of these engines at medium to high loads[6 01. A challenge of particular importance is the occurrence of autoignition, also known as knock, and the measures required to avoid it. Knock occurs when an unburned mixture of air and fuel (end gas) is compressed, heated and given sufficient time to autoignite independently of the flame initiated by the spark plug. The rapid heat release that occurs during autoignition results in potentially damaging cylinder pressure oscillations and rapidly increases the temperature of critical engine components. This makes the avoidance of severe knock essential to engine durability. As engine displacement is reduced the maximum torque required, which is largely a function of vehicle weight, remains virtually unchanged. This requires that downsized engines operate at a higher output per unit displacement, a requirement which tends to promote autoignition. Thus as turbo downsizing is pursued, autoignition begins to play an increasingly critical role in the design and operation of spark-ignitied automotive engines.
1.2
Background and Literature Review
Much research has been performed on the autoignition of air-fuel mixtures with the earliest efforts dating back well over one hundred years. In the early part of the 20th century the majority of research effort was dedicated to the identification of suitable fuel additives that have the ability to delay the occurrence of autoignition. This research effort lead to the identification of tetraethyl lead (TEL) as an anti-knock additive and a great deal of additional effort was expended to understand the source of its anti-knock properties. Although the effectiveness of TEL as an anti-knock additive is beyond question the neurotoxicity of lead presents health risks that are beyond the tolerance of modern society. Beginning in the mid-1970s TEL was phased out of most fuels in the United States although it still remains in limited use for piston-powered aircraft engines. Unfortunately, many of
the additives that have the capability to prevent autoignition also present toxicity risks to humans, and thus the research focus has shifted towards making the best possible use of available fuels.
Mathematical Autoignition Models
Beginning in the 1950s several methods of developing a mathematical model of autoignition were explored. Semenov proposed a series of chemical reactions for a simplified two component fuel known as primary reference fuel (PRF) that when combined result in reproducing the variations
in induction time observed during experimental autoignition testing[21
].
The simplified chemicalmodel consists of five or more coupled differential equations along with temperature dependent rate constants to describe each reaction mechanism. This model was refined and further developed by
researchers at Hartwell Research Laboratory[15
I
and Shell[2 6, 53] and shown to agree reasonably wellwith experimental autoignition data. The primary difficulty encountered in applying autoignition models of this type has been the chemical complexity of realistic fuels. Gasoline, which generally contains hundreds of chemical compounds, behaves somewhat differently than PRF blends and it has been observed that if models based on a representative set of reaction equations are to be used in engines it is often necessary to modify rate and temperature constants to obtain agreement between the model and experimental testing. This presents some difficulty due to the number of rate and temperature constants involved. For this reason much of the autoignition modeling performed on engines uses simpler empirical models.
Experimental evidence has shown that many of the features of autoignition can be modeled using
the Livengood-Wu autoignition integral[441. This empirical approach suggests that autoignition is a
cumulative chemical process that depends on the temperature and pressure history of the unburned gases and the properties of the air-fuel mixture. When an air-fuel mixture is compressed rapidly and held at high pressure and temperature the time between compression and autoignition is often called the ignition delay. If the compression process and experimental apparatus are well controlled
the temperature and pressure during the ignition delay - which is sometimes called the induction
period - are nearly constant. Therefore if to is defined as the end of compression and t, is defined
as the time of autoignition the ignition delay (r) is given by
T(p, T) = t, - to, (1.1)
where
p
and T are the constant post compression pressure and temperature of the end gasrespec-tively. Livengood and Wu observe that if such testing is performed over a wide range of
P
andT values the ignition delay function for a specific air-fuel mixture may be approximated by an
expression with the form
where a, b and c are air-fuel mixture dependent constants. In a real firing engine, unlike the specially designed machines for measuring the ignition delay, the pressure and temperature of the end gas changes smoothly as a function of time. To apply ignition delay measurements to real engines Livengood and Wu suggest that autoignition will occur when the concentration of a hypothetical knock precursor [x] reaches a critical level [x],. If the reaction that produces the knock precursor is independent of the precursor concentration the relative concentration at time t is given by
[x= dt, (1.3)
[x]c to T(p, T)
where
r
is the empirically determined ignition delay function. If the critical concentration is constantacross various operating conditions then autoignition will occur at time t, where
1 1
dt.
(1.4)
to r(p, T)
If Eq. 1.4 is used in a firing engine to is selected as any time at which the ignition delay is very large, generally a time around intake valve closing (IVC) is used. Alternatively if the conditions of
the empirical ignition delay testing are used in which p(t) = p and T(t) T the measured induction
duration t, - to is recovered.
The empirical method developed by Livengood and Wu has been widely used since its introduc-tion and many researchers have contributed to the development of igniintroduc-tion delay funcintroduc-tions for use with different fuels and mixtures. Some of the best known work in this area was done by Douaud
and Eyzat of the Institut Frangais du Petrole (IFP)[17 25]. In their work, which was based on both
testing in CFR research engines and real vehicles, they identified an ignition delay expression that works for several blends of PRF
, ON 3.4017-1730
TDE (p, T) = 0.01869 1 p e
r
[s], (1.5)where ON is a volume fraction of isooctane blended with n-heptane between 80% and 100%, p is
a pressure in kgf cm-2 and T is a temperature in K. Douaud and Eyzat also observed that the
sensitivity - that is the research octane number (RON) minus the motor octane number (MON)
-of a fuel appears to affect the numerator -of the exponential term which governs the temperature dependence of the ignition delay. The units of the Douaud-Eyzat correlation may be converted to the more frequently used pressure units of bar which yields
DE (p, ) = 0.01932 4017 .7 3 8 [s- (1.6)
either a rapid compression machine (RCM), combustion bomb or shock tube[2 2 39, 31, 57, 121. Several
ignition delay expressions have been proposed that include air-fuel ratio effects for simple fuels such as isooctane which has been reported to collapse well over a limited range of pressures and
temperatures using the expression[281
10-4p- 10077 -1. 41 33700
7ro(p, T) = 1.3 x 10⁻⁴p 1 0 5 0- . 02 - e RT ms], (1.7)17
where p is the pressure in atm, T is the temperature in K,
#
is the fuel-air equivalence ratio, x.2is molar percentage of oxygen and R = 1.987cal mol-1 K- 1 is the gas constant. Converting the
pressure units to bar, assuming stoichiometric operation with no excess oxygen and substituting the value of the gas constant provides the simplified equation
1.05 16960
-rio(p,T) = 1.79 x 10⁻⁹p- e T [s], (1.8)
which has a temperature sensitivity more than four times higher than the Douaud-Eyzat correlation for isooctane (ON = 100). Comparing these two ignition delay correlations over the pressure and temperature map reveals the extent to which temperature dominates the predicted ignition delay of Eq. 1.8 in comparison to Eq. 1.6 (cf. Figure 1-3). One of the key difficulties of implementing these or any other ignition delay approximation in an engine originates from the large range of pressures and temperatures experienced by the end gas in the time leading up to autoignition. If a set of representative pressures and temperatures traversed prior to autoignition are indicated on the p-T diagram they will fall very close to a straight line representing the adiabatic and isentropic compression of the end gas. An examination of the percentage difference between the predicted ignition delays of Eq. 1.8 and Eq. 1.6 indicates that these expressions only agree to within +50 % of the ignition delay value over a relatively narrow range of temperatures, a characteristic that suggests
that the application of one of these expressions to engines may provide inaccurate prediction results due to the wide range of temperatures traversed (cf. Figure 1-4). Although neither expression can claim to model the ignition delays well over the entirety of the p-T map it is clear that the demands of autoignition prediction in engines present critical choices about the scope over which experimental data is collected and the manner in which this data is fit to a simplified mathematical form.
Autoignition Mitigation Strategies
The most common method of avoiding autoignition during the operation of an engine is to retard (delay) the spark timing, this shifts combustion to a later point in the engine cycle, reducing the peak cylinder pressure, which decreases the amount of adiabatic compression experienced by the end gas, thereby reducing the maximum end gas temperatures. Altering the spark timing in this way
E-4 CO 1 100-1000 900 800--700 600 500 10 20 30 40 50 70 100 Pressure, p [bar]
Figure 1-3: The ignition delays predicted by Eq. 1.8 and Eq. 1.6 differ in their sensitivity to temperature with Eq. 1.8 exhibiting considerably stronger temperature dependence.
1100 1000 $8 08 HO 800-700 600 500 10
Region of Douaud Study
Region of He Study --- 506 .050o - l ,,es -,4a~'t Xe - -(p, T) at autoignition 20 30 40 50 representative 70 100 Pressure, p [bar]
Figure 1-4: The percentage difference between ignition delays predicted by Eq. 1.8 and Eq. 1.6 is shown. As indicated the range within which these expressions agree to +10 % is limited to a very narrow temperature band. The region of the pressure and temperature map studied by He et. al. provides some potential insight into the reason for the observed differences. The best fit form of the ignition delay function depends strongly on the region of the p-T map over which the fit is computed. The fit used by Douaud and Eyzat relied heavily on testing in CFR research engines which cause the end gas to reach higher pressures prior to
autoignition.
is an effective method of avoiding knock because it simultaneously reduces the end gas pressures and temperatures which, according to the knock integral and ignition delay models, are the driving factors behind the autoignition process. However, retarding the spark timing is detrimental to engine efficiency because the phasing of combustion is shifted to a less favorable geometric configuration of
.0
Doaul Eza
the piston-crank mechanism, reducing the ability of the engine to extract work. As a result of less efficient work extraction, retarding the spark timing increases the exhaust gas temperature, which may reach levels that are potentially damaging to downstream components such as the turbine and catalyst. Under some conditions modern engines inject excess fuel to aid in the cooling and protection of these critical components at the expense of fuel efficiency.
A method of avoiding autoignition that has shown experimental promise is the use of exhaust
gas recirculation (EGR)23, 2, 3, 4 32, 1]. In an EGR system a portion of the combustion products are
extracted from the exhaust and mixed with fresh air, this mixture is then admitted to the cylinder where fuel is added and subsequently burned. The exhaust gases do not participate chemically in combustion, however they alter the specific heat ratio (y) and the thermal mass of the charge. The increase in charge mass and -y result in an in higher pre-combustion pressures and lower peak
end gas temperatures301, which tends to reduce the tendency of the end gases to autoignite. To
enhance this effect the EGR flow is often cooled before it is mixed with fresh air, this configuration is known as cooled EGR. EGR systems are further classified by their source and sink locations. In a low-pressure EGR system exhaust is extracted from a location downstream of the turbine and admitted upstream of the compressor, alternatively high-pressure EGR may be extracted upstream of the turbine and admitted downstream of the compressor (cf. Figure 1-5). A final type of EGR that has seen considerable use in recent engine designs is internal EGR, in this approach combustion products from the current cycle are retained within the cylinder for inclusion in the next cycle. Of these configurations cooled low-pressure EGR is preferred for knock abatement because internal EGR cannot be cooled and at lower engine speeds (where knock is most prevalent) there is insufficient
pressure differential to drive high-pressure EGR flow[12].
Exhaust Out <
M o
Air In
Figure 1-5: An uncooled high-pressure EGR loop (a), and a cooled low-pressure EGR loop (b) are shown
on a schematic diagram of a turbocharger spark ignition engine.
The change in the pressures and temperatures of the end gas is not the entire story with regard to the effects of EGR on autoignition. It has been observed that the addition of various species including carbon monoxide, hydrogen, water vapor and oxides of nitrogen affect the ignition delay
of automotive fuels[7, 34, 41. And although other diluents such as carbon dioxide do not appear to
chemically participate in autoignition reactions they do reduce the molar concentration of critical
species such as oxygen, resulting in changes in autoignition behavior[281. Attempts have been made
success of these expressions in engines has been somewhat limited. A possible cause of the inaccuracy of these expressions when used in engines is the limited range of pressures and temperatures over
which the ignition delay - along with its dependence on charge composition and dilution - has
been explored. Part of the difficulty of expanding the pressure and temperature range of ignition delay testing are the demanding requirements on the experimental apparatus. Due to geometrical and physical limits the range of pressures and temperatures that any individual shock tube, RCM or combustion bomb can explore makes up only a fraction of the region relevant to autoignition prediction in engines.
Recent testing of cooled low-pressure EGR installations has generated several inconsistent
conclu-sions with regard to the effectiveness of EGR as a knock abatement strategy[52, , 4I. In particular
some literature sources report that extracting exhaust gasses from upstream of the catalyst and introducing these gases into the cylinder results in a notable change in autoignition behavior in comparison to extracting exhaust gasses after catalysis. It has been argued that combustible species in the pre-catalyst exhaust may aid the early phases of flame development and reduce the burn
duration, thereby reducing the time available for knock chemistry to occur 52
1
or alter the chemistryof autoignition reactions. However, earlier research has shown that oxides of nitrogen (NO,) which
exist in pre-catalyst exhaust gas, degrade the knock resistance of the air-fuel mixture[3 41. At this
stage the difference between pre-catalyst and post-catalyst sourced exhaust gases is not clear, nor is the cause of the inconsistent findings reported within the literature.
Phenomenological Autoignition Observations
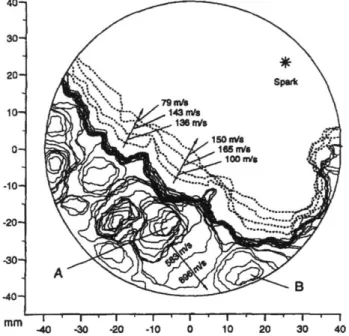
Detailed optical studies of autoignition transients in firing engines date back to the early 1990s after new developments in digital imaging allowed video to be captured at rates in excess of 750,000 frames per second. These new high speed imaging tools were used to examine the development of autoignition using schlieren photography techniques which allow density gradients within the charge to be photographed. Maly of Daimler-Benz AG combined schlieren and laser induced flourescence (LIF) techniques to photograph the spatial and temporal evolution of an end gas autoignition event
(cf. Figure 1-6) [451. This observation illuminated the degree to which inhomogeneity of the end
gas drives the formation of discrete autoignition regions which Maly refers to as exothermic centers (ETCs). The ETCs develop at different times, in various locations and tend to exhibit differences in development following initiation. Maly classifies the modes of autoignition as follows:
* Deflagration - An ETC that develops into a propagating flame similar to the turbulent flame
produced by the spark plug. This type of event produces weak pressure oscillations and occurs when temperature gradients are steep.
* Thermal explosion - The formation of a larger ETC that results in moderate pressure oscil-lations. The ETC often transitions into a deflagration shortly after development. Pressure oscillations due to this type of autoignition are moderate and the temperature gradients that cause it are somewhat flatter than those that result in deflagration.
* Developing detonation - An ETC that results in the pressure driven autoignition of nearby
regions. This type results in the highest pressure oscillation levels and may cause rapid damage to the engine.
Of these three types, thermal explosion, which creates considerable acoustic noise but does not cause serious engine damage appears to be the most common in automotive engines under light to moderate knock. It is worth noting that all three may occur simultaneously during a single cycle.
40- 30-20 10-'- 143 mis 136 WiS 100 ffft -10-'' -30-A -40--40 -30 -20 -10 0 10 20 30 40
Figure 1-6: The spatial and temporal evolution of ETCs is shown in this image produced by Maly which shows the extent of burned regions during the autoignition event. ETCs such as B develop into deflagrations, this is the dominant mode by which the end gas is consumed. Alternatively the center which is marked A proceeds into a developing detonation. The combined effect of the rapid combustion of the end gas forces the main flame produced by the spark plug backward. Reproduced with permission from The Combustion Institute [451
The role of end gas inhomogeneity in the development of autoignition suggests that there is likely a sizeable stochastic component to the occurrence and severity of autoignition under a prevailing
set of steady state conditions[481. This particular aspect of autoignition has largely eluded
docu-mentation within the literature, particularly in spark-ignited engines. Some authors have observed that during steady operation various autoignition intensity metrics indicate that only a fraction
(generally less than 25%) of cycles exhibit the characteristic signs of autoignition43l. If the spark
knock and all possibilities in between are frequently observed. The potential for severe knock and the engine damage that may accompany it mean that the operational limits of the engine are based on the worst autoignition event likely to arise under a given set of conditions. For this reason the statistical factors that govern the occurrence and intensity of autoignition in engines are of particular interest. A reduction in the stochastic tendencies of autoignition can generally be transferred to an improvement in efficiency through more favorable combustion phasing or an increase in compression ratio.
1.3
Research Objectives
The goal of this research project is to deconstruct and quantify the physical and chemical effects of EGR on autoignition. The first task in this endeavor is to identify changes in engine behavior, such as burn duration, pumping work, emissions and stability, that are caused by altering the location of the EGR source from pre- to post-catalyst. This was approached by developing an EGR system that can be reconfigured to draw exhaust from either before or after the catalyst and testing this EGR system across a range of EGR flow rates and operating conditions. An analysis of the changes in engine behavior and autoignition characteristics was performed to develop a clear understanding of their origins. A key question that this research project seeks to answer is: do the chemical differences between pre-catalyst and post-catalyst sourced EGR result in significant changes in combustion or autoignition?
The second component of of this effort is the development of an extended knock integral cor-relation that incorporates changes in EGR rate and air-fuel ratio into a single expression, thereby allowing the onset of knock to be anticipated and its dependence on these controlled parameters to be assessed. In order to produce an accurate correlation with these three interrelated degrees of freedom a conventional approach to determining the ignition delay, which would require hundreds or thousands of time consuming experiments using a RCM or shock tube, was forgone and a method of determining the ignition delay using a real engine and a simplified engine model was developed. Fol-lowing the identification of an empirical ignition delay model the physical and chemical factors that result in cycle-to-cycle variations in autoignition were examined and a model proposed that links engine operating conditions to the intensity of autoignition and the level of variation in intensity that can be expected.
In summary the research objectives consist of the following four items: * Effects of EGR source
- Identify and quantify the effects of the volatile components of recirculated exhaust gases
- Identify and quantify the physical effects of extracting exhaust gasses upstream or down-stream of the catalyst on engine operation
e
Knock onset and intensity correlation- Develop an ignition delay expression that includes EGR and air-fuel ratio and is suitable
for use with engines: r(p, T, A, wegr)
- Develop a statistical model of knock intensity that relates operating conditions to
Chapter 2
Experimental Apparatus and
Procedures
In this chapter the configuration of the engine and experimental system will be outlined, with special care given to the description of the sensing hardware. First, the configuration of the subsystems that make up the engine will be detailed including the air flow path, fuel delivery system, exhaust, EGR system, valvetrain and turbocharger. Following this account the configuration of auxiliary systems such as the dynamometer, cooling system and data acquisition system will be explained. The procedures used during the collection of experimental data will also be described as knowledge of the structure of these procedures is essential to interpretation of the data that is generated by their use.
2.1
Engine
A General Motors Ecotec Generation II engine, identified by the designation LNF, was used to acquire the experimental data presented in this document. The four cylinder, turbocharged, di-rect injected engine was first sold in 2007 and has a displacement volume of just under 2 L. It develops a maximum output power of 190 kW (260 hp) at 5300 rpm and peak torque of 353 N m (260 lb ft) at 2000 rpm. The engine geometry and compression ratio (cf. Table 2.1) are representa-tive of turbocharged and downsized engines and the engine control module (ECM) makes full use of the variable cam phasing and direct injection systems to maximize engine efficiency. In the years that have elapsed since the introduction of the LNF the compression ratio of new, Generation III, engines has risen slightly (the LTG has risen to 9.5) with relatively few changes to overall engine ge-ometry or architecture. The changes have resulted in slightly higher maximum power and a modest improvement in fuel economy over the generation II design. Due to the architectural and geometric