Publisher’s version / Version de l'éditeur:
Vous avez des questions? Nous pouvons vous aider. Pour communiquer directement avec un auteur, consultez la première page de la revue dans laquelle son article a été publié afin de trouver ses coordonnées. Si vous n’arrivez Questions? Contact the NRC Publications Archive team at
PublicationsArchive-ArchivesPublications@nrc-cnrc.gc.ca. If you wish to email the authors directly, please see the first page of the publication for their contact information.
https://publications-cnrc.canada.ca/fra/droits
L’accès à ce site Web et l’utilisation de son contenu sont assujettis aux conditions présentées dans le site LISEZ CES CONDITIONS ATTENTIVEMENT AVANT D’UTILISER CE SITE WEB.
Client Report (National Research Council of Canada. Institute for Research in Construction), 2005-05-01
READ THESE TERMS AND CONDITIONS CAREFULLY BEFORE USING THIS WEBSITE.
https://nrc-publications.canada.ca/eng/copyright
NRC Publications Archive Record / Notice des Archives des publications du CNRC :
https://nrc-publications.canada.ca/eng/view/object/?id=e0a1d165-abe5-4aed-89c8-ef27d8d88e28 https://publications-cnrc.canada.ca/fra/voir/objet/?id=e0a1d165-abe5-4aed-89c8-ef27d8d88e28
NRC Publications Archive
Archives des publications du CNRC
For the publisher’s version, please access the DOI link below./ Pour consulter la version de l’éditeur, utilisez le lien DOI ci-dessous.
https://doi.org/10.4224/20377011
Access and use of this website and the material on it are subject to the Terms and Conditions set forth at MIIP Report: Social Cost Considerations for Municipal Infrastructure Management
N a t iona l Re se a rc h Conse il na t iona l Counc il Ca na da de re c he rc he s Ca na da
Client Report
B-5123.8
Municipal Infrastructure Investment Planning (MIIP)
MIIP Report: Social Cost Considerations for Municipal
Infrastructure Management
for
City of Calgary
City of Edmonton
City of Hamilton
City of Ottawa
City of Prince George
City of Regina
Department of National Defence
Regional Municipality of Durham
Regional Municipality of Halton
Regional Municipality of Niagara
May 2005
Municipal Infrastructure Investment Planning (MIIP)
Author
S. Rahman, Ph.D., NSERC Fellow
Author
D.J. Vanier, Ph.D., Project Manager
Author
L. Newton, Ph.D., NSERC Fellow
Quality
Assurance
Y. Kleiner, Ph.D., P.Eng., Group Leader Buried Utilities Group
Approved
D.A. Taylor, Ph.D., P.Eng., Director Urban Infrastructure Rehabilitation
Report No: B-5123.8 Report Date: May 2005 Contract No: B-5123
Program: Urban Infrastructure Program
ii + 20 pages Copy No. 1 of 15 copies
Table of Contents Table of Contents ... i List of Figures... ii List of Tables ... ii 1 Introduction ... 1 2 Background... 3
3 Categorization and Quantification of Social Costs ... 4
3.1 Major Elements of Social Costs ... 4
3.2 Social Cost Categories and Cost Implications... 5
3.2.1 Category I: direct social costs... 5
3.2.2 Category II: indirect social costs ... 6
3.2.3 Category III: intangible social costs ... 6
3.2.4 Summary... 6
3.3 Calculation of Social Costs... 7
3.3.1 Calculation of Category I costs ... 7
3.3.2 Calculation of Category II costs ... 8
3.3.3 Calculation of Category III costs... 11
4 Mitigation of Social Costs... 12
4.1 Reducing the duration of work/off-peak hours work ... 12
4.2 Alternative Rehabilitation Techniques for Infrastructure Projects ... 13
4.2.1 Trenchless Construction Costs ... 13
4.2.2 Trenchless versus Open-Cut ... 14
4.3 Advantages and Disadvantages of Trenchless Technology... 16
5 Discussion... 17
6 Conclusion... 17
7 Acknowledgements... 18
List of Figures
Figure 1. Social costs categories with cost types and examples ... 5
List of Tables Table 1. Social Costs Cataegory and Implications for Payments and Responsibility ... 7
Table 2. Value of Time for Vehicles for Different Jurisdictions in CA$ (Waters II 1992)... 9
Table 3. Vehicle delay costs (after Walls III and Smith 1998)... 10
Table 4. Cost Data for Trenchless Technology in CA$... 13
Table 5. Cost Data for Inspection in CA$... 14
Table 6. Cost Factors for Trenchless and Open-Cut Methods (after Najafi and Kim 2004) ... 14
Table 7. Social Cost Incurrence from Historical Sewer Projects (Peters 1984) ... 15
MIIP Report: Social Cost Considerations for Municipal Infrastructure Management
Saidur Rahman, Ph.D., National Research Council of Canada Dana J. Vanier, Ph.D., National Research Council of Canada Linda A. Newton, Ph.D., National Research Council of Canada
Issued: 2005-05-01
Abstract
The construction, maintenance, repair, rehabilitation and renewal of municipal infrastructure cause considerable disruption and inconvenience, that can not be easily quantified, to a municipality and to the general public. These costs are typically called social costs. There are however, a number of other indirect costs that are incurred by a municipality, by specific individuals, or by society that can also be directly associated to a specific infrastructure project. The objectives of this report are to present an overview of the existing research in this field and to outline the importance of considering, identifying, quantifying and verifying social and indirect costs when selecting which technologies are the most cost-effective for the life cycle of municipal infrastructure. The impact of social costs on life cycle cost analysis, an assessment of social costs and examples from case studies are discussed. The study found that social costs can account for up to 400% of construction costs on certain projects. Thus, it is important to establish a generic social cost protocol that can be used by municipal organization to identify and quantify social costs. This report proposes an itemization and quantification protocol that municipalities can use when making decisions regarding the life cycle management of infrastructure.
1 Introduction
The construction, maintenance, repair, rehabilitation and renewal of municipal infrastructure cause considerable disruption and inconvenience, that can not be easily quantified, to a municipality and to the general public. These costs are typically called social costs. However, there are a number of other indirect costs that are incurred by a municipality, by specific
individuals, or by society that can also be directly associated to a specific infrastructure project. These social and indirect costs are an integral part of the total life cycle cost for any project but are seldom considered in the design considerations, the budget or the final infrastructure project cost. The objectives of this report are to present an overview of the existing research in this field and to outline the importance of considering, identifying, quantifying and verifying social and indirect costs when selecting which technologies are the most cost-effective for the life cycle of municipal infrastructure. This report also proposes an itemization and quantification protocol that municipalities can use to accurately quantify social and indirect costs and use this protocol as a decision criterion for the life cycle management of infrastructure.
This report provides an introduction to social costs related to municipal infrastructure construction, maintenance, repair, rehabilitation and renewal projects. A review of relevant literature and statistics is presented along with a discussion on existing quantification methods. Methods to mitigate social costs and to reduce overall costs for infrastructure construction maintenance, repair and renewal are also proposed. The objective of this report is to stress the importance of considering social costs in the calculation of total construction and maintenance costs of municipal infrastructure projects.
Municipal infrastructure is the backbone of the economic activity of modern urban society. In the last century, rapid urban development in North America and other parts of the world has resulted in a huge investment in the construction of municipal infrastructure. Municipal managers are facing many challenges to maintain, repair and renew this infrastructure in the most cost-effective, efficient and timely fashion. The actual construction or contract cost is not the only expense that must be considered in these deliberations. It is now recognized that non-contractual expenditures and costs incurred by specific public works projects can amount to as much as, if not more than, the original contract value. These non-contractual costs are frequently borne by other departments in an organization, by taxpayers or by society at large.
Costs, either direct or indirect, that are related to an infrastructure project1 and do not form part of the construction contract bid are called social costs. Typical social costs relating to
infrastructure projects may include:
• traffic disruption costs (vehicle wear and tear, time delays, extra safety requirements, etc.) due to road or lane closures;
• cost for the loss of service life of affected assets (roads, utility cuts)
• losses due to business closures or tax reductions (reduced economic activities, loss of parking revenues and decreased incomes);
• cost for reinstatement of public and private property after construction; • long term environmental costs related to health and safety issues; and
Social costs may also include the following additional costs, if they were not included in the contractual agreement:
• legal and administrative charges; • planning and design overhead;
• temporary or permanent loss of, or damage to, public or private property and lives; • cost of emergency (fire fighting, drinking water, electrical services, wastewater disposal,
etc.) or temporary services (toilets, bridges, parking, access, etc.);
Many of these costs can be quantified; however, others are extremely difficult to determine as some expenses may have a degree of “uncertainty” (i.e. involve the probability of a negative outcome or an additional cost). It is necessary to identify and quantify these costs accurately in order to calculate the total infrastructure project cost and the life cycle cost (LCC) of the infrastructure project.
Total LCC includes the direct and indirect costs in the planning and design phase; direct and indirect costs during construction; maintenance and repair costs in the operations phase; and direct and indirect costs during the decommissioning or disposal phase. The total LCC should also include social costs. The calculation of LCC is relatively straightforward (ASTM 1994); however, obtaining figures for social costs is problematic. In particular, it is a difficult task to calculate social costs for municipal projects. It is equally difficult to document these
1
The term “infrastructure project” is used in this report to mean a public works activity related to the maintenance, repair, rehabilitation, renewal or construction of municipal assets.
expenditures post priori, as most municipalities do not have a protocol for quantifying, recording and aggregating social costs.
This report describes the different types of social costs, provides methods for the quantification of long and short-term expenditures, and provides a framework to calculate the certain and uncertain costs and a method to record data for archival purposes. This report also provides background information for a project at NRC’s Centre for Sustainable Infrastructure Research (http://irc.nrc-cnrc.gc.ca/csir/projects/decision_e.html) in the near future. This project will attempt to quantify social costs related to a number of specific infrastructure projects in the province of Saskatchewan.
This report discusses the influence of social costs on LCC decision making for rehabilitation or renewal. Finally, it concludes with a number of findings for quantification of social costs and recommends future research on how to apply new technologies to reduce the social costs of municipal infrastructure construction and renewal.
2 Background
Social costs related to infrastructure projects have been considered in limited application areas for decades. The US Army Corps of Engineers introduced social cost accounting in 1940s for dam and flood control projects (Boyce and Bried 1998). An extensive literature review revealed that research reported so far has been limited to identifying and quantifying the impact of social costs on road works and buried utilities.
An outline of social cost considerations for sewer rehabilitation was first cited by Peters (1984). Peters also identified major categories of social costs for sewer maintenance. Social cost
consideration and estimation methods were also proposed by Boyce and Bried (1994). McKim (1997) also proposed methodologies for estimating social costs and suggested including social costs in the bidding process. The primary social costs that were considered were environmental costs followed by costs due to detours and lost business revenue. Walls III and Smith (1998) reviewed a number of research projects, in a U.S. Federal Highways Administration (FHWA) report, that focused on environmental issues and addressed the costs associated with traffic delays, congestion and vehicle usage.
Economic data are now available from different sources that quantify the annual social costs of infrastructure projects. For example, the annual cost of traffic delays borne by the public in the UK due to utility construction is estimated to be CA 2005$2.3 billion (Goodwin 2005). In big cities, traffic delay costs due to road and buried utilities works are likely even higher because of the higher traffic density. Ontario’s Ministry of Transportation estimates that traffic congestion in the GTA (Greater Toronto Area) costs over CA $2 billion per year (UWU 2004)2. A report from the Texas Transportation Institute, based on traffic congestion for 68 urban areas
(population >100,000), showed that the average person spent 36 hours per year in traffic delays due to open-cut construction in the year 1999. This accounted for 6.8 billion gallons of wasted fuel and 4.5 billion hours of extra travel time for a total cost of US 1999$ 78 billion
(Gangavarapu et al. 2003).
2
In recent years, the construction industry has adopted new innovative approaches for re-instating buried utilities, with a focus on less disruptive, trenchless methods. Ariaratnam et al. (1999) published survey results on the utilization of trenchless methods in Canadian municipalities, while Najafi and Kim (2004) compared the LCC of trenchless and conventional methods for buried infrastructure. European countries, in particular the UK, are implementing other
approaches such as lane rental fees and night work to minimize the social costs associated with road works (Ballance et al 2002).
Despite the mounting evidence that the social costs associated with urban infrastructure projects can be huge, a survey on the use of life cycle cost analysis (LCCA) in municipal projects
conducted by Arditi and Messiha (1999) showed that while 34 out of 49 (69%) municipal respondents use LCCA in their project analysis, only 24% considered the social costs and even less actually used social costs in their LCCA. It is critical therefore, to accurately identify, quantify and estimate social costs so that municipalities will begin to consider them in project and infrastructure LCCA.
3 Categorization and Quantification of Social Costs
3.1 Major Elements of Social Costs
In general economic terms, a social cost can be associated with any economic activity and should include the direct and indirect costs (and inversely, the benefits) to the owner, to related parties, as well to society at large. The harvesting of trees for school furniture, for example, may result in society losing forests and recreational areas, in degrading the air quality, etc; however, this loss cannot be equated only to the price of lumber, it must also take into account the benefits received in the education system. Albeit difficult to quantify, environmental pollution is a common
example of a social cost that can be the result of a new infrastructure project. While new
infrastructure has many long-term benefits, how can the temporary disruption or future pollution costs, for example, be calculated accurately?
To accurately quantify social costs, it is first necessary to identify the possible cost items. Peters (1984) identified main items of social costs for sewers as:
• Delays and diversions to road traffic
• Long term damage to underground services and/or adjacent utilities • Damage to roads and services on temporary diversion routes
• Disruption of local economic activity
• Loss of amenity caused by noise, dirt, and smell
These costs items are also applicable to a wide variety of infrastructure projects. McKim and Kathula (1999) proposed three broad classifications based on monetary implications and social impact. In their first category, costs can be clearly defined and are accountable using general accounting principles. The next level includes costs that can be quantified with less certainty. The final category of costs is difficult to quantify monetarily and generally results from activities that may have a long-term impact on society at large or on individuals.
This MIIP report uses the categorization of social costs as extended from the original work of Peters (1984) and McKim (1999) and groups social costs into three categories that consider who or what organization is impacted by the infrastructure project and what is the time frame of the
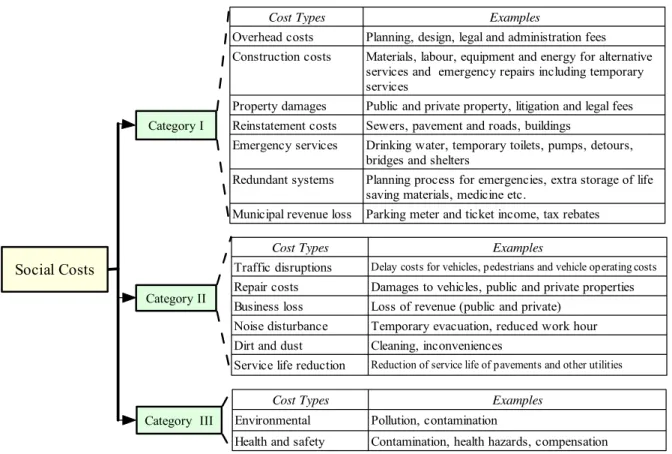
impact, as well as the probability of occurrence (for the design or planning phase of a project). This framework is shown in Figure 1.
• Category I costs are project specific, they occur before or during the construction phase and
they are normally borne by the municipality.
• Category II costs are broadly quantifiable in that they are attributable to a project but the
extent to which they are attributed is an estimation, as extraneous factors could also have contributed to the cost.
• Category III costs are intangible and the most difficult to quantify. They typically occur well
after the project has been completed or can be probabilistic in nature.
Category I
Category II
Category III
Social Costs
Cost Types Examples
Overhead costs Planning, design, legal and administration fees Construction costs Materials, labour, equipment and energy for alternative
services and emergency repairs including temporary services
Property damages Public and private property, litigation and legal fees Reinstatement costs Sewers, pavement and roads, buildings
Emergency services Drinking water, temporary toilets, pumps, detours, bridges and shelters
Redundant systems Planning process for emergencies, extra storage of life saving materials, medicine etc.
Municipal revenue loss Parking meter and ticket income, tax rebates
Cost Types Examples
Traffic disruptions Delay costs for vehicles, pedestrians and vehicle operating costs
Repair costs Damages to vehicles, public and private properties Business loss Loss of revenue (public and private)
Noise disturbance Temporary evacuation, reduced work hour Dirt and dust Cleaning, inconveniences
Service life reduction Reduction of service life of pavements and other utilities
Cost Types Examples
Environmental Pollution, contamination
Health and safety Contamination, health hazards, compensation Figure 1. Social costs categories with cost types and examples
3.2 Social Cost Categories and Cost Implications
3.2.1 Category I: direct social costs
Category I costs can be defined as direct social costs in that they are directly attributable to the project and can be quantified with a certain degree of accuracy. The contractual costs of an infrastructure project involve planning and design costs, construction costs (both material and labour). These costs may also include immediate repair costs for damage of utilities and costs for temporary and emergency services, additional signaling for road works and costs for redundant services. If these latter costs are not included in the contract, they are direct social costs and fall into Category I.
As shown in Figure 1, these costs fall into seven broad areas and include overhead costs associated with the planning, design and administration, construction activities not included in the construction contract; property damage, reinstatement costs, emergency services, redundant systems and loss of municipal revenue. These costs are always borne by the municipality in question (usually immediately), are directly related to the infrastructure project, may directly affect the public and would not have occurred if the project did not take place.
3.2.2 Category II: indirect social costs
Category II costs are hidden costs that cannot be quantified directly and affect the users
indirectly. These costs depend on the work duration, length of the segment, traffic volume of the road and economic activities. These costs include traffic disruption, business loss, noise, etc. The impact of traffic disruption includes the loss of productive labour of the driver and passengers due to travel delays. Traffic disruption can also increase vehicle operating costs (including fuel consumption), cause disturbance for the residents accessing private properties and result in parking inconveniences. Other indirect costs involve the reduction of pavement and surrounding utilities service life, loss of economic activities or business loss. Some of these costs are directly related to the infrastructure project and are eventually borne by the municipality in question, while some are borne by individuals, private/public enterprises and indirectly also affect the tax base. The extent to which they are attributable to a specific project however, is more difficult to determine. As an example, a loss of business in one area or community may have resulted in increased business in another area. Pavement service life is affected by many other factors so how does one quantify what percentage of the reduction can be attributable to the infrastructure project? The key difference between Category I and II costs is the time frame in which they occur and the extent to which they can be attributed to a project.
3.2.3 Category III: intangible social costs
The final category of social costs comprises those costs that are very difficult to quantify and have a probability rather than a certainty of occurrence. These costs are intangible. In many cases it can be impossible to calculate these costs. Category III costs may include long-term environment related costs, noise and dust problems, general public inconveniences and other health related problems. These costs are long term and a specific infrastructure project can be seen as contributing to the overall societal cost, but it may not be the principal reason for the cost.
3.2.4 Summary
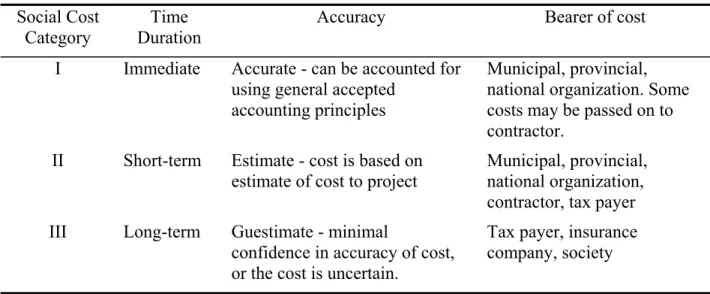
An attempt was made in this report to categorize these social costs and not to dismiss all social costs altogether because some are uncertain or difficult to calculate. It is the intent of this report to provide a technique for calculating the majority of the social costs, fully understanding that not all social costs can be calculated and that not everyone can agree on the calculations. The differences between the three categories of costs can be summarized in terms of the
timeliness of the cost occurrence, the accuracy of the cost and the responsibility for bearing the costs. A comparison of the three categories is presented in Table 1.
Table 1. Social Costs Cataegory and Implications for Payments and Responsibility Social Cost
Category
Time Duration
Accuracy Bearer of cost
I Immediate Accurate - can be accounted for using general accepted
accounting principles
Municipal, provincial, national organization. Some costs may be passed on to contractor.
II Short-term Estimate - cost is based on estimate of cost to project
Municipal, provincial, national organization, contractor, tax payer
III Long-term Guestimate - minimal
confidence in accuracy of cost, or the cost is uncertain.
Tax payer, insurance company, society
3.3 Calculation of Social Costs
As mentioned before, social cost quantification is a difficult task for planners, construction managers and engineers due to the lack of historical data. Local factors such as the population, type of municipality and business activities have a direct impact on social cost estimation. Other costs such as labour costs, material costs and labour/material availability are also important. This section provides an overview of existing methods and estimates currently used to determine social costs.
3.3.1 Calculation of Category I costs
To reiterate, Category I costs are social costs that can be directly attributable to a project. The first six costs described below should normally be included in the contractual agreement. If, for what ever reason, these costs did not form part of the construction contract then they are
Category I social costs. The following is an example of when these costs might be incurred: during a pipe replacement project there is a sudden, unforeseen failure of the existing pipe. This will now require additional work to re-route traffic, repair the damage caused by the failed pipe and possible reparations for property damage.
Overhead costs
The first grouping of costs for which estimates can be obtained from historical data are overhead costs. The industry norm for these costs include design costs, which usually account for 5-6% of the construction costs, and administration and contingency costs, which normally account for 20-25% of the construction costs (R.S. Means 2004). These percentages can be used to estimate Category I overhead costs.
Construction, reinstatement and emergency services costs
These costs can be estimated as “what ifs” and included in the project estimation. After project completion, the actual expenses for this additional work can be quantified. Examples of these costs are given in Figure 1.
Property Damage
The next grouping of costs to be considered is property damage. One such cost is basement flooding that could result from sewer back up due to construction. Estimates of these costs can be obtained from past experience such as the recent flooding in Peterborough, Ontario. This 2004 event resulted in an estimated compensation for flood damage of CA$ 20 million to 40 million. Compensation of $500 per household and $2500 per small business was paid out. In another example, the Canadian Mortgage and Housing Corporation (CMHC) estimated basement flooding costs at an average cost of $3,000 to $5,000 per incident (CMHC 2005).
Redundant systems and temporary services
These costs can also be estimated and included in the project estimation. Redundant systems can also include bypass costs. It must be recognized that some services can be performed “in-kind” or done in concert with other training activities (firefighters providing hoses for water supply). After project completion, it is important to obtain actual expenses for this additional work. Municipal revenue loss
Municipal revenue loss can be determined from historical information and costs. For example, loss of revenue from parking meters and ticketing can be quantified as:
Parking Meter Income = Net Meter Rate x Number of Meters x Operational Hours x % Change of Occupancy x Project Duration
Parking Ticket Income = Net Fine x Number of Tickets x % Change of Ticketing x Project Duration
3.3.2 Calculation of Category II costs Traffic disruption costs
The cost of traffic disruption is perhaps the most researched and quantified of all costs in this category. The amount of disruption and hence, the social costs incurred by roadwork is directly related to the type of work being done. These disruptions may also include vehicular accidents that occur due to the roadworks. A report by Brady et al., (2001) noted that 25% of roadwork projects are responsible for 75% of total social costs. Traffic disruptions have three main components: vehicle operating costs (wear and tear, gas consumption for increasing travel distance); vehicle delay costs (delay time, vehicle types, wages); and pedestrian delay costs. The costs of fuel and time delay are major contributors to the cost of traffic disruptions (Gangavarapu et al. 2003). The lane closure of a road in business hours and the subsequent detour routes have an impact on the cost of fuel used and traffic delay time. In this case, social costs rise in direct proportion to the duration of the construction and occupation of the road lanes. Damage to the vehicle is also an important factor caused by traffic disruptions while vehicle wear and tear affects the operating cost of the vehicle.
Traffic disruption related costs can be quantified as:
Vehicle Operating Costs (VOC) = Time increment x Number of Vehicles x Operating Costs x Project Duration
Delay Costs for Vehicles (DCV) = Time delay x Number of Vehicles x Value Of Time x Project Duration
Delay Costs for Pedestrian (DCP) = Time delay x Number of Pedestrian x Value Of Time x Project Duration
Total Traffic Disruption Cost = VOC + DCV + DCP
The value of time, or VOT, in the delay costs equation is the most controversial of all user cost rates as it depends upon factors such as personal income, nature of the time lost, vehicle type, location and labour cost of that area. The VOT rate per hour refers to the hourly value of work of the person or persons in a vehicle. In general, VOT can be expressed as function of an hourly wage rate multiplied by time of occupancy as:
VOT = ƒ (Average Wage Rate) × Time of Occupancy
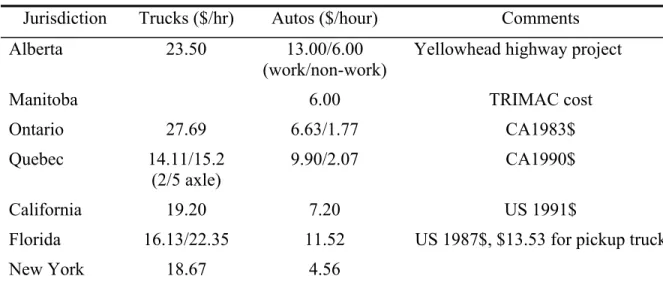
According to Boyce and Bried (1994), VOT is generally calculated by transportation planners as ¼ to ⅓ of the regional mean salary or minimum wages of the location, provided by the labour ministry. For an area with an average hourly wage of $25, the VOT for that area would be $0.10 to $0.14 per minute. A study conducted in the City of Winnipeg showed that commuter travel time values ranged from 20 to 40% of the wage rate for most of income groups of that area (Waters II 1992). Waters II (1992) collected time values for different jurisdictions to compare the costs. The results are found in Table 2.
Table 2. Value of Time for Vehicles for Different Jurisdictions in CA$ (Waters II 1992)
Jurisdiction Trucks ($/hr) Autos ($/hour) Comments
Alberta 23.50 13.00/6.00
(work/non-work)
Yellowhead highway project
Manitoba 6.00 TRIMAC cost
Ontario 27.69 6.63/1.77 CA1983$
Quebec 14.11/15.2
(2/5 axle)
9.90/2.07 CA1990$
California 19.20 7.20 US 1991$
Florida 16.13/22.35 11.52 US 1987$, $13.53 for pickup truck
New York 18.67 4.56
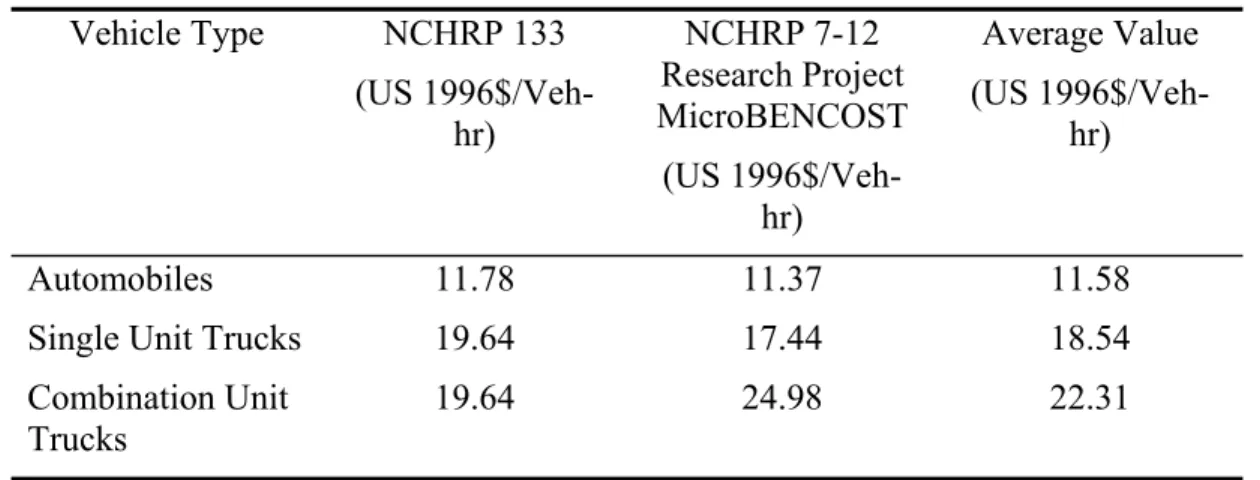
The FHWA has published VOT cost data for various states and types of vehicles. In their FHWA report, Walls III and Smith (1998) recommended using an average of the findings from two other projects, the NCHRP 133 report and the NCHRP Research Project 7-12 MicroBENCOST
Table 3. Vehicle delay costs (after Walls III and Smith 1998) Vehicle Type NCHRP 133 (US 1996$/Veh-hr) NCHRP 7-12 Research Project MicroBENCOST (US 1996$/Veh-hr) Average Value (US 1996$/Veh-hr) Automobiles 11.78 11.37 11.58
Single Unit Trucks 19.64 17.44 18.54
Combination Unit Trucks
19.64 24.98 22.31
Internationally, an American Water Works Association study (AWWARF 2002) defined travel time values as a percentage of the average driver wage rate for commercial purpose and 50% of the wage rate for drivers and passengers for any local trips.
Business loss
Business closures, either temporary or permanent, due to buried utility or road works can have a negative economic impact on the affected area. The duration of works, the location and
accessibility to the street as well as the techniques used for the construction works are important considerations for estimating the amount of business loss.
Actual business losses are very complex to estimate. To make the situation more unpredictable, some tenants may not renew a lease if a major infrastructure project is in the planning stage at their “storefront”. One business’s loss can be another’s gain as revenues are transferred to other stores (hopefully, in the same community) when customers go elsewhere to purchase the same items and services. Although one business may benefit at another’s expense, the net social cost is zero.
The municipality can incur net losses due to business closure as the “losing business” can request a property tax rebate, whereas the “gaining business” does not incur additional taxes if the size of the property does not change. Calculating the property tax revenue losses to a municipality after an infrastructure project has been completed can be estimated by comparing annual property tax revenues for the surrounding area for the years immediately preceding, during and following a project. Federal and provincial income tax implications for municipalities are assumed to be neutral, as one business’s loss of revenue is offset by another’s gain.
Noise disturbance costs
Costs attributable to noise disturbances are typically avoided by following environmental regulations. Noise disturbance costs are associated with activities such as blasting, excavating, drilling, etc. This can incur a cost if extraordinary measures are required to meet regulations and can pose a problem, for some large construction projects. Extra costs can be added if evacuation is necessary for short periods of time. The cost for noise disturbances can be quantified as:
Costs for Noise Disturbance = Time Lost Due to Excessive Noise x Number of Persons x Value of Time x Project Duration
Dirt and dust costs
Dirt and dust problems primarily affect residential and commercial areas and hospitals during construction. Dust and dirt related costs can be quantified as:
Costs for Dust and Dirt Cleaning = Extra Cleaning Time x Hourly Rate x Number of Units Affected x Project Duration
Service life reduction
Service life (SL) reduction costs are incurred when an infrastructure asset is rehabilitated before the end of its service life, or when the service life of an asset is reduced because of a related infrastructure project. As an example, pavements may have to be reconstructed earlier than estimated due to utility cuts made t to perform repairs, rehabilitation or replacement of buried utilities. Major reinstatement of a pavement after an open-cut project can cost up to 70% of the total cost of the project (Najafi and Kim 2004). The cost associated with the SL reduction of an asset can be determined by comparing asset present value (PV):
SL reduction cost = PV of asset (original service life) – PV of asset (reduced service life) 3.3.3 Calculation of Category III costs
As discussed previously, the calculation of Category III costs is very difficult. Caution its therefore, advised when considering the use of these costs in quantifying total social costs. Health and safety costs
Workplace health and safety costs, which quantify the long-term effects of working in hazardous environments such as the mining industry, are well established. In this case, the health effect can directly be attributable to a specific action in a specific environment. This cannot be said for societal health issues resulting from an infrastructure project. How does one ascertain if the deterioration in health of an individual is due to exposure at home, at work, to the local
environment or due to a specific infrastructure project when the effect does not manifest itself for years after the fact?
Health and safety costs are more easily quantified if they result from an incident that can be directly attributable to the infrastructure project. Consider the example where improper signage leads to a vehicular accident in which there are personal injuries. Subsequently, an insurance claim may be filed or a civil law suit arises and damages are awarded to the plaintiff. In this situation, a health and safety cost can be attributed to the project, albeit after the fact. Currently however, there is no compilation of such costs that could be used to estimate potential project health and safety costs of this nature.
Environmental costs
Environmental costs are equally difficult to estimate as the impact of municipal infrastructure may be beneficial to one generation or part of the world but not to another. This can be illustrated by considering the current controversy surrounding reduction of greenhouse gas emissions. The developed world has benefited immensely from the industrial revolution, but dwindling fossil fuels and the thinning of the ozone layer are potentially an environmental social cost that our children and grandchildren will bear. At the same time, it is a cost that developing countries may be willing to bear to enhance the standard of living for their citizens.
Clarkson and Deyes (2002), in their report entitled Estimating the Social Costs of Carbon Emissions, undertook a comprehensive review of previous studies on behalf of the U.K.
Department of Environment, Food and Rural Affairs. The authors found that limited studies have been done but stated that the generally accepted social cost of a tonne of carbon was in the order of US 2000$ 6- $160 per tonne, and that this is believed to be an underestimation. This is a huge range and clearly demonstrates the difficulty in any attempts to quantify environmental costs. To attempt to do so for municipal infrastructure is impossible at this time.
4 Mitigation of Social Costs
Identifying and classifying social costs enables an organization to mitigate these costs and reduce the LCC of the infrastructure. Many methods exist that can be used to mitigate social costs. These methods typically fall into one of four categories:
• Reducing the duration of work; • Timing work for off-peak hours;
• Coordinating with other work in close proximity; and • Using alternative rehabilitation technology
4.1 Reducing the duration of work/off-peak hours work
The United Kingdom’s (UK) New Roads and Street Works Act of 1991 was meant to encourage utilities to choose construction methods that minimize disruption to traffic and communities. As a result of this Act, the government proposed charging utilities a lane rental fee for the
occupation of a highway during construction. Ideally, a lane rental charge should reflect the type of road, the number of lanes affected and the length of repair time (Ballance et al 2002). The intent of the lane rental was to provide an incentive to reduce the amount of time traffic is disrupted.
Reducing the duration of work can be accomplished through technical advancements in materials such as faster curing times and more-efficient soil stabilization techniques. Continuous or
sequential working may also be a solution for some projects; however, there is a cost trade-off for either of these methods. Timing work during off-peak hours can also have considerable social cost savings.
In Ontario, the Ministry of Transportation (MTO) recently replaced a failing 20-year old
corrugated steel pipe culvert on Highway 403 within a 12 hours period overnight (OCPA 2004). The MTO allowed a complete closure of the highway for the removal of existing culvert, the installation of a new one and reinstatement of the road surface within the allotted time.
Traditional construction methods would have required the preparation of detour route, to allow continuous flow of traffic, successive lane closures and an imposed slower speed limit for a period of approximately one-week. The estimated cost of the detour alone was $200,000, which was more than double of the actual overnight replacement cost of $75,000. By expediting construction, the MTO not only saved on the construction costs but also the social costs due to traffic disruption were minimized.
Coordinating work with other potential projects such as replacing buried utilities in conjunction with roadwork or vice versa can reduce social costs. Again, there are cost trade-offs to consider as pavements typically have shorter service lives (approximately 20 years) than buried utilities
(approximately 125 years). A LCCA is essential in this case as the cost of prematurely replacing infrastructure must be less than the potential reduction in social costs for this option to merit consideration.
4.2 Alternative Rehabilitation Techniques for Infrastructure Projects
One of the most common mitigation measures for buried utilities involves the use of trenchless technologies (no-dig and low-dig). These technologies are presented in more detail due to the emergence of this method of construction and the associated reduced social costs. The costs of various technologies are presented to the reader for comparison of costs.
Trenchless methods are gaining in popularity as the technology matures. Trenchless construction and rehabilitation methods include: slip lining, close-fit linings, impact moling and rod pushing, micro-tunneling, pipe bursting, horizontal directional drilling (HDD), and cured-in-place (WRc 2001, Zhao et al 2001). These techniques minimize traffic disruptions and were less labour- and time-intensive compared to conventional open-cut construction methods.
4.2.1 Trenchless Construction Costs
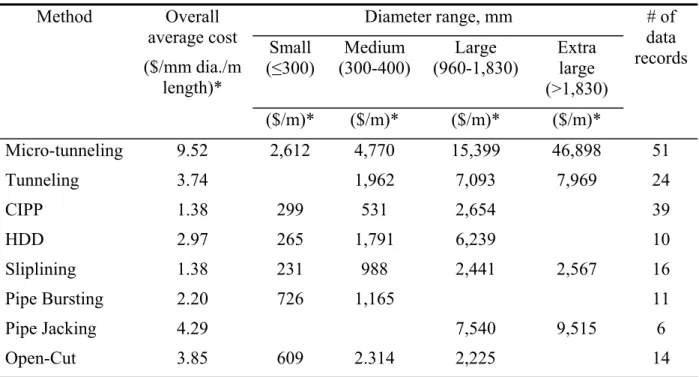
“New” construction costs include direct costs only. Construction costs are readily available from various sources and include costs for materials, equipment, labour and administration fees. Most municipal organizations have their own cost manual for conventional construction methods. Repair and maintenance work involves direct and indirect costs, as temporary provisions may be required to facilitate project implementation. Zhao and Rajani (2002) compiled project costs for eight trenchless and open-cut methods for sewer system rehabilitation from a review of the “Jobs Let” section of Trenchless Technology Magazine. These costs are shown in Table 4. The costs are expressed in constant 2001 dollars per millimeter in diameter per linear meter and also in dollars per linear meter for four diameter ranges.
Table 4. Cost Data for Trenchless Technology in 2001 CA$ (after Zhao and Rajani 2002) Diameter range, mm Small (≤300) (300-400) Medium Large (960-1,830) Extra large (>1,830) Method Overall average cost ($/mm dia./m length)* ($/m)* ($/m)* ($/m)* ($/m)* # of data records Micro-tunneling 9.52 2,612 4,770 15,399 46,898 51 Tunneling 3.74 1,962 7,093 7,969 24 CIPP 1.38 299 531 2,654 39 HDD 2.97 265 1,791 6,239 10 Sliplining 1.38 231 988 2,441 2,567 16 Pipe Bursting 2.20 726 1,165 11 Pipe Jacking 4.29 7,540 9,515 6 Open-Cut 3.85 609 2.314 2,225 14
The specific trenchless rehabilitation method chosen depends upon the condition of the pipe. Condition is established through inspection. Table 5 provides average inspection costs for Canadian municipalities.
Table 5. Cost Data for Inspection in CA$
Methods used Approximate unit cost ($/m)
Zhao and Rajani ($2001) Allouche and Freure ($2002)
CCTV $2.00 - $10.00 $1.75 - $14.00
Sonar $6.00 - $10.00 $6.00 - $10.00
"Person-entry" inspection $2.00 – 20.00 $1.33 - $20.00
Combined CCTV/sonar $7.00 – 10.00 $6.60
Zoom camera $100.00 per manhole $44.25 per manhole
4.2.2 Trenchless versus Open-Cut
Estimating the cost effectiveness of one method over another requires a clear understanding of the various cost factors related to the specific conditions of the project. The project manager should include detailed cost items for direct and indirect costs in the project budget. Generally, open-cut methods take longer to implement and incur higher labour costs. In addition, there may be potentially higher social costs due to disruption and inconvenience. By utilizing trenchless methods, construction companies now have more options to replace pipelines, to conduct minor repairs like sealing and grouting to prevent extraneous flows, to address blockage problems, and to improve the overall pipe performance without the long-term disruption caused by open-cut excavation methods.
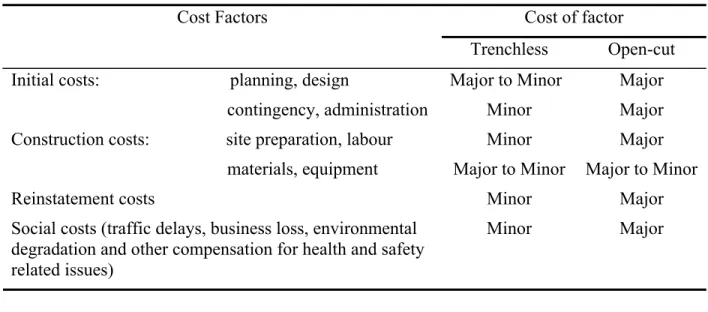
Trenchless technologies can therefore, reduce indirect and social costs and thus reduce the total LCC of a project. Najafi and Kim (2004) investigated cost-effectiveness for trenchless and open-cut methods over the life cycle of buried pipes. A qualitative comparison of the cost factors for trenchless and open-cut methods is summarized in Table 6.
Table 6. Cost Factors for Trenchless and Open-Cut Methods (after Najafi and Kim 2004) Cost of factor Cost Factors
Trenchless Open-cut Initial costs: planning, design
contingency, administration
Major to Minor Minor
Major Major Construction costs: site preparation, labour
materials, equipment
Minor Major to Minor
Major Major to Minor
Reinstatement costs Minor Major
Social costs (traffic delays, business loss, environmental degradation and other compensation for health and safety related issues)
The higher costs associated with open-cut methods result from the need to expose the pipeline in the middle of a busy street in order to allow workers access to the pipe. To accomplish this, the entire street may need to be closed during the construction work. This may not be the case for trenchless methods. While there may be a need for minor excavation, it is localized and much smaller in scale. A comprehensive review of cost data for trenchless and open-cut projects was provided by Zhao and Rajani (2002).
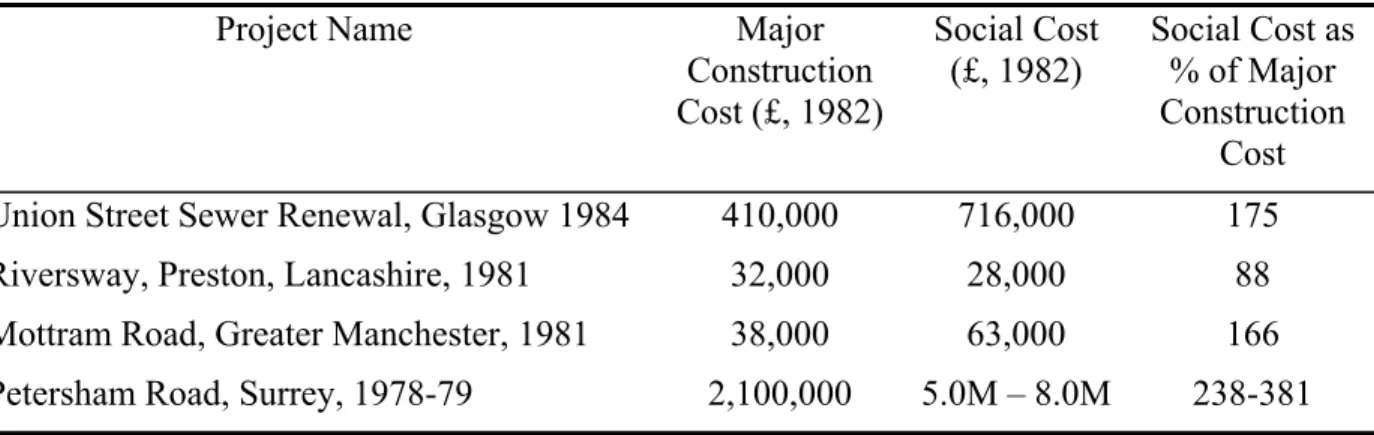
To determine if the additional costs to use trenchless methods are warranted, it is necessary to understand the social costs incurred by traditional construction and rehabilitation methods. Recent studies in the UK have attempted to quantify total project costs including social costs. Table 7 shows findings of a limited study on the social costs incurred by sewer projects in the UK. A very small sampling of data for only four projects shows that project social costs vary from 88% to 381% of actual construction or contractual costs.
Table 7. Social Cost Incurrence from Historical Sewer Projects (Peters 1984)
Project Name Major
Construction Cost (£, 1982) Social Cost (£, 1982) Social Cost as % of Major Construction Cost
Union Street Sewer Renewal, Glasgow 1984 410,000 716,000 175
Riversway, Preston, Lancashire, 1981 32,000 28,000 88
Mottram Road, Greater Manchester, 1981 38,000 63,000 166
Petersham Road, Surrey, 1978-79 2,100,000 5.0M – 8.0M 238-381
Social costs were also estimated for 14 construction projects (10 open-cut and 4 trenchless methods) by McKim (1997). The findings for this small sample indicated that social costs from conventional open-cut methods ranged from 44% to 492% of construction costs, whereas social costs from trenchless methods ranged from 0% to 11% of construction costs. The estimated average social cost as a percent of construction costs is approximately 78% for conventional methods and only 3% of for trenchless methods.
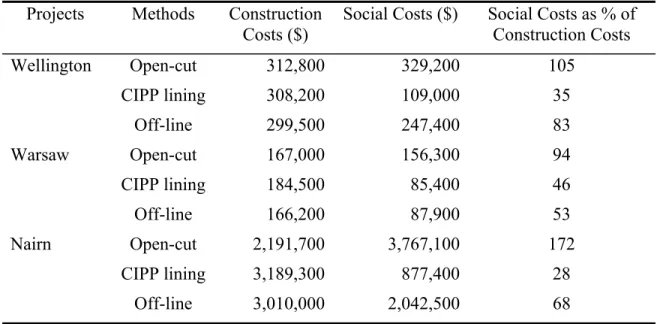
The City of Winnipeg evaluated three typical projects as part of a Sewer Rehabilitation Study (2001). The projects were:
• Full segment repair of a combined sewer of 750mm diameter on Wellington Crescent • Full segment repair of a combined sewer of 300mm diameter on Warsaw Street • Combined sewer repair of 1275 mm x 1050 mm egg shaped cross section on Nairn
Avenue
All three projects were reviewed for three alternative options: off-line construction, open-cut construction and CIPP (cured-in-place product) relining. (Off-line construction uses trenchless methods that require minimum excavation such as pipe bursting or HDD earth boring.) The review examined construction costs and traffic disruption costs for vehicles and pedestrians. The NPV of all costs were calculated considering a 4% discount rate and a value of time of
CA$6.00/hr for disruption. The reported costs of the open-cut and CIPP options were rounded to the nearest $100 for comparison in Table 8.
Table 8. Summary of the NPV of Direct and Indirect Costs in Winnipeg Study in CA$
Projects Methods Construction
Costs ($)
Social Costs ($) Social Costs as % of Construction Costs Open-cut 312,800 329,200 105 CIPP lining 308,200 109,000 35 Wellington Off-line 299,500 247,400 83 Open-cut 167,000 156,300 94 CIPP lining 184,500 85,400 46 Warsaw Off-line 166,200 87,900 53 Open-cut 2,191,700 3,767,100 172 CIPP lining 3,189,300 877,400 28 Nairn Off-line 3,010,000 2,042,500 68
Off-line construction had minimum impact on pavement life and the lowest construction cost for two of the three projects, but it does obstruct traffic; open-cut construction has a more serious impact on the pavement life and also requires road closure or at least lane closures. When all costs were considered, the off-line and open-cut methods were 31% and 54% more expensive than the CIPP method for the Wellington project. Similarly, for the Nairn Avenue project off-line and open-cut methods were 24% and 47% more expensive than CIPP lining. The off-line method however, was the most economical method for the Warsaw project, when compared to the CIPP lining and open-cut methods, respectively being 6% and 27% more expensive than off-line construction methods.
4.3 Advantages and Disadvantages of Trenchless Technology
As discussed, trenchless methods for buried utilities projects are relatively new. The benefits and advantages of using trenchless methods can be summarized as:
• Require substantially less construction work and time than traditional methods;
• Reduce the risk of potential of catastrophic structural failure of the pipeline (Najafi and Kim 2004);
• Reduce or minimize Category I and II social costs by: • Reducing or eliminating the need for pavement cuts; • Reducing traffic disruption;
• Reducing the need for tree removal; and • Reducing noise and dust from construction.
There are however, limitations and additional costs to trenchless methods. They are not completely “excavation free” as there is a need for an insertion pit for pipe bursting and slip lining methods. Several methods require a by-pass or diversion of flow in the pipes. In addition, there are installation problems that need to be monitored such as improper curing or the
clumping of resin in CIPP (EPA 1999). Trenchless technologies can also be more expensive where social costs are minimal. Finally, they should only be performed by qualified contractors, as projects done poorly can be even more disruptive than the open-cut projects.
5 Discussion
It has been shown that social costs can be a substantial component of total project costs. Two factors contribute to the difficulty in quantifying social costs: (1) a general lack of awareness about social costs, and (2) the lack of a standard protocol to classify costs and assess costs. Several studies have drawn attention to the term “social cost” but have only contributed marginally to the understanding of what is involved for roadwork and buried utilities. The No-Dig conferences have hosted discussions on the relevant issues for buried utilities but until municipalities actively collect social cost data and consider social costs in total project costs the progress in this field will be slow.
This review found that there is no common accepted method available for the identification and quantification of social costs. A protocol for classifying social costs by category has been proposed in this report. The protocol categorizes social costs based on the time duration, the level of accuracy of the cost and who ultimately carries the cost. First, one must consider the unambiguous and easily countable costs. These include construction costs arising from emergency repairs, reinstatement costs, municipal revenue loss, etc.
Costs such as those attributable to traffic delays, vehicle repair costs and business loss can also be quantified, but not as accurately. These are called Category II costs. Factors that influence the actual dollar value of these costs include population density, locality (commercial, hospital, residential, rural), utility type, construction methods used, and general public consciousness for legal, environmental and health issues. In addition, the value of time and money (discount and interest rates) are very important factors when estimating delay costs for traffic disruption for different persons and different types of vehicles.
Finally, environmental and health and safety costs cannot easily be quantified and fall into Category III. Consequently, further research is needed to best quantify these social costs, if they are to be considered at all.
Many alternate methods can be used to mitigate social costs. These include the timing of work and the use of alternate technologies. Each viable method should be considered in the project life cycle cost assessment. In addition to costs, the criticality of the project and the risk involved must also be considered. A more detailed review of criticality and risk is outside the scope of this report; however, it is recognized that the best method for selecting the winning alternative is the one that best addresses the conflicting requirements of minimizing total costs (including social costs) and risk.
6 Conclusion
In conclusion, this study has shown that social costs can account for up to 400% of construction costs on certain projects. Despite this, there is presently no generalized method for social cost quantification. In many cases, social costs can be identified and estimated using existing practices. Thus, it is important to establish a generic social cost protocol that can be used by municipal organizations to identify and quantify social costs. Failure to account for the social cost of an infrastructure project in the LCCA of project options may result in poor decisions.
This paper presents a synopsis and an evaluation of findings that can be used by municipalities to calculate the social costs related to infrastructure projects. This study also supports the use of a three-level protocol to itemize social costs as: (1) costs borne indirectly by the municipality, (2) costs borne by citizens and businesses, and (3) costs borne by society at large, as proposed by others. More research is required to determine the actual costs of infrastructure projects, case studies of actual infrastructure projects are suggested as a means of collecting data.
7 Acknowledgements
The authors would like to thank the MIIP Consortium for its support of this research. More specifically, the authors would like to thank the cities of Calgary, Edmonton, Hamilton, Ottawa, Prince George, and Regina, the regional municipalities of Durham, Halton, and Niagara, and the Department of National Defence.
8 References
ASTM (1994) ASTM E917 Standard Practice for Measuring Life-Cycle Costs of Buildings and Building Systems. Philadelphia, PA: American Society for Testing and Materials.
Allouche, E.N. and P. Freure (2002) Management and Maintenance Practices of Storm and Sanitary Sewers in Canadian Municipalities, ICLR Research, Paper Series No. 18.
<www.collection.nlc-bnc.ca/100/200/300/institute_for_catastrophic/iclr_research_paperef/no18/ management_and_maintenance.pdf> (28 October 2003).
Ariaratnam, S.T., J.S. Lueke, and E.N Allouche (1999) Utilization of Trenchless Construction Methods by Canadian Municipalities, Journal of Construction Engineering and Management, ASCE, Vol. 125, No. 2, pp. 76-86.
Arditi, D., and Messiha, H.M. (1999) Life Cycle Cost Analysis (LCCA) in Municipal Organizations, Journal of Infrastructure Systems, ASCE, Vol. 5, No. 1, pp. 1-10.
AWWARF (2002) Cost of Infrastructure Failure, American Water Works Association Research Foundation.
Ballance, T., Reid, S., and Chalmers, L. (2002) Lane Rental Charging A Way Forward, A Revised Final Report for Yorkshire Water Services, Stone & Webster Consultants, Ltd. <www.yorkshirewater.co.uk/pdf/home/rentals.pdf> (10 Jan 2005).
Boyce, G.M. and E.M. Bried (1994) Estimating the Social Cost Savings of Trenchless Techniques, NO-DIG Engineering, pp.2-5.
Boyce, G.M. and E.M. Bried (1998) Social Cost Accounting for Trenchless Projects, North American Conference and Exhibition of Trenchless Technology, NO-DIG 1998, Albuquerque, New Mexico, pp.3-12.
Brady, K.C., Burtwell, M., and Thomson, J.C. (2001) Mitigating the Disruption Caused by Utility Streetworks – Prepared for the Pipe Jacking Association. Transportation Research Laboratory, TRL 516.
Clarkson, R. and Deyes, K. (2002) Estimating the Social Costs of Carbon Emission ,Government Economic Service Working Paper 140, U.K. Department of Environment, Food and Rural
CMHC (2005) Avoiding Basement Flooding, About Your House CE 50, Canadian Mortgage and Housing Corporation, <www.cmhc-schl.gc.ca/en/burema/gesein/abhose/abhose_077.cfm> (11 Apr 2005).
City of Winnipeg (2001) Sewer Management Study – Technical Memoranda for Sewer Condition Assessment, Sewer Rehabilitation Design and Sewer Maintenance Management for the City of Winnipeg, report prepared by UMA Consultants.
EPA (1999) Collection Systems O&M Fact Sheet Trenchless Sewer Rehabilitation, <www.epa.gov/owminet/mtb/rehab.pdf> (10 Jan 2005).
Gangavarapu, B. S., M. Najafi and O. Salem (2003) Quantitative Analysis and Comparison of Traffic Disruption Using Open-Cut and Trenchless Methods of Pipe Installation, New Pipeline Technologies, Security, and Safety: Proceedings of the ASCE International Conference on Pipeline Engineering and Construction, pp.1714-1724.
Goodwin, P. (2005) Utilities’ Street Works and the Cost of Traffic Congestion
<www.transport.uwe.ac.uk/research/projects/njugcongestionreportfinal4goodwin.pdf> (11 Apr 2005).
McKim, R.A. (1997) Bidding Strategies for Conventional and Trenchless Technologies Considering Social Costs, Canadian Journal of Civil Engineering, Vol.24, pp.819-827. McKim, R.A. and V.S. Kathula (1999) Social Costs and Infrastructure Management, Proceedings of INFRA 99 International, Montreal, Canada, 10p, CERIU.
Najafi, M. and Kim, K.O. (2004) Life-Cycle-Cost Comparison of Trenchless and Conventional Open-Cut Pipeline Construction Projects, ASCE, Pipeline Engineering and Construction, Proceedings of the Pipelines 2004 International Conference, Aug 1-4 San Diego, CA.
OCPA (2004) Concrete Pipe Journal, The Ontario Concrete Pipe Association (OCPA), Summer 2004, Burlington, Ontario.
Peters, D.C. (1984) The Social Costs of Sewer Rehabilitation, International Conference on the Planning, Construction, Maintenance & Operation of Sewerage Systems, Reading, England, Paper B3, pp.79-91.
R.S. Means (2004) Means Building Construction Cost Data, R.S. Means Co., Kingston, MA. UWU (2004) The Infrastructure Funding Gap: Time for Innovation, Universal Workers Union, Local 183, Toronto, <www.local183.ca/index.cfm?PID=14321&PIDList=14174,14321> (11 Apr 2005).
Walls III, I., and Smith, M.R. (1998) Life Cycle Cost Analysis in Pavement Design. Publication No. FHWA-SA-98-079, Federal Highway Administration, US Department of Transportation. Waters II, W.G (1992) The Value of Time Savings for the Economic Evaluation of Highway Investments in British Columbia, Centre for Transportation Studies, University of British Columbia.
WRc (2001) Sewerage Rehabilitation Manual, Fourth Edition, Water Research Centre, UK. Zhao, J.Q., S.E. McDonald, and Y. Kleiner (2001) Guidelines for Condition Assessment and Rehabilitation of Large Sewers. Institute for Research in Construction, National Research Council Canada, Ottawa.
Zhao, J.Q., and B. Rajani (2002) Construction and Rehabilitation Costs for Buried Pipe with a Focus on Trenchless Technologies, Research Report No.101, Institute for Research in