HAL Id: hal-03113422
https://hal.archives-ouvertes.fr/hal-03113422v2
Submitted on 20 Jan 2021
HAL is a multi-disciplinary open access
archive for the deposit and dissemination of
sci-entific research documents, whether they are
pub-lished or not. The documents may come from
teaching and research institutions in France or
abroad, or from public or private research centers.
L’archive ouverte pluridisciplinaire HAL, est
destinée au dépôt et à la diffusion de documents
scientifiques de niveau recherche, publiés ou non,
émanant des établissements d’enseignement et de
recherche français ou étrangers, des laboratoires
publics ou privés.
An Agent-Based Model to Predict Pedestrians
Trajectories with an Autonomous Vehicle in Shared
Spaces
Manon Prédhumeau, Lyuba Mancheva, Julie Dugdale, Anne Spalanzani
To cite this version:
Manon Prédhumeau, Lyuba Mancheva, Julie Dugdale, Anne Spalanzani. An Agent-Based Model to
Predict Pedestrians Trajectories with an Autonomous Vehicle in Shared Spaces. AAMAS 2021 - 20th
International Conference on Autonomous Agents and Multiagent Systems, International Foundation
for Autonomous Agents and Multiagent Systems (IFAAMAS), May 2021, Online, France. pp.1-9.
�hal-03113422v2�
An Agent-Based Model to Predict Pedestrians Trajectories with
an Autonomous Vehicle in Shared Spaces
Manon Prédhumeau
Univ. Grenoble Alpes, LIG 38000 Grenoble, France
manon.predhumeau@univ-grenoble-alpes.fr
Lyuba Mancheva
Univ. Grenoble Alpes, LIG 38000 Grenoble, France
lyuba.mancheva@univ-grenoble-alpes.fr
Julie Dugdale
Univ. Grenoble Alpes, LIG 38000 Grenoble, France julie.dugdale@univ-grenoble-alpes.fr
Anne Spalanzani
Univ. Grenoble Alpes, Inria 38000 Grenoble, France
anne.spalanzani@univ-grenoble-alpes.fr
ABSTRACT
This paper addresses modeling and simulating pedestrian trajec-tories when interacting with an autonomous vehicle in a shared space. Pedestrian motion models integrating pedestrians interac-tions with an autonomous vehicle already exist. However, they fail to accurately predict the individual trajectory of each pedestrian, and they do not deal with the diversity of possible pedestrian inter-actions with the vehicle in a shared space (front, back or lateral). Moreover, previous works do not sufficiently provide a quantitative evaluation of the model’s predictions. In this paper, we propose an hybrid pedestrian model that combines the social force model and a new decision model for conflicting pedestrian-vehicle interactions. The proposed model integrates different observed pedestrians be-haviors, as well as the behaviors of the social groups of pedestrians. We validate the model and evaluate its predictive potential through qualitative and quantitative comparisons with ground truth trajec-tories. The proposed model reproduces observed behaviors that have not been replicated by the social force model and outperforms the social force model at predicting pedestrians trajectories on the used dataset. This model will be used by an autonomous vehicle in a shared space to predict the trajectories of surrounding pedestrians.
KEYWORDS
Vehicle-Pedestrian Interaction; Trajectory Prediction; Multi-Agent Simulation; Human behavior; Social Force Model
ACM Reference Format:
Manon Prédhumeau, Lyuba Mancheva, Julie Dugdale, and Anne Spalanzani. 2021. An Agent-Based Model to Predict Pedestrians Trajectories with an Autonomous Vehicle in Shared Spaces. In Proc. of the 20th International Conference on Autonomous Agents and Multiagent Systems (AAMAS 2021), Online, May 3–7, 2021, IFAAMAS, 9 pages.
1
INTRODUCTION
Modeling and simulating the movement of pedestrians around an autonomous vehicle (AV) is of major concern for AV navigation and pedestrian safety in urban environments. Classical approaches are interested in predicting whether a pedestrian will cross the road in front of the AV or not. Predicting pedestrians’ movement
Proc. of the 20th International Conference on Autonomous Agents and Multiagent Systems (AAMAS 2021), U. Endriss, A. Nowé, F. Dignum, A. Lomuscio (eds.), May 3–7, 2021, Online. © 2021 International Foundation for Autonomous Agents and Multiagent Systems (www.ifaamas.org). All rights reserved.
is more complex in a shared space because pedestrians are free to move around in a wider area than just being constrained to a pavement. Shared spaces are a relatively new urban design where the segregation between pedestrians and vehicles is minimized by removing curbs, road surface markings, traffic signs, and traffic lights. Such spaces, which include pedestrians areas, parking lots, as well as streets, crossroads and squares, have been shown to reduce car speed and the number of accidents [14, 16].
In such environments, interactions between pedestrians and an AV may be diverse. Pedestrians may be on a direct collision course with the AV, or may be close, interacting with the AV from the side, front, or rear. From previous studies, pedestrians will act with an AV as they do with a conventional vehicle [5, 23, 29]. In the absence of data with AVs, we observed the different pedestrian behaviors when they encounter a conventional car in shared spaces [15, 32]. In frontal or rear interactions, pedestrians slow down and deviate from their trajectory to avoid the car path and pass alongside it [15, 32]. In a lateral interaction, pedestrians adapt their speed, without deviating from their trajectory; they may accelerate/run to cross in front of the car, slow down/stop to let it pass, or hesitate and step back [9, 15, 32, 35]. Moreover, a pedestrian is rarely alone in a shared space, and interactions with surrounding pedestrians influence his trajectory. Pedestrians moving in social groups remain grouped and avoid the car together [6, 15]. However, if a collision with the car is imminent, a pedestrian in a group will prioritize his individual safety and separate from the group to avoid the car [8]. Several models of pedestrian-car interaction in shared spaces combined the Social Force Model (SFM) by Helbing and Molnár [10] with decision models for conflict resolution.
Anvari et al. were one of the first to develop a model of pedestrian-car interactions in a shared space [2]. The model combined an adap-tation of the SFM with a collision detection and conflict resolution layer via the geometrical "shadow" method. However, in this model the pedestrians always decelerate and deviate when on a collision course with a car. This is not representative of the observed behav-iors and is unsuitable for predicting pedestrian trajectories. Our model overcomes this problem by integrating different observed behaviors.
Other works have developed quite complete models of pedestrian interactions in shared spaces, integrating pedestrians groups, cars, and bicycles, as well as a modeling the urban infrastructure [24, 28]. To model pedestrian-car interactions, these models combined the
classical SFM for short-range conflicts and a decision model for long-range conflicts. However, these models were designed with the aim of assessing the suitability of shared space design compared to a conventional intersection. They do not aim to accurately predict the individual trajectories of pedestrians. Moreover, only lateral interactions were studied. Our work focuses on wider shared spaces, such as large pedestrian squares, where pedestrians will completely share their space with AVs and where interactions will be more varied than simple road crossing.
Models that integrate various interaction scenarios have been proposed by combining SFM and game theory [12, 30]. However, with this approach the computational needs are huge when there is a large number of simulated agents. Being so computationally expensive and slow thus makes this approach unsuitable for an AV to use to predict pedestrian trajectories, which should work in faster than real-time. Our model overcomes the high computational demand and gives accurate results in real-time, and the simulator can be accelerated to run faster than real-time.
Finally, Yang et al. recently proposed a unified SFM to repre-sent a vehicle’s influence on pedestrians in shared spaces [33, 34]. However, the model uses a single calibration for the magnitude and direction forces for all types of interaction (frontal, lateral, rear.) and thus cannot be applied to all cases of interaction [34]. A com-parison between simulated and recorded trajectories shows that simulated pedestrians do not turn enough to avoid the vehicle in a front or rear interaction, and deviate too much from their trajec-tory during a lateral interaction [34]. In addition, this model does not include pedestrian social groups, even though they represent a significant part of most urban crowds, and have a large influence on pedestrian movement. Consequently the approach results in less precise trajectories than with our approach.
A pedestrian reaction model, which integrates the behaviors observed in various cases of interaction with a car in shared spaces, including group behaviors, and which is accurate enough to be used in predicting each pedestrian’s trajectory, is currently missing. To address this gap, this paper provides the following contributions:
• Propose an hybrid model of pedestrians reactions to an AV in a shared space. The model consists of the SFM for distant interactions and a new decision model for conflicting inter-actions. The model includes various observed pedestrians behaviors, as well as social group behaviors.
• Evaluate the predictive ability of the proposed model by qualitative and quantitative comparisons with ground truth trajectories. The results are compared with the SFM and show that the proposed model better reproduces observed pedestrians behaviors.
• Bring additional proof that a general SFM is inadequate to accurately reproduce pedestrians behaviors in all cases of pedestrian-vehicle interactions.
The paper is structured as follows. In section 2, we describe the proposed model for pedestrians reactions. This section first explains the general approach and important model concepts, then details the decision model. Section 3 describes the calibration of the model’s parameters as well as the experimental setup for evaluating the proposed model’s validity. Section 4 presents the simulation results. Section 5 concludes the paper and discusses future work.
2
MODEL OF PEDESTRIANS REACTIONS
2.1
General Approach
To model pedestrians reactions to an AV in shared spaces, we used a microscopic approach where pedestrians are represented as agents with behaviors defined at the individual level. At each simulation time step, the motion behavior of a pedestrian is composed of three steps, as presented in Figure 1.
Figure 1: The hybrid model of pedestrians behavior.
First, the agent perceives its environment. The agent updates its perceptions by considering static obstacles, pedestrians, and the AV in its perception zone.
Then, the agent uses its perceptions to compute its future move-ment. This computation is done with the SFM, a model that uses physical forces to represent the internal pedestrians’ motivations to perform actions. The agents want to move toward their destination, avoiding static obstacles, pedestrians and the AV. If the agent travels in a group, it tries to stay cohesive with other group members.
In the original SFM [10], a "desire" force represents the agent’s desire to move towards its destination. A repulsive force is exerted from static obstacles so that they can be avoided by the pedestrian. A "social" force is exerted from nearby pedestrians, repelling the agent to avoid collisions. For these forces, we use a modified version of the SFM that we previously developed to take into account individuals in open environments, e.g. shared spaces [25].
In shared spaces, pedestrians groups constitute a large part of crowds and therefore their movement in groups should be modeled. The SFM was expanded for group behaviors by adding a cohesive force to keep the group members together, and a gaze force to repro-duce groups members maintaining visual contact with each other [18]. For these group forces, we use a version of the SFM that we previously developed, that integrates four social groups relation-ships: couples, friends, families and coworkers [26]. This version can simulate the different types of groups in various contexts of shared spaces (e.g. business zone, campus, shopping street).
To represent the pedestrians reactions to an AV, two levels of treatment are used. When they interact with a moving obstacle, pedestrians evaluate the time-to-conflict (TTC) (sometimes referred to as the time-to-contact), to know if the interaction will lead to a conflict or not [7]. The TTC is therefore used in our model to distinguish conflicting interactions from non-conflicting ones.
A non-conflicting interaction occurs when the minimal predicted distance (defined in [20] for pedestrians interactions) between the pedestrian and the AV is large enough to be considered as safe or when the conflict occurs in a distant future. For non-conflicting interactions with the AV, the SFM is used. In this case, the repulsive
force similar to the social force used for pedestrian-pedestrian in-teractions comes from the AV and repels the pedestrian, as in [34]. The social force parameters were adapted to represent the AV char-acteristics, as detailed in section 3. This force enables pedestrians to adapt their speed (slowing down or accelerating) and trajectory ahead of time to avoid being close to the AV.
For conflicting interactions, i.e. close approach (or collision) in the near future, a decision model is used. Indeed, in case of future conflict with the AV, pedestrians must take a decision to be sure to avoid the collision. This decision depends on the type of interaction (back, front or lateral) and on the expected crossing order for lateral interaction [7]. The proposed decision model is then based on the interaction angle (back, frontal or lateral) and on the expected crossing order at the conflict point. Depending on these parameters, pedestrians decide to run, stop, step back or turn. The decision model also incorporates a joint decision for groups so that group members avoid the AV together. If a collision is imminent for a pedestrian in a group, an individual decision is taken.
The pedestrian’s decision is then translated into action by modi-fying the forces previously calculated in the SFM. For example, a pedestrian who has decided to stop will get his "desire" force, which initially makes him move towards his goal, changed to an opposite force, which makes him slow down and stop. After all forces have been calculated, the agent computes the sum of all the forces in order to obtain an acceleration.
Finally, the agent acts and updates its walking speed by using the computed acceleration and moves.
2.2
Important Concepts
The decision model uses three key concepts: the 𝑇𝑇𝐶, the interac-tion angle 𝜃 and the expected crossing order at the conflict point.
The 𝑇𝑇𝐶 is the time required for two agents to enter in conflict if they continue on their trajectory at their current speed. In the decision model, we defined 3 conflict zones for pedestrian-AV inter-action, illustrated in Figure 2. A collision zone is delimited by the physical size of the agents: 𝑟𝑎𝑑𝑖𝑢𝑠𝑐𝑜𝑙 𝑙 𝑖𝑠𝑖𝑜𝑛= 𝑟𝑎𝑑𝑖𝑢𝑠𝑝and 𝑟𝑎𝑑𝑖𝑢𝑠𝐴𝑉.
A danger zone, where the agents are very close, is delimited by 𝑟 𝑎𝑑𝑖𝑢𝑠
𝑑 𝑎𝑛𝑔𝑒𝑟. A risk zone, where the agents are at a risky distance,
is delimited by 𝑟𝑎𝑑𝑖𝑢𝑠𝑟 𝑖𝑠𝑘.
Figure 2: The 3 conflict zones in the decision model: collision zone (red), danger zone (orange) and risk zone (yellow). At time t0, the positions of 𝑝 and 𝐴𝑉 appear opaque. 𝑡 seconds
later, 𝑝 will enter the danger zone around 𝐴𝑉 .
A danger conflict will occur in 𝑇𝑇𝐶𝑑 𝑎𝑛𝑔𝑒𝑟 = 𝑡 seconds if the
distance between the pedestrian 𝑝 and the 𝐴𝑉 in 𝑡 seconds is equal
to the danger radius, as shown in Figure 2:
𝑑(𝑝𝑜𝑠𝑝(𝑡 ), 𝑝𝑜𝑠𝐴𝑉(𝑡 )) = 𝑟𝑎𝑑𝑖𝑢𝑠𝑝+ 𝑟𝑎𝑑𝑖𝑢𝑠𝐴𝑉 + 𝑟𝑎𝑑𝑖𝑢𝑠𝑑 𝑎𝑛𝑔𝑒𝑟 (1)
The future positions of 𝑝 and 𝐴𝑉 at time horizon 𝑡 are given by
𝑝𝑜𝑠𝑝(𝑡 ) = 𝑝𝑜𝑠𝑝(𝑡0) + 𝑡 × ® 𝑣 𝑝𝑟 𝑒 𝑓 𝑒𝑟 𝑟 𝑒𝑑 𝑝 and 𝑝𝑜𝑠𝐴𝑉(𝑡 ) = 𝑝𝑜𝑠𝐴𝑉(𝑡0) + 𝑡×𝑣𝑐𝑢𝑟 𝑟 𝑒𝑛𝑡® 𝐴𝑉 .
By computing the discriminantΔ of the quadratic Equation 1, we determine if a danger conflict is possible between 𝑝 and 𝐴𝑉 , and by solving the equation, we find 𝑇𝑇𝐶𝑑 𝑎𝑛𝑔𝑒𝑟. A 𝑇𝑇𝐶 > 0 means
that a conflict will occur between the two agents in 𝑇𝑇𝐶 seconds.
𝑑𝑎𝑛𝑔𝑒𝑟 = (
𝑡 𝑟 𝑢𝑒, ifΔ ≥ 0 𝑓 𝑎𝑙 𝑠𝑒, otherwise
IfΔ = 0, Equation 1 has one solution, equal to 𝑇𝑇𝐶𝑑 𝑎𝑛𝑔𝑒𝑟. The
agents are in danger conflict at a single instant (in 𝑇𝑇𝐶𝑑 𝑎𝑛𝑔𝑒𝑟s),
i.e. the pedestrian touches the danger zone without entering it. If Δ > 0, then Equation 1 has two solutions. The first solution is the instant when the pedestrian enters the danger zone and the second solution is the instant when the pedestrian leaves the danger zone. 𝑇 𝑇 𝐶𝑑 𝑎𝑛𝑔𝑒𝑟is equal to the first solution because we want to know when the pedestrian enters the danger zone.
The same reasoning is done with 𝑟𝑎𝑑𝑖𝑢𝑠𝑟 𝑖𝑠𝑘to find 𝑇𝑇𝐶𝑟 𝑖𝑠𝑘, with
the difference that 𝑇𝑇𝐶𝑟 𝑖𝑠𝑘is equal to the second solution because
we want to know when the pedestrian leaves the risk zone. For pedestrians in a group, the 𝑇𝑇𝐶𝑐𝑜𝑙 𝑙 𝑖𝑠𝑖𝑜𝑛is also computed,
using 𝑟𝑎𝑑𝑖𝑢𝑠𝑐𝑜𝑙 𝑙 𝑖𝑠𝑖𝑜𝑛instead of 𝑟𝑎𝑑𝑖𝑢𝑠𝑝+ 𝑟𝑎𝑑𝑖𝑢𝑠𝐴𝑉+ 𝑟𝑎𝑑𝑖𝑢𝑠𝑑 𝑎𝑛𝑔𝑒𝑟
in Equation 1. This 𝑇𝑇𝐶𝑐𝑜𝑙 𝑙 𝑖𝑠𝑖𝑜𝑛 determines if an individual in a
group is in imminent collision with the AV and needs to separate from his group. 𝑇𝑇𝐶𝑐𝑜𝑙 𝑙 𝑖𝑠𝑖𝑜𝑛is equal to the first solution because
we want to know when the pedestrian will enter in collision. The interaction angle 𝜃 indicates the type of interaction: back, frontal or lateral. 𝜃 denotes the angle in degrees between ®𝑣𝑝and
®
𝑣𝐴𝑉. To classify the interaction, a threshold 𝜙 is used (we arbitrarily
choose 𝜙 = 25° because with an angle too close to 0° we would ignore some frontal cases and with a too large angle (close to 45°), we would consider as frontal interactions that are actually lateral):
𝑖𝑛𝑡 𝑒𝑟 𝑎𝑐𝑡 𝑖𝑜𝑛= 𝑏𝑎𝑐𝑘 , if 𝜃 ∈ [−𝜙; +𝜙] 𝑓 𝑟 𝑜𝑛𝑡 𝑎𝑙 , if 𝜃 ∈ [180 − 𝜙; 180 + 𝜙] 𝑙 𝑎𝑡 𝑒𝑟 𝑎𝑙 , otherwise
The expected crossing order at a conflict point is key information used by pedestrians in order to adapt their trajectory [21]. Pedestri-ans visually perceive obstacles under a given angle i.e. the bearing angle 𝛼 [7]. When interacting with a moving obstacle, the expected order of passage of the pedestrian at the conflict point, i.e, first or second, can be inferred from 𝛼 and its time derivative ¤𝛼[22]:
pedestrian arrive 𝑓 𝑖𝑟 𝑠𝑡 , if 𝑠𝑔𝑛(𝛼) × ¤𝛼 >0 𝑠𝑒𝑐𝑜𝑛𝑑 , if 𝑠𝑔𝑛(𝛼) × ¤𝛼 <0 𝑠𝑖𝑚𝑢𝑙 𝑡 𝑎𝑛𝑒𝑜𝑢𝑠𝑙𝑦, if ¤𝛼=0
However, pedestrians are not perfect. Their perception of the situation may be erroneous or they may act in a way that seems irrational, e.g. speeding to go first when they are expected to pass second. If the crossing order is not clearly defined, pedestrians may hesitate. An hesitation threshold was then added on ¤𝛼(we
arbitrarily choose a threshold of 0.1 rad s−1. This value can be reduced to 0 to eliminate hesitant behavior or can be increased for more erratic behavior.).
When the pedestrian clearly arrives first (𝑠𝑔𝑛(𝛼) × ¤𝛼 > 0.1), he decides to go first. When the pedestrian arrives clearly second (𝑠𝑔𝑛(𝛼) × ¤𝛼 <−0.1), he decides to go second. If the crossing order is unclear, i.e. ¤𝛼∈ [−0.1; 0.1], there is hesitation.
2.3
Decision Model
A flowchart of the decision model is shown in Figure 3.
For individuals, all calculations (𝑇𝑇𝐶𝑑 𝑎𝑛𝑔𝑒𝑟, 𝑇𝑇𝐶𝑟 𝑖𝑠𝑘, 𝜃 , 𝛼 and
¤
𝛼) use the AV’s current position, direction and velocity, and the pedestrian’s current position, direction and preferred walking speed. His preferred speed, rather than his current speed is used because we want to know what would happen if he walked at his ideal speed, without adaptation.
The pedestrian calculates whether he will be in danger in the near future. If so, he examines the type of interaction. If the AV comes from the front or the back, the pedestrian decides to turn sharply. Otherwise (i.e. lateral interaction), the pedestrian estimates the expected crossing order if the AV continues its trajectory and if the pedestrian continues walking at his preferred speed. If he will clearly arrive first at the crossing, he runs in order to arrive earlier and puts some distance between him and the AV at the moment of the crossing. If he will clearly arrive second, he decides to stop. In cases where the crossing order is unclear, there is hesitation. Then, several cases are possible. Either the pedestrian had to come second and decided to stop and is now hesitating; in this case, he steps back to clarify his decision to let the AV pass. Or, the pedestrian was supposed to pass first and was running and momentarily hesitates; in this case, he will keep running. Finally, the pedestrian may also hesitate and has not yet made a decision. In this case, the pedestrian will randomly decide to either run or stop.
After detecting a future conflicting interaction, the pedestrian has made a decision and has left the danger zone, but has not yet left the risk zone. As long as the pedestrian is in the risk zone, he continues to act according to the decision he has made. Thus, he continues to run, stop or step back until he is out of the risk zone. The pedestrian’s decisions are translated into actions as follows. When a pedestrian decides to turn sharply, the social force is re-placed by a force perpendicular to the car direction (to the left or to the right depending on the pedestrian’s relative position). When a pedestrian decides to run, the social force is set to 0 and the desire force is replaced by a force in the pedestrian’s current direction, at running speed. Moreover, the pedestrian is no longer limited by his walking speed, but by his running speed. When a pedestrian de-cides to stop, the social force is set to 0. When conflict is imminent (𝑇𝑇𝐶𝑑 𝑎𝑛𝑔𝑒𝑟 ≤ 1.5s [11]), the pedestrian effectively stops: the desire
force is replaced by a force in the direction opposite to the current direction. When a pedestrian decides to step back, the social force is set to 0 and the desired force’s direction is reversed. The social force is set to 0 because when pedestrians are on a collision course with a vehicle, this interaction prevails over other interactions.
For each pedestrian moving in a group, the 𝑇𝑇𝐶𝑐𝑜𝑙 𝑙 𝑖𝑠𝑖𝑜𝑛is
com-puted. If there is no imminent collision with the AV, the pedestrian takes his group into account. The computations of 𝜃 , 𝛼 and ¤𝛼are
Figure 3: Flowchart of the proposed decision model, with cal-culations in orange, tests leading to decisions in red and ac-tion decided in blue. The two green areas are for groups.
made using the AV’s current position, direction and velocity, and the group’s current center of mass, average direction and average speed. If a collision is imminent, then the pedestrian temporarily
leaves his group and considers his individual safety. For the calcula-tions, he uses his group’s average direction and speed, but uses his individual position instead of the group’s position. In addition, the pedestrian will ignore forces that make the group move together.
With these changes, the calculated interaction angle and cross-ing order will be the same for all pedestrians in a group. Thus, all members of a group will make a joint decision. If hesitating, a pedes-trian in the group follows the decision of the first group member to decide. If hesitating but in an imminent collision situation, he makes an individual decision, regardless of the group’s decision. In addition, all members of a group act jointly. When they decide to turn sharply, all members turn in the same direction, depending on the group’s position. When they decide to run, all members run in the same direction, i.e. in the current average group direction.
3
EXPERIMENT DESIGN
3.1
Calibration
For pedestrian-pedestrian interactions, the SFM and its parameters are the ones used in [25] (based on [17]) for individual pedestrians, and in [26] (based on [18]) for pedestrian groups. Parameter values have been previously calibrated in these works and are kept here. For pedestrian-AV interactions, the SFM is similar to that for indi-vidual pedestrians [25] with some parameters adapted to represent the AV. The adapted parameters and their values for pedestrian-pedestrian and pedestrian-pedestrian-AV interactions are in Table 1.
Table 1: Adapted SFM parameters with their values for pedestrian-pedestrian and pedestrian-AV interactions.
Parameter Value for ped.-ped. Value for ped.-AV interaction [25] [17] interaction
𝛾 0.35 0.2
social force factor 5.1 10.2 perception zone 220° 10m + 220° 10m +
360° 1.5m 360° 3.3m physical size Ellipse Ellipse
body size 1.2 × 2.2 m margins vary with density 2m × 2m × 5m preferred speed 1.34 ± 0.26 m/s 2.5-4.5 m/s
In the SFM, 𝛾 makes the interaction range dependent on the relative speed of the two agents. 𝛾 is lower with the AV than with pedestrians because the AV has a high relative speed compared to pedestrians; a too high 𝛾 would make the pedestrians avoid the AV too early. 𝛾 and the social force factor were calibrated by hand with a visual analysis of the magnitudes of vehicle influence and by comparing the vehicle’s influence to ground truth. The perception zone of pedestrians is extended behind them since pedestrians perceive a vehicle from a greater distance than another pedestrian because of engine noise. The value of 3.3m is approximated from data [32]. The AV’s margins are zones around the vehicle that pedestrians absolutely avoid. The values of 2m at the back, 2m on the sides and 5m at the front are derived from data [32]. The AV’s size and speed are determined from real data and can be modified according to any vehicle. The focus was not on a perfect calibration
of the SFM parameters since calibrating the magnitude and direction forces cannot fit with all of the interaction cases.
The parameters of the proposed decision model are in Table 2. The AV and pedestrians radii are the circles that enclose the physical sizes of the agents. For the other parameters, these values were from the literature or were obtained by trial and error, with a visual inspection of the simulation output over an acceptable range of values. The observed behaviors and model parameters are qualitatively and quantitatively evaluated in sections 4.1 and 4.2.
Table 2: Parameters of the decision model.
Parameter Value 𝑟 𝑎𝑑𝑖𝑢𝑠𝐴𝑉 1.1 m 𝑟 𝑎𝑑𝑖𝑢𝑠𝑝 0.35 m 𝑟 𝑎𝑑𝑖𝑢𝑠 𝑑 𝑎𝑛𝑔𝑒𝑟 0.5 m 𝑟 𝑎𝑑𝑖𝑢𝑠 𝑟 𝑖𝑠𝑘 1.0 m
running speed [2-3] × preferred speed m/s [31]
𝜙 25°
𝑇 𝑇 𝐶𝑑 𝑎𝑛𝑔𝑒𝑟 considered [-1s;+5s] TTC imminent 1.5s [11]
¤
𝛼hesitation threshold [-0.1;0.1] rad s−1
3.2
Experimental Setup
The hybrid model in section 2 was implemented using Pedsim_ros [19], an open source crowd simulator that implements the SFM de-scribed by [25, 26]. All simulations were run both with the SFM and with the hybrid model for comparison. The SFM is used as a refer-ence to show the potential benefits of the hybrid solution. The SFM models pedestrian reactions with a repulsive force, while the pro-posed hybrid model combines a repulsive force for non-conflicting interactions and a decision model for conflicting interactions.
The objective is to predict trajectories for pedestrians interacting with an AV, knowing their initial position, speed, and orientation. However, trajectories cannot be perfectly reproduced (i.e. a zero prediction error), because there is a risk of overfitting. Overfitting occurs when the model is too closely matched to the limited data available and does not account for the variability of behaviors, and therefore cannot be applied to new situations. The model must be able to realistically handle various interaction situations and behaviors in a shared space.
In order to evaluate the realism of the simulated trajectories, we compared them to real trajectories from an open dataset [32]. This dataset includes videos and trajectories of pedestrians and vehicles interacting in several shared space scenarios. The dataset is com-posed of two sub-datasets; the CITR dataset focuses on fundamental scenarios in controlled experiments, and the DUT dataset consists of uncontrolled interactions in a crowded university campus.
We first used the DUT dataset to perform a qualitative evaluation of the simulated pedestrian behaviors. The scenario considered is a lateral interaction between a car and a pedestrian flow, as in the dataset. The simulation has been replicated 20 times in order to smooth out stochastic errors. This qualitative evaluation validates whether the proposed model can reproduce well the variety of pedestrians behaviors observed in the dataset.
We then used the CITR dataset to perform a quantitative evalua-tion of the model. The dataset is composed of 4 interacevalua-tion scenarios between 8 pedestrians and one AV, with 4 instances of each scenario: a front interaction (vehicle arriving in front of pedestrians), a back interaction (vehicle coming from behind pedestrians), an unilateral interaction (vehicle approaching from the right side of pedestrians), and a bilateral interaction (vehicle approaching from the side of pedestrians, with 4 pedestrians facing 4 other pedestrians).
For each of the 4 scenarios and 4 instances, we simulated pedes-trians with the same initial conditions as in the data. In order to have the same rate as in the dataset we set the simulation time step to 0.033s, i.e. 30 frames per second. Simulated agents were placed at positions corresponding to the initial positions in the dataset and given a destination point corresponding to a straight line trajectory from their initial position to the arrival point. The agents were assigned a preferred walking speed following a normal distribution with 𝜇 = 1.34 m/s and 𝜎 = 0.26 m/s [4]. The pedestrians identified as particularly slow in the first data measurement (speed ≤ 1m/s) were assigned a preferred walking speed of 1 m/s. The simulated AV moves in the simulation according to its ground truth trajectory. The model is partially stochastic, that is, the pedestrians’ speeds, body size, and the decision to run, stop or hesitation, are random variables. Therefore, each of the 16 simulation cases was replicated 20 times in order to obtain average results.
This quantitative evaluation allows us 1) to provide a quantified indication of the model’s accuracy for prediction, and 2) to compare the accuracy of the model’s predictions with the predictions from other models, i.e. with the SFM.
4
RESULTS AND DISCUSSION
4.1
Qualitative Evaluation
The ability of the SFM and the proposed model to reproduce various pedestrians behaviors identified in the DUT dataset [32] when interacting laterally with a vehicle are shown in Table 3. A video illustrates the simulated pedestrian behaviors in both models [27].
Table 3: Observed pedestrians behaviors reproduced by the SFM and the proposed model.
Observed behavior SFM Proposed model Accelerate to cross ✓ ✓
Run to cross ✘ ✓
Slow down to let pass ✓ ✓ Stop to let pass (without sliding) ✘ ✓ Hesitate and step back ✓ ✓ Stay in group, without collision ✘ ✓
The proposed model reproduces observed behaviors such as pedestrians running to cross in front of a vehicle, pedestrians stop-ping to wait for a vehicle to pass, and pedestrian group members avoiding a vehicle together without colliding, in addition to the behaviors that were already reproduced by the SFM.
Moreover, the observed trajectories are more accurately repro-duced with the proposed model than with the SFM. In empirical observations, pedestrians in lateral interaction with the car run
to cross, or stop to wait without deviating from their trajectory. Figure 4a shows that pedestrians trajectories remain straight.
With the SFM, some collisions are observed and the agents devi-ate from their trajectories, as shown in Figure 4b. This deviation is caused by the SFM calibration, which was carried out on a mix of several scenarios. As detailed in section 1, the SFM cannot ac-curately reproduce all possible interaction cases. A different set of parameter values, calibrated for each interaction case, is required. With the proposed model, the agents adapt their speed and do not deviate from their trajectory, as shown in Figure 4c.
(a) From data (b) With SFM (c) With our model
Figure 4: Pedestrians trajectories after a lateral interaction with a car (large red line).
With regard to pedestrian groups, empirical observations show that group members stay together during an interaction with a car. With the SFM, group forces make group members stay together, but they collide with the car and/or deviate from their initial trajectory. In case of imminent collision, an agent either follows his group and collides with the car, or separates from his group but still walks very close to the car. In the SFM, the group coherence force can actually counterbalance the repulsive force emitted by the car. A calibration of forces with a different magnitude from individual forces is needed for groups. With the proposed model, group members stay together; they all stop to wait or all run to cross. In case of imminent collision, an agent abandons his group and acts individually to avoid the car. With a decision model, integrated with our adapted SFM, the simulated behaviors are more in line with the observed behaviors.
4.2
Quantitative Evaluation
In order to evaluate the predictive ability of the proposed model, we used measures commonly used in the literature for trajectory prediction [1, 3, 13], for time horizons 1s to 5s. To be able to compare and aggregate prediction errors, the prediction time is limited by the shortest interaction time in the dataset, which was 5s.
For each measure, we computed the prediction error in each simulation for each pedestrian and for each time horizon from 1s to 5s. For each scenario (front, back, unilateral and bilateral) and for each time horizon, we computed the median error and the associated interquartile range (IQR). The median and IQR provide a good way to study the predicted accuracy, because the errors follow a right-skewed distribution. All of the following figures show error measures; smaller values are better. We compared the prediction errors of the proposed model and the SFM with a Mann-Whitney U test to determine if the errors produced by the models differ significantly, i.e. if the model with the lowest error produces a significant improvement in prediction. The Mann-Whitney U test is used because the test does not meet the normality assumption.
The Final Displacement Error (FDE) is the distance between the position in predicted trajectory and the position in ground truth
at the prediction horizon t. The median FDEs with the proposed model and the SFM are shown in Figure 5.
Figure 5: Median final displacement error and interquartile range, with the proposed model (dark lines) and the SFM (light lines), for a prediction time from 1s to 5s and for each interaction scenarios: back (blue), front (red-orange), unilat-eral (green) and bilatunilat-eral (purple-pink).
For the front (red-orange lines), the unilateral (green lines) and the bilateral (purple-pink lines) scenarios, the proposed model pro-duces significantly smaller FDEs than the SFM for prediction times of 4s and 5s; 3s, 4s and 5s; 4s and 5s, respectively (p-values < 0.05). For a 5s prediction, the median FDEs with the proposed model are smaller from 17 cm to 30 cm depending on the scenario. For other prediction times and for the back scenario (blue lines), no significant differences were found in the FDEs with the two models. The Final Linear Velocity Error (FLVE) is the absolute difference between the linear velocity in a predicted trajectory and the linear velocity in ground truth at prediction horizon t. The median FLVEs with the proposed model and the SFM are shown in Figure 6.
Figure 6: Median final linear velocity error and interquar-tile range, with the proposed model (dark lines) and the SFM (light lines), for a prediction time from 1s to 5s and for each interaction scenarios: back (blue), front (red-orange), unilat-eral (green) and bilatunilat-eral (purple-pink).
The FLVE remains constant with an increasing prediction time for the back, front and unilateral scenarios. This indicates that the error is mainly due to the initialization of the walking speed. This is
confirmed by a high FLVE (0.27-0.35 m/s) after only 1s of prediction. We therefore assume that with a more accurate speed initialization, better predictions would be made. The model is generic; simulated pedestrians have a generic preferred walking speed as detailed in section 3.2. However, with more data available, we could observe the first few seconds of data to compute each pedestrian’s preferred speed and use it to initialize the model.
The FLVE increases at 4s and 5s for the bilateral scenario (purple-pink lines), which corresponds to when pedestrians stop or run to avoid the AV. An analysis of the dataset videos show that in bilateral scenarios some pedestrians have more unusual behaviors; running to pass when the car is close or stopping early when they would have had time to pass. More data are needed to study these behaviors since other factors can affect pedestrians’ reactions (e.g. influence of surrounding pedestrians, trust in the AV, etc.).
For the front (red-orange lines) and bilateral (purple-pink lines) scenarios, the proposed model produces significantly smaller FLVEs than the SFM for prediction times of 3s and 4s; and 4s and 5 s, re-spectively (p-values < 0.05). However, the differences in the median FLVEs of the two models are small; from 0.04 m/s to 0.1 m/s. For other prediction times, and for the back and unilateral scenarios, no statistically significant differences were found.
The Final Orientation Error (FOE) is the absolute difference between the pedestrian’s orientation in a predicted trajectory and the orientation in the ground truth at the prediction horizon t. The median FOEs are shown in Figure 7.
Figure 7: Median final orientation error and interquartile range, with the proposed model (dark lines) and the SFM (light lines), for a prediction time from 1s to 5s and for each interaction scenarios: back (blue), front (red-orange), unilat-eral (green) and bilatunilat-eral (purple-pink).
For the back (blue lines), front (red-orange lines), unilateral (green lines) and bilateral (purple-pink lines) scenarios, the pro-posed model produces significantly smaller FOEs than the SFM for prediction times of 4s; 3s; 1s, 2s, 3s 4s; 2s and 3s respectively (p-values < 0.05). For other prediction times, there is no statistically significant differences in the FOE produced with the two models.
For the unilateral interaction (green lines), the FOE with the SFM increases from 8.5° to 15.3° during the interaction, while the FOE remains almost constant with the proposed model (from 7.7° to 8.9°). This confirms the observations in lateral interactions in section 4.1. With the SFM, the simulated pedestrians deviate from their initial
trajectory; which is contrary to what is observed empirically and leads to a higher error. The proposed model produces no deviation during a lateral interaction, which is closer to reality.
A limitation of how prediction errors are measured is that it does not take into account the different possible trajectories for a pedestrian. In some cases, two pedestrians in the exact same situation with the vehicle may take very different decisions. For example, we observed in the dataset that in a lateral interaction, one pedestrian decides to run in front of the car while another pedestrian decides to stop to let the AV pass. In such a case, two very different trajectories may be realistic for a given pedestrian. However, if the real pedestrian stops, the error will be smaller for a simulated trajectory where the agent collides with the car than for a simulated trajectory where the agent runs in front of the car and avoids collision.
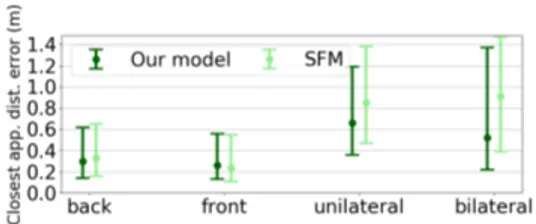
We therefore completed the quantitative evaluation with ad-ditional measures. In each simulation and for each pedestrian, we measured the distance of closest approach between the pedes-trian and the AV, considering the entire interaction (similar to the 𝑀 𝑃 𝐷(𝑡𝑐𝑟𝑜𝑠𝑠) measure for pedestrians interaction [20]). We then computed the error in the distance of closest approach (DCAE), i.e. the absolute difference between the distance of closest approach measured in simulation and the distance of closest approach in ground truth. The DCAE measures the model’s ability to predict the minimum distance kept by each pedestrian around the AV. For each scenario, the median DCAE and the IQR are shown in Figure 8. Again, we used a Mann-Whitney U test to determine if the errors produced by the two models significantly differ.
Figure 8: Median error in distance of closest approach and interquartile range, with the proposed model (dark green) and the SFM (light green), for each interaction scenario.
For the back and front scenarios, both models accurately predict the distance of closest approach of the pedestrians around the vehicle. No statistically significant differences were found in the DCAEs produced with the two models (p-values of 0.36 and 0.38 respectively). For the unilateral and bilateral scenarios, the proposed model (dark green) produces significantly smaller DCAEs than the SFM (p-values of 3.21 × 10⁻⁶and 2.11 × 10⁻⁷respectively).
Finally, we computed the percentage of agents that collided with the AV with both models, in order to check that there are no simulated trajectories leading to a collision. With the SFM some collisions happened; 0% to 5% of the agents collided with the AV, depending on the scenario. The SFM forces sometimes counterbal-ance each other and produce unrealistic behaviors. No collisions are observed in the ground truth data and with the proposed model.
This is coherent with the model implementation; simulated pedes-trians perceive the AV before it reaches the crossing point and they have enough time to avoid the collision.
4.3
Proposed Model Predictions Accuracy
The median prediction errors obtained with the proposed model and the SFM on the available data (all 16 interactions considered) are in Table 4: median FDE, FLVE and FOE on the 5 first seconds, as well as the median DCAE. Mann-Whitney U tests reject the null hypothesis and support the hypothesis that errors produced by the two models (Table 4) differ significantly (p-values <0.01). Table 4: Median prediction errors (± interquartile range) of the proposed model and the SFM. Smallest errors are in bold.
Predicted feature Median error Proposed model SFM Displacement (m) 1.02 ±0.91 1.08 ±0.99 Linear velocity (m/s) 0.28 ±0.33 0.29 ±0.34 Orientation (°) 9.3 ±14 10 ±15.3 Closest approach dist. (m) 0.40 ±0.65 0.53 ±0.79
Finally, the proposed model requires no more time and resources than the SFM. The simulation runs in real time even with a large number of pedestrians; at 25Hz, a simulation with an AV in a crowd of 100 pedestrians at a density of 0.5 pedestrian/m2 runs in real time on standard PC hardware (Intel Core i7-7920HQ, 4.10GHz). The simulator can be accelerated to run faster than real time and be used for online predictions.
5
CONCLUSION
We proposed an hybrid model for pedestrian reactions to an AV in a shared space. The model combines the SFM with a new decision model, which integrates various observed reactions of pedestrians and pedestrians groups. We implemented the proposed model and performed a qualitative and quantitative evaluation, through com-parisons of the simulated trajectories with ground truth trajectories. We identified some pedestrians behaviors that were not repro-duced accurately by the SFM: running to cross, stopping to wait without deviating, staying in social group to avoid the AV. The proposed model reproduces well these various behaviors. More-over, the proposed model performs better than the SFM for pre-dicting pedestrians’ displacement, linear velocity, orientation, and approach distance around the AV in fundamental interactions.
We are currently conducting a sensitivity analysis and a precise calibration of the decision model’s parameters. Future work will focus on further evaluation, with more diverse scenarios and social groups. The simulator with the proposed model will be used to test AV navigation algorithms within simulated crowds, with AV dynamic adaptation to pedestrians behavior.
ACKNOWLEDGMENTS
This work has been conducted as part of the HIANIC project (Hu-man Inspired Autonomous Navigation In Crowds), funded by the French Ministry of Education and Research and the French National Research Agency (ANR-17-CE22-0010).
REFERENCES
[1] Alexandre Alahi, Kratarth Goel, Vignesh Ramanathan, Alexandre Robicquet, Li Fei-Fei, and Silvio Savarese. 2016. Social LSTM: Human Trajectory Prediction in Crowded Spaces. In Proceedings of 2016 IEEE Conference on Computer Vision and Pattern Recognition (CVPR). IEEE, Las Vegas, NV, USA, 961–971.
[2] Bani Anvari, Michael G.H. Bell, Panagiotis Angeloudis, and Washington Y. Ochieng. 2014. Long-range Collision Avoidance for Shared Space Simulation based on Social Forces. Transportation Research Procedia 2 (2014), 318–326. [3] Huikun Bi, Zhong Fang, Tianlu Mao, Zhaoqi Wang, and Zhigang Deng. 2019. Joint
Prediction for Kinematic Trajectories in Vehicle-Pedestrian-Mixed Scenes. In Proceeding of 2019 IEEE/CVF International Conference on Computer Vision (ICCV). IEEE, Seoul, Korea (South), 10382–10391.
[4] Ernst Bosina and Ulrich Weidmann. 2017. Estimating pedestrian speed using aggregated literature data. Physica A: Statistical Mechanics and its Applications 468 (2017), 1–29.
[5] Michael P. Clamann, Aubert, Miles, and Cummings, Mary. 2017. Evaluation of Vehicle-to-Pedestrian Communication Displays for Autonomous Vehicles. Transportation Research Board 96th Annual Meeting (No. 17-02119) (2017). [6] Rebecca Currano, So Yeon Park, Lawrence Domingo, Jesus Garcia-Mancilla,
Pe-dro C. Santana-Mancilla, Victor M. Gonzalez, and Wendy Ju. 2018. ¡Vamos!: Observations of Pedestrian Interactions with Driverless Cars in Mexico. In Pro-ceedings of the 10th International Conference on Automotive User Interfaces and Interactive Vehicular Applications (AutomotiveUI’18). ACM Press, Toronto, ON, Canada, 210–220.
[7] James E Cutting, Peter M Vishton, and Paul A Braren. 1995. How We Avoid Collisions With Stationary and Moving Obstacles. Psychological Review 102, 4 (1995), 627–651.
[8] Jolyon J. Faria, Stefan Krause, and Jens Krause. 2010. Collective behavior in road crossing pedestrians: the role of social information. Behavioral Ecology 21, 6 (2010), 1236–1242.
[9] Andrea Gorrini, Giuseppe Vizzari, and Stefania Bandini. 2016. Towards Modelling Pedestrian-Vehicle Interactions: Empirical Study on Urban Unsignalized Inter-section. In Proceedings of International Conference on Pedestrian and Evacuation Dynamics (PED2016). Hefei, China.
[10] Dirk Helbing and Péter Molnár. 1995. Social force model for pedestrian dynamics. Physical review. E, Statistical physics, plasmas, fluids, and related interdisciplinary topics 51, 5 (1995), 4282–4286.
[11] Christer Hydén and L. Linderholm. 1987. The development of a method for traffic safety evaluation: The Swedish Traffic-Conflicts Technique. Ph.D. Dissertation. Lund Institute of Technology.
[12] Fatema T. Johora and Jorg P. Muller. 2018. Modeling Interactions of Multimodal Road Users in Shared Spaces. In Proceedings of the 21st International Conference on Intelligent Transportation Systems (ITSC). IEEE, Maui, HI, 3568–3574. [13] Maria Kabtoul, Anne Spalanzani, and Philippe Martinet. 2020. Towards Proactive
Navigation: A Pedestrian-Vehicle Cooperation Based Behavioral Model. In Pro-ceedings of the International Conference on Robotics and Automation (ICRA 2020). Paris, France.
[14] Ioannis Kaparias, Michael G. H. Bell, Weili Dong, Aditya Sastrawinata, Amrit-pal Singh, Xuxi Wang, and Bill Mount. 2013. Analysis of Pedestrian–Vehicle Traffic Conflicts in Street Designs with Elements of Shared Space. Transporta-tion Research Record: Journal of the TransportaTransporta-tion Research Board 2393, 1 (2013), 21–30.
[15] Ruth Madigan, Sina Nordhoff, Charles Fox, Roja Ezzati Amini, Tyron Louw, Marc Wilbrink, Anna Schieben, and Natasha Merat. 2019. Understanding interactions between Automated Road Transport Systems and other road users: A video analysis. Transportation Research Part F: Traffic Psychology and Behaviour 66 (2019), 196–213.
[16] Hans Monderman, Emma Clarke, and Ben Hamilton Baillie. 2006. Shared Space: The alternative approach to calming traffic. Traffic engineering and Control 47, 8 (2006), 290–292.
[17] Mehdi Moussaïd, Dirk Helbing, Simon Garnier, Anders Johansson, Maud Combe, and Guy Theraulaz. 2009. Experimental study of the behavioural mechanisms
underlying self-organization in human crowds. Proceedings of the Royal Society B: Biological Sciences 276, 1668 (2009), 2755–2762.
[18] Mehdi Moussaïd, Niriaska Perozo, Simon Garnier, Dirk Helbing, and Guy Ther-aulaz. 2010. The Walking Behaviour of Pedestrian Social Groups and Its Impact on Crowd Dynamics. PLoS ONE 5, 4 (2010), e10047.
[19] B. Okal, T. Linder, D. Vasquez, S. Wehner, O. Islas, and L. Palmieri. 2014. GitHub repository srl-freiburg/pedsim_ros. https://github.com/srl-freiburg/pedsim_ros. Accessed Sept. 11, 2020.
[20] Anne-Hélène Olivier, Antoine Marin, Armel Crétual, and Julien Pettré. 2012. Minimal predicted distance: A common metric for collision avoidance during pairwise interactions between walkers. Gait and Posture 36, 3 (2012), 399–404. [21] Anne-Hélène Olivier, Antoine Marin, Armel Crétual, Alain Berthoz, and Julien
Pettré. 2013. Collision avoidance between two walkers: Role-dependent strategies. Gait & Posture 38, 4 (2013), 751–756.
[22] Jan Ondˇrej, Julien Pettré, Anne-Hélène Olivier, and Stéphane Donikian. 2010. A Synthetic-Vision Based Steering Approach for Crowd Simulation. ACM Trans-actions on Graphics 29 (2010).
[23] Ana Rodríguez Palmeiro, Sander van der Kint, Luuk Vissers, Haneen Farah, Joost C.F. de Winter, and Marjan Hagenzieker. 2018. Interaction between pedes-trians and automated vehicles: A Wizard of Oz experiment. Transportation Research Part F: Traffic Psychology and Behaviour 58 (Oct. 2018), 1005–1020. [24] Federico Pascucci, Nils Rinke, Chris Schiermeyer, Bernhard Friedrich, and Volker
Berkhahn. 2015. Modeling of Shared Space with Multi-modal Traffic using a Multi-layer Social Force Approach. Transportation Research Procedia 10 (2015), 316–326.
[25] Manon Prédhumeau, Julie Dugdale, and Anne Spalanzani. 2019. Adapting the Social Force Model for Low Density Crowds in Open Environments. In Proceedings of the Social Simulation Conference (SSC19). Mainz, Germany.
[26] Manon Prédhumeau, Julie Dugdale, and Anne Spalanzani. 2020. Modeling and Simulating Pedestrian Social Group Behavior with Heterogeneous Social Re-lationships. In Proceeding of the Spring Simulation Conference (SpringSim’20). Online.
[27] Manon Prédhumeau, Lyuba Mancheva, Julie Dugdale, and Anne Spalanzani. 2021. An Agent-Based Model to Predict Pedestrians Trajectories with an Autonomous Vehicle in Shared Spaces: Video Results. https://doi.org/10.5281/zenodo.4442416 [28] Nils Rinke, Chris Schiermeyer, Federico Pascucci, Volker Berkhahn, and Bernhard Friedrich. 2017. A multi-layer social force approach to model interactions in shared spaces using collision prediction. Transportation Research Procedia 25 (2017), 1249–1267.
[29] Dirk Rothenbucher, Jamy Li, David Sirkin, Brian Mok, and Wendy Ju. 2016. Ghost driver: A field study investigating the interaction between pedestrians and driverless vehicles. In 2016 25th IEEE International Symposium on Robot and Human Interactive Communication (RO-MAN). IEEE, New York, NY, USA, 795–802.
[30] Robert Schönauer. 2017. A Microscopic Traffic Flow Model for Shared Space. Ph.D. Dissertation. Graz University of Technology.
[31] Sunan Huang, Jikuang Yang, and Fredrik Eklund. 2006. Analysis of Car-Pedestrian Impact Scenarios for the Evaluation of a Pedestrian Sensor System Based on Accident Data from Sweden. In Expert Symposium on Accident Research. [32] Dongfang Yang, Linhui Li, Keith Redmill, and Ümit Özgüner. 2019. Top-view
Trajectories: A Pedestrian Dataset of Vehicle-Crowd Interaction from Controlled Experiments and Crowded Campus. In Proceedings of the 30th IEEE Intelligent Vehicles Symposium (IV). Paris, France.
[33] Dongfang Yang, Ümit Özgüner, and Keith Redmill. 2018. Social Force Based Microscopic Modeling of Vehicle-Crowd Interaction. In Proceeding of 2018 IEEE Intelligent Vehicles Symposium (IV). IEEE, Changshu, 1537–1542.
[34] Dongfang Yang, Ümit Özgüner, and Keith Redmill. 2020. A Social Force Based Pedestrian Motion Model Considering Multi-Pedestrian Interaction with a Vehicle. ACM Transactions on Spatial Algorithms and Systems 6, 2 (2020), 1–27. [35] Xiangling Zhuang and Changxu Wu. 2011. Pedestrians’ crossing behaviors and
safety at unmarked roadway in China. Accident Analysis & Prevention 43, 6 (2011), 1927–1936.