Publisher’s version / Version de l'éditeur:
Journal of Applied Physics, 107, 043526, 2010-02-25
READ THESE TERMS AND CONDITIONS CAREFULLY BEFORE USING THIS WEBSITE. https://nrc-publications.canada.ca/eng/copyright
Vous avez des questions? Nous pouvons vous aider. Pour communiquer directement avec un auteur, consultez la première page de la revue dans laquelle son article a été publié afin de trouver ses coordonnées. Si vous n’arrivez pas à les repérer, communiquez avec nous à PublicationsArchive-ArchivesPublications@nrc-cnrc.gc.ca.
Questions? Contact the NRC Publications Archive team at
PublicationsArchive-ArchivesPublications@nrc-cnrc.gc.ca. If you wish to email the authors directly, please see the first page of the publication for their contact information.
NRC Publications Archive
Archives des publications du CNRC
This publication could be one of several versions: author’s original, accepted manuscript or the publisher’s version. / La version de cette publication peut être l’une des suivantes : la version prépublication de l’auteur, la version acceptée du manuscrit ou la version de l’éditeur.
For the publisher’s version, please access the DOI link below./ Pour consulter la version de l’éditeur, utilisez le lien DOI ci-dessous.
https://doi.org/10.1063/1.3309392
Access and use of this website and the material on it are subject to the Terms and Conditions set forth at
Damping Behavior of Bent Fiber NSOM Probes in Water
Taylor, Rod S.; Vobornik, Dusan; Lu, Zhengfang; Chisholm, Roderick A.;
Johnston, Linda J.
https://publications-cnrc.canada.ca/fra/droits
L’accès à ce site Web et l’utilisation de son contenu sont assujettis aux conditions présentées dans le site LISEZ CES CONDITIONS ATTENTIVEMENT AVANT D’UTILISER CE SITE WEB.
NRC Publications Record / Notice d'Archives des publications de CNRC:
https://nrc-publications.canada.ca/eng/view/object/?id=193ca458-f404-4d0c-a56b-dd4df92853c7 https://publications-cnrc.canada.ca/fra/voir/objet/?id=193ca458-f404-4d0c-a56b-dd4df92853c7
Damping behavior of bent fiber NSOM probes in water
Rod S. Taylor,a兲 Dusan Vobornik, Zhengfang Lu, Roderick A. Chisholm, and Linda J. JohnstonSteacie Institute for Molecular Sciences, National Research Council of Canada, Ottawa, Ontario K1A 0R6, Canada
共Received 13 November 2009; accepted 7 January 2010; published online 25 February 2010兲 The damping behavior of bent fiber near-field scanning optical microscopy 共NSOM兲 probes operating in tapping mode oscillation is investigated in air and water. We show that the significant drop in probe quality factor Q, which occurs at the air-water interface, is due to meniscus damping. As the probe is immersed in water viscous damping adds to the meniscus damping. Damping effects which lead to a progressive drop in the peak tapping mode resonance frequency are accounted for by additional torsional modes of probe vibration. Understanding the damping processes should lead to the design of high sensitivity NSOM probes for scanning soft biological samples under liquid. © 2010 American Institute of Physics.关doi:10.1063/1.3309392兴
I. INTRODUCTION
Near-field scanning optical microscopy共NSOM兲 is a hy-brid scanning probe-optical technique used for overcoming the diffraction limit of light for optical imaging, spectros-copy, and high resolution marking of materials.1–3NSOM is most commonly implemented using optical fiber probes with highly tapered tips.4–6One version of these probes is the bent fiber probe designed to operate as a cantilever in standard atomic force microscopes共AFMs兲 which use laser deflection distance regulation to control the probe tip on a surface.7,8 Over the years these probes have been successfully used in photonic9 as well as biological1 applications, primarily for dry samples. However, most biological applications require imaging in an aqueous environment. The bent fiber design described in Refs.7and8 seems to offer an advantage over other cantilevered NSOM probes for imaging in fluids since the distance between the NSOM tip and the bend can be made long enough to keep the horizontal portion of the can-tilever out of the liquid, thereby avoiding serious damping problems. Cantilevered bent fiber probes can also be oper-ated in the tapping mode 共intermittent contact兲 to minimize shear damage to soft biological samples such as supported membranes and live cells.10We have demonstrated that can-tilevered probes can be used to image lipid membranes in an aqueous environment and fixed cells in air, achieving optical resolutions down to 50 nm.11–13The same probe design has been used to achieve an order of magnitude reduction in the excitation area for fluorescence correlation spectroscopy 共FCS兲 measurements on two-dimensional membrane samples.14 Nevertheless, the high spring constant of these probes presents some limitations for routine and rapid scan-ning of a wide range of biological samples in an aqueous environment without damage. These limitations can be ad-dressed by implementation of a low stiffness probe design such as described in Ref. 15. In this paper we provide a detailed characterization of the damping behavior in water of high and low spring constant bent fiber probes.
The presence of a liquid around the probe results in damped tapping mode operation making the probes less sen-sitive down on a surface. Furthermore, damping can also cause a decrease in the cantilever resonance frequency com-pared to that in air.16,17Although some aspects of bent fiber NSOM probe damping have been described previ-ously,15,18–20there is a clear need for a thorough study of the damping behavior. The experimental results provided here show the dramatic damping of bent fiber probes as they enter an air-water interface. Although the nature of this damping mechanism has not been investigated for bent fiber probes, one recent paper described the damping behavior of constant diameter nanoneedle probes共diameters⬍ 400 nm兲 at an air-liquid interface.21 It was suggested that the damping at the interface was due to a surface drag or “squeeze damping” force of the meniscus on the side walls of the probe caused by the large shear rates across the thin meniscus channel. The authors constructed a model for meniscus damping based on capillary and wetting phenomena described in Ref. 22. In this paper we use their model to successfully describe the damping properties of our much larger共40– 70 m兲 tapping mode oscillation bent fiber NSOM probes at the air-liquid interface.
As the probes are further immersed into the water some added viscous damping occurs together with a progressive decrease in the probe’s peak resonance frequency. In the past, the decrease in resonance frequency has been attributed to the vibrating structure acting as though it had an extra drag mass produced by the pushing of the liquid.23 The de-crease in resonance frequency as the probe is lowered into the liquid is measured and compared to the hydrodynamic model of Kirstein et al.17From the comparison we conclude that these bent fiber probes must undergo complicated wobble or torsional modes of vibration perpendicular to the axis of the vertical portion of the probe to account for the observed frequency shift. The detrimental influence of these new vibration modes on NSOM probe resolution will be de-scribed.
a兲Electronic mail: rod.taylor@nrc-cnrc.gc.ca.
II. EXPERIMENTS
A. Fabrication and characterization of bent fiber NSOM probes
The probes described in this paper have been used to perform NSOM experiments on a combined AFM/NSOM microscope based on a Veeco Instruments Inc. Bioscope mounted on an inverted fluorescence microscope共Zeiss Ax-iovert 100兲 as described previously.24 The probes were bent into the shape of a cantilever to accommodate the standard laser deflection distance regulation of the AFM; this allows the probes to be vibrated in the vertical direction in a tapping or intermittent contact mode of AFM operation. A two step chemical etching process was used to reduce the diameter of the fiber as well as to produce a sharp conical tip. The probes were evaporation coated with approximately 400 nm of alu-minum and then focused ion-beam共FIB兲 milling was used to produce a flat-topped tip with a circular subwavelength op-tical aperture.
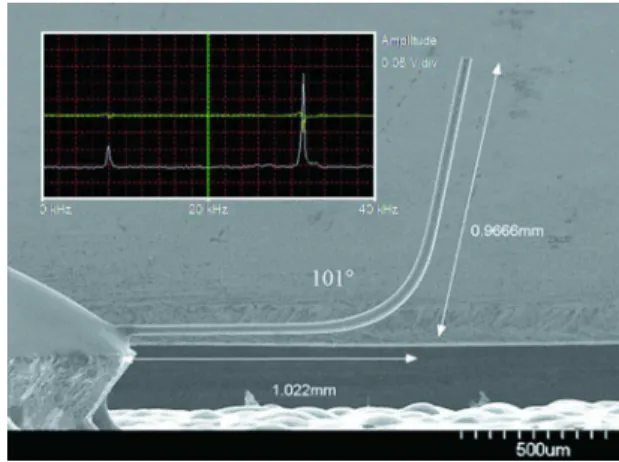
Figure1 shows a scanning electron microscope 共SEM兲 image of a side view of a mounted low spring constant 共k兲 bent NSOM fiber probe. Both low and high spring constant bent fiber probes with physical dimensions indicated in Table Iwere tested in air as well as with the vertical portion of the probe submerged up to 500 m in water. The values of k shown in TableIwere calculated from the cantilever dimen-sions using the formulae provided in the book Scanning Force Microscopy by Sarid25 共Appendix兲. It is possible to
decrease the probe spring constant by increasing the horizon-tal length of the cantilever. However, this length is limited to approximately 1 mm in order to ensure that the diode laser distance regulation beam, which has very little positioning latitude 共i.e., restricted to target ⬇400⫾ 200 m from the beginning of the cantilever兲, is as close to the bend as pos-sible to achieve the maximum tip deflection as measured by a root mean square 具A2典1/2 共rms amplitude兲 voltage on the
Veeco Instruments Inc. Bioscope. Due to this length restric-tion we chose to reduce the radii 共R兲 of the fibers to lower the spring constant since as indicated in Appendix k ⬀ R4. Based on the probe geometries outlined in TableIthere is a predicted ratio of ⫻23 in spring constants between the high and low-k probes.
The cantilever parameters of both the high and low-k probes deviate significantly from that of an ideal cantilever, i.e., a horizontal cylinder fixed at one end with a small con-centrated mass at the other end共see Appendix兲. The consid-erable extended mass past the bend results in a wide discrep-ancy between the calculated 共ideal case兲 and experimental fundamental resonance frequencies as shown in TableI. The calculated values for 0 become closer to the experimental
values when the length of the vertical mass is reduced by a factor of two关i.e., high-k 共cut probe兲兴. Unfortunately it is not straightforward to reduce the length of the vertical portion of the probe for use in our NSOM fluid cell since the length is chosen so that the horizontal portion of the cantilever clears the cell holding the immersed sample. Even if the cell design was modified to have a lower profile we would still need a length of 500– 600 m to accommodate the radiused bend 共Fig.1兲, which permits high light transmission through to the conical tip.24
B. Damping and meniscus measurements
In the damping experiments we used the AFM to moni-tor the peak tapping mode resonance frequency together with the full width at half maximum 共FWHM兲 of the resonance distribution. The AFM’s stepper motor adjusted the fiber height above a water covered glass surface. During water immersion the drive amplitude of the tapping mode piezo-electric crystal was increased to keep the rms voltage ap-proximately constant共at approximately 0.3 V兲 and at a level which gave good signal to noise in the distance regulation feedback loop. The drive amplitudes were then used to nor-malize the rms voltages to generate plots of rms voltage ver-sus probe submersion height.
All NSOM damping experiments were conducted in a home-made wet-cell designed to maintain a constant depth of water over long periods of time 共i.e., several hours or longer if needed兲. The wet cell consists of two parts: the bottom part is the sample glass substrate and the top part is a commercially available bio-well cover 共HydriWell, HBW20 Grace Bio-laboratories兲 that provides a several hundred mi-crometers thick space between the sample and the top cover. Two small holes共2 mm diameter兲 were punched in the top cover. One hole was used to allow the NSOM probe access to the sample and the other as a supply hole to add water. An excess amount of water 共⬃150 l兲 forming a large droplet
FIG. 1. 共Color online兲 SEM sideview image of a bent, upside down, low-k NSOM probe glue mounted onto an AFM stub. The bend angle is 180° −101° = 79°. The stub is mounted in the AFM at 11° making the probe tip normal to the sample surface. Inset shows a typical cantilever tuning curve in air indicating the fundamental 共0= 8 kHz兲 and first higher 共1
= 31 kHz兲 resonances.
TABLE I. Cantilever dimensions and fundamental resonance properties in air共calculations made in Appendix兲.
High-k High-k共cut兲 Low-k
Horizontal length 0.82 mm 0.82 mm 1.02 mm Vertical length 1.35 mm 0.675 mm 0.97 mm Probe radius 35.5 m 35.5 m 19 m Calculated k 494 N/m 494 N/m 22 N/m Calculated0 30.5 kHz 40.6 kHz 13.6 kHz Experimental0 13⫾ 1.3 kHz 24.7⫾ 1 kHz 8 ⫾ 1 kHz
was always placed on the supply hole and in this way any evaporation of water during the experiment was compen-sated by the water in the droplet. We ensured that the water level was maintained over several hours by adding every hour or so 共depending on the humidity level in the room兲 ⬃50 l of water to the supply droplet. The height of the water above the glass surface was very reproducible over time共500⫾ 25 m兲 and with different wet cells.
The experimental set-up for independent meniscus mea-surements of the metalized NSOM probes is as follows. A water cell similar to the NSOM sample cell is used for the measurement. It has a 2 mm hole as a liquid source for the meniscus measurement and another 1.5 mm hole for the wa-ter supply. With a single drop of wawa-ter added on the supply hole, the level of the liquid source was kept unchanged over the duration of the experiment. A ninety times stereo micro-scope with installed micrometer scales and a 360° protractor was used to observe and measure the height共h兲 and the con-tact angle 共兲 of the meniscus, respectively. The contact angle is defined as the angle at the contact line between the air-liquid interface and vertical. Meniscus height is defined as the equilibrium height of the meniscus relative to the pla-nar surface of the liquid. A three-dimensional stage held the bent fiber NSOM probe and moved the probe to the center position of the liquid source as checked by two perpendicu-larly positioned microscopes. The microscope micrometer scales were calibrated by measuring the thickness of an op-tical fiber with known diameter 共125 m兲. Millipore fil-trated water was used through all the measurements to ensure the same experimental conditions to the damping experi-ments.
III. RESULTS AND DISCUSSION
A. Damping behavior of bent fiber tapping mode oscillation in water
1. Probe quality factor Q
The damping of cantilever oscillation in ideal incom-pressible fluids is generally characterized by measuring the probe quality factor 共Q兲 defined as the quotient of the peak resonance frequency and the FWHM of the resonance curve 共i.e., Q =/⌬FWHM兲. The value of Q changes dramatically depending on the medium in which the cantilever or part of the cantilever is immersed, e.g., Q decreases as damping in-creases going from vacuum to air to liquid.26It is also deter-mined by the way the fixed end of the cantilever is connected to an AFM stub. Since this is usually accomplished using a glue the damping properties of the glue 共stiffness兲 are very important. We have found that good values of Q 关approxi-mately 300 in air 共1 mode兲兴 can be obtained using Loctite
E-30CL epoxy. We have also observed that higher Q’s共⫻2兲 can be obtained by operating at the resonance frequency cor-responding to the second normal mode 共1兲 of vibration
rather than at the fundamental mode 共0兲 共Appendix兲. We
hypothesize that this is related to the significant deviation in the bent probe from an ideal cantilever which may favor more efficient oscillation at1. Observation of higher Q’s at
higher eigenfrequencies has also been made in Refs.27and 28.
When the last 500 m of the vertical component of the probes are immersed in water the Q-values drop significantly to approximately 35 for the high-k probes and to approxi-mately 13 共2.7 times lower兲 for the low-k probes. The inter-action force 共Finter兲 that a probe tip exerts on a sample
sur-face for a given tip-sample interaction amplitude ⌬x共based upon cantilever AFM force measurements ⌬x is taken as approximately 10 nm兲 depends on the probe Q through29
Finter= k⌬x/Q. 共1兲
According to this formula the lower value of Q for the low-k probe unfortunately tends to undermine achieving a much lower interaction force provided by the reduction in spring constants, i.e., the ⫻23 drop in k is offset by the ⫻2.7 de-crease in Q resulting in an overall ⫻8.3 reduction in the predicted interaction force. The magnitude of the probe-surface interaction force is estimated from Eq. 共1兲 to be 17 nN for the low-k probe.
2. Probe damping in water
As the metalized probe tip first makes contact with the water a meniscus rises up from the surface to attach itself to the end of the fiber. Both the Q and the tapping mode rms voltage drop suddenly as shown in Fig.2共a兲for the funda-mental mode and Fig. 2共b兲 for the first higher vibrational mode of a low-k probe. Most of the change共⫻5兲 in Q occurs over the first 25 m of submersion. As the probe is further immersed into the water the height of this meniscus de-creases to a smaller value which is independent of the probe depth. The Q and rms voltage continue to slowly decrease towards a steady-state value obtained at depths greater than 200 m.
The rms voltage is a direct measure of the cantilever amplitude at the point where the diode distance regulation laser beam hits the top metalized surface while the Q mea-sures the effect of damping on increasing the width of the cantilever’s resonance curve. Both measurements reveal the dramatic increase in damping followed by a progression to a steady-state value which is determined by the viscous damp-ing of the probe oscillation. Similar overlap of the Q and rms curves is obtained when one raises the probe from the sur-face to break through the water-air intersur-face at H⬃500 m. However, in this case as more of the vertical part of the probe emerges from the water it effectively drags a progres-sively larger column of water which adheres to the flat end portion of the probe21 共i.e., hmax⬃ 2 times fiber diameter兲
creating the hysteresis effect shown in Fig.3 for the high-k probe. Figure 3 also shows that the high-k probe exhibits a similar rapid fall-off in Q as the probe is dropped through the air-water interface although as mentioned above the steady-state value for the Q is higher than for the low-k probe.
A similar sudden drop in cantilever Q at an air-liquid interface has been observed using a bent NSOM fiber probe in water15 and a bent tungsten AFM probe immersed into liquid paraffin.20 In both these experiments the probe oscil-lation is parallel to the vertical portion of the probe 共i.e., tapping or intermittent contact mode兲 and laser deflection distance regulation occurs from the top surface of the hori-zontal part of the cantilever. A sudden drop in Q has also
been observed using a vertically mounted fiber which oscil-lates perpendicular to the fiber axis. In this case distance regulation is by means of shear force detection.19In Ref.20 the authors found that the magnitude of the drop in the vi-brational amplitude crossing the air-liquid boundary was qualitatively inversely proportional to the sharpness of the tip. In our case we have a sharp conical tip with a height of only 4 m.24This tip sits on a much larger flat-topped clad-ding region 共shown in Fig. 2兲 of the fiber with a diameter equal to approximately 38 and 71 m for the low and high-k probes, respectively. This diameter is constant over the entire water submersion depth. This essentially flat-topped probe endface results in a very sharp transition 关esti-mated from Fig.2共a兲to be ⱕ25 m兴 for the drop in Q. The rapid decrease in Q with submersion depth 共D兲 means that even a small height of water will cause significant deteriora-tion in probe Q. This has implicadeteriora-tions to liquid cell19 and
probe designs aimed at minimizing the immersion depth to ⱕ100 m or attempting to eliminate the damping effects by creating a diving bell19,30 to surround the probe except over the last tens of microns.
B. Meniscus model for probe damping at the air-water interface
Since the sharp transition in damping occurs very close to the air-water interface it seems reasonable that it is related to the meniscus that forms once probe contact is made with the surface. Ref.21has suggested that upon initial contact of their nanoneedle probe tip there appears a surface drag or squeeze damping force of the meniscus on the side walls of the probe caused by the large shear rates across the thin meniscus channel. In a separate experiment described in Sec. II B we measured the meniscus height共h兲 and contact angle 共兲 for both low-k and high-k metalized probes slowly im-mersed into water. The results are shown in Table IIfor the case when the probe first makes contact with the water; when it is partially submerged共D ⱖ h兲 and when it has been pulled out of the water to produce a column of water attached to the
FIG. 2. 共Color online兲 共a兲 Low-k probe Q 共䊊兲 and tapping mode 共0
= 8 kHz兲 normalized rms voltage 共䊏兲 as a function of the probe height 共H兲 above a glass surface. 共b兲 Low-k probe Q 共䊊兲 and tapping mode 共1
= 38 kHz兲 normalized rms voltage 共䊏兲 as a function of the probe height above the glass surface. The height of the water was 500 m.
FIG. 3. 共Color online兲 Hysteresis effect 共high-k probe兲 in Q resulting from the difference in Q obtained when dropping the probe through the air-water interface to a glass surface共䊊兲 compared to raising it 共䊏兲 through the water to the water-air interface 共at H = 500 m兲 dragging a approximately 200 m high column of water attached to the probe endface.
TABLE II. Meniscus height and contact angle in water for a metalized NSOM probe.
h共m兲 °
Case A: first contact with water surface
low-k probe 12⫾ 2 72⫾ 2.5 high-k probe 34⫾ 4 72⫾ 2.5
Case B: probe partially submerged共D ⱖ h兲
low-k probe 7.5⫾ 2 80⫾ 2.5 high-k probe 22⫾ 2.5 82⫾ 2.5
Case C: probe just exiting the water
low-k probe 67⫾ 7 45⫾ 3 high-k probe 140⫾ 14 40⫾ 4 043526-4 Taylor et al. J. Appl. Phys. 107, 043526 共2010兲
base of the probe. In the latter case the value of共h兲, which is approximately 140 m for the high-k probe, compares to the value of 200 m obtained from the hysteresis data shown in Fig.3.
The height h共兲 of the meniscus surrounding a cylinder is given by21
h共兲 = R cosln关2.25/R共1 + sin兲兴, 共2兲 where is defined as the angle at the contact line between the air-liquid interface and vertical, R is the fiber radius, and
is the capillary length defined as
=共␥/g兲1/2
. 共3兲
In Eq.共3兲␥is the liquid surface tension andthe density of the liquid and g is the acceleration due to gravity. For water at room temperature␥= 72⫻ 10−3 N / m,= 1 ⫻ 103 Kg/ m3,
and g = 9.8 m / s2 resulting in= 2.7 mm, a length which is
long compared to the fiber diameter and meniscus height. Using our measured value for = 80° 共see TableII兲 Eq. 共2兲 predicts h = 16.4 m for the low-k probe with case B immer-sion 共Table II兲. For the high-k probe = 82° and Eq. 共2兲 predicts h = 22.1 m. Experimentally 共Table II兲 we observe h = 7.5 and 22 m, respectively.
When the fiber is submerged a depth D in the liquid, viscous drag forces Fd act on the vibrating fiber. The probe
velocity共v兲 in the vertical vibration direction is equal to the quotient of the peak to peak amplitude共2A兲 共obtained from AFM force curve measurements: for the low-k probe 2A = 148 nm; for the high-k probe 2A = 320 nm兲 and the reso-nance period 共1 /0兲. The value for v is small 共i.e., low-k
probe v⬇ 1.2⫻ 10−3
m / s; for the high-k probe v⬇ 4.2 ⫻ 10−3 m / s兲 guaranteeing a low Reynolds number 共Re兲 and
laminar flow since for water Re⬇ vL/= 2共high-k case兲, where L is the flow interaction length共500 m兲 andis the dynamic viscosity 共1cP or 1 ⫻ 10−3 Pa s兲. The normalized
viscous drag force is given in Ref.21as Fd/v = 2D/关ln共D/2R兲 − 0.2 + 1.8R/D兴,
valid for D ⱖ 4R. 共4兲
For the low-k probe immersed D = 500 m, Fd/v = 1.3
⫻ 10−6
N s / m corresponding to a drag force of 1.5 nN, while for the high-k probe Fd= 6.9 nN.
The authors in Ref. 21 also define a novel meniscus dampingterm analogous to the viscous term
Fm/v = 2R x 3ln共h/a兲/, 共5兲
where “a” is a molecular cut-off length 共chosen as 1 nm兲, which is used to avoid a singularity in the solution method.21 The meniscus damping force is directly proportional to the product of the fiber radius and the viscosity and inversely proportional to the meniscus contact angle. It is only weakly dependent on the meniscus height through ln共h/a兲. For the low-k probe using experimental values for h = 7.5 m and
= 1.39 rad. Equation 共5兲 predicts Fm= 2.7 nN nearly two
times larger than the viscous damping force experienced by the probe at a depth of D = 500 m. For the high-k probe Fm= 19 nN some three times larger than the viscous
damp-ing force共at D = 500 m兲. The increased dominance of
me-niscus damping over viscous damping with the high-k probe is consistent with the relatively small drop in Q with submer-sion 共Fig. 3兲 compared to the low-k probe 共Fig. 2兲. These calculations indicate that even though the meniscus height is considerably smaller than most of the probe immersion depths the meniscus damping effect is substantial since it acts through the shear rate term “” in Eq.共5兲over millime-ter distances defined by the capillary length共兲.
The viscous damping factor is defined as 1 / Qv
=共Fd/v兲 / 共mk兲1/2, where m is the effective mass of the
can-tilever and k is the spring constant. One can use Eq.共4兲with
= 1.8⫻ 10−2 cP for the case of probe immersion in air and
with a total probe flow interaction length of 2 mm to estimate the viscous damping effect of air on probe oscillation before probe immersion. Using Eq.共5兲we then calculate the ratio of the meniscus damping at the water/air interface 共1 / Qm兲 to
the viscous damping factor in air 共1 / Qv
air兲 to be Q v air/
Qm
= 39. Experimentally we typically observe a Q ratio equal to 5. This discrepancy might be explained by the fact that there are other damping effects for probe oscillation in air such as damping of the cantilever at the glue joint as mentioned in Sec. III A 1. It is also possible that the meniscus damping model overestimates probe damping at the water/air inter-face. This will be discussed later.
The combined damping effect in water is given by the sum of the meniscus damping plus the viscous damping and can be approximated by
1/Qm+ 1/Qv⬇ 共6R兲x ln共h/a兲/共mk兲1/2
+ 2D/关共mk兲1/2ln共D/2R兲兴. 共6兲
For the low- and high-k probe cases the sums are 1/Qm+ 1/Qv⬇ 9 ⫻ 10−3+ 2.45 ⫻ 101xD/ln共2.63
⫻ 104xD兲 low-k, 共7兲
1/Qm+ 1/Qv⬇ 1.8 ⫻ 10−3+ 2.45D/ln共1.4
⫻ 104xD兲 high-k, 共8兲
with the submersion depth D in共m兲.
In summary the damping model predicts a large drop in Q similar to that observed at the air-water interface shown in Figs.2and3. The model also predicts that the magnitude of both the meniscus and viscous damping 共at a given D兲 is approximately five times larger for the low-k probes than the high-k probes largely due to the 共mk兲1/2 term in 1/Q.
Con-sistent with these predictions we observe that the high-k probe undergoes less meniscus damping compared to the low-k probe resulting in higher Q when just submerged as well as less viscous damping giving a higher Q at a depth D = 500 m. For low-k probes Eq.共7兲predicts that the mag-nitude of viscous damping should equal that of the meniscus damping at a submersion depth of D = 1.2 mm. For the high-k case Eq.共8兲predicts that this should occur at a depth D = 2.7 mm equal to the capillary length calculated from Eq. 共3兲. Experimentally共Figs.2 and3兲 we observe a faster fall-off in Q at depths of only a few hundreds of microns. The model’s underestimation for the drop in Q with D for both low and high-k probes may be due to an overestimation of
the magnitude of the meniscus damping by a factor of 2 to 3 relative to the viscous damping term. Further work is re-quired to understand the details of meniscus damping. We shall also see in Sec. III C that damping effects may involve more complex oscillations of the probe rather than the simple vertical vibration provided by tapping mode operation.
C. Decrease in probe resonance frequency with water submersion
As the probe enters the water to a depth ⱖ25 m we begin to observe a small decrease in the peak cantilever reso-nance frequency. Figure4 shows that the frequency shift共1
mode兲 relative to that obtained in air is more or less linear 共slope= 1 kHz per 100 m of immersion兲 with the depth of water submersion regardless of whether the probe is dropped to the glass surface 共drop-down mode兲 or raised up 共lift-up mode兲 from the surface to the water-air interface. However, the curves appear to level off at larger depth values. A similar 10% drop in resonance frequency 共not shown兲 has been ob-served with the fundamental vibrational mode 共0兲. The
rather strong dependence of frequency shift on probe immer-sion shown in Fig.4 demonstrates the importance of main-taining a minimum and constant water level to avoid experi-encing drifting in the peak resonance frequency.
Frequency shifts up to 20% have been reported using both NSOM 共Refs. 17 and 18兲 and AFM 共Ref. 17兲 probes totally immersed in water. Numerous theoretical treatments of forced damped harmonic oscillation of cantilevers vibrat-ing in incompressible liquids with a velocity ␦u /␦t have been described in the literature. Many of these theories solve the linearized Navier–Stokes equations to account for vis-cous damping. However none of the various theoretical treat-ments of probe damping treat our case of partial submersion of the vertical part of a vertically vibrating共tapping mode兲 cantilever.
In the past a hydrodynamic argument is usually pre-sented to explain the frequency shift with probe immersion.17 The argument is generally applied to the case where the
vi-bration in the liquid is normal to the long axis of the probe. Then to first order the vibrating structure behaves as though an extra drag mass共also refered to as a virtual or comoving mass ma兲 of fluid is added to the vibrating structure.
23 This results in an additional inertial force Fi= −ma␦2u /␦t2. The
added mass is proportional to the displaced or pushed mass of fluid md, which is given as the product of the volume共V兲
of the immersed body共with densityb兲 and the density of the
fluid f
ma= Cmmd= CmfV, 共9兲
where Cmis the added mass coefficient, which for an ideal
fluid Cm⬇ 1.
17
Therefore the value of this added mass is generally approximated as the mass of the volume of water displaced by the submerged portion of the probe. The de-crease in frequency follows from the simple =共k / meff兲1/2
relationship, in which the effective mass meff= mtot+ ma,
where mtotis the total mass of the bent fiber probe. For the
limiting case of a totally submerged probe the ratio of the frequencies measured in fluid compared to that in air is given by
f/a=关mtot/共mtot+ ma兲兴1/2= 1/共1 + Cmf/b兲1/2
⬇ 1/共1 +f/b兲1/2. 共10兲
For a fused silica probe 共b= 2.2⫻ 103 kg/ m3兲 immersed in
water withw= 1.0⫻ 103 kg/ m3the predicted frequency
ra-tio is 0.83 corresponding to a maximum decrease in reso-nance frequency of 17%.
In our case probe vibration is along the axis of the sub-merged portion of the probe共tapping mode兲 rather than per-pendicular to it. The pushing on the water should be through the bottom of the probe 共with radius R兲 and the effective volume of the displaced body of water should be⬇2 / 3R3
which will be unchanged as the probe is lowered into the water. In other words, damping of this piezo-driven vertical tapping mode vibration cannot account for the experimen-tally observed progressive frequency shift. It would appear that our probe vibration is not confined to just vertical oscil-lation and must include some torsional motion, i.e., causing motions perpendicular to the axis of the vertical portion of the probe. Using a similar bent low spring constant fiber probe Muramatsu et al.15 observed that dragging the probe tip on a surface in contact mode could also excite such tor-sional modes of oscillation. One can define a tortor-sional spring constant共ktor兲 analagous to the formula to calculate the
can-tilever spring constant关Eq.共2兲in Appendix兴 ktor=GR
4/
2lhorxlvert 2
, 共11兲
where G is the shear modulus of glass 共3.12⫻ 1010 Pa for
silica兲; R is the probe radius, lhor is the horizontal length of
the probe and lvertis the length of the vertical component of
the bent probe. For our low-k probe R = 19 m, lhor
= 1 mm, and lvert= 0.97 mm. Substitution of these values
yields a ktor= 7 N / m which is three times smaller than the
spring constant for vertical oscillation 共Table I兲 supporting the argument that the probe can be excited by the piezoelec-tric driving element to oscillate perpendicular to its vertical axis and it is the damping of this vibration that causes the
FIG. 4.共Color online兲 Frequency decrease in the peak resonance frequency 共38 kHz for the1mode兲 as a function of depth 共D兲 below the water-air
interface for the low-k probe for both drop-down共䊊兲 and lift-up 共䊏兲 modes.
frequency shift. Specifically during water immersion damp-ing of the complex set of probe vibrations leads to progres-sive reshaping of the resonance curves resulting in a decrease in the peak resonance frequency. We therefore use the model of Kirstein et al.17 and assume that the added mass ma
=wV共cylinder of radius R and length D兲 =wR2D. Then it
follows that
=共k/meff兲1/2=关k/共mtot+ ma兲兴1/2
=关k/mtot/共1 +wR2D/mtot兲兴1/2. 共12兲
Since D is generally much less than the total length of the cantilevered probe then ma/mtotⰆ 1 and Eq.共12兲can be
ap-proximated using Macluarin series expansion to give
=0共1 −wR2D/2mtot兲, 共13兲
i.e., the frequency decrease depends linearly on the depth of probe immersion共D兲. Substitution for the various parameters in Eq. 共13兲results in=0共1 – 10−6 D / 2mtot兲. In Appendix
we show that mtot for the low-k probe equals 3.0⫻ 10−9 kg
and therefore =0共1 – 1.66⫻ 10−4 D兲, where the depth of
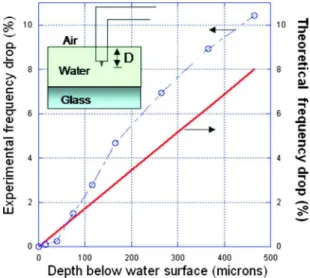
probe immersion in the water is in microns. Figure5 shows a plot of the experimental percentage frequency drop共probe drop down mode兲 as a function of depth below the water surface as well as the percentage change predicted from Eq. 共13兲.The simple calculation for the frequency decrease pre-dicts the basic linear dependence of frequency shift in im-mersion depth but underestimates the inertial damping force by roughly ⫻冑 2 which is equivalent to a 40% increase in the added mass.
A similar calculation can be made for the cut high-k probe described in Table I and in Appendix. In this case mtot= 0.76⫻ 10−8 kg and Eq.共13兲becomes
=0关1 – 2.6 ⫻ 10−4 D共m兲兴. 共14兲
Figure6 shows that the agreement between experiment and theory关Eq.共14兲兴 is much closer for this probe which should have less torsional oscillation, i.e., due to a smaller vertical
length关lvertin Eq.共11兲兴 compared to the longer low-k probe.
There are two important implications of nonvertical NSOM probe vibration whether it occurs in air or under a liquid. The torsional vibration will produce shear force inter-action of the probe tip and the sample which may cause damage and diminish the benefit of tapping mode operation. Second the effective probe aperture may be larger than the actual aperture size by approximately the magnitude of the torsional oscillation. This could be especially important for small sub-100 nm NSOM apertures. We are actively investi-gating the effect of torsional vibration on probe performance. Figure 7 shows preliminary results on the effect of low-k probe wobble in air at decreasing the AFM resolution on an AFM test grid consisting of 1 m squares. The NSOM probe was identical to those described in this paper but was not focused-ion beam milled and therefore had a sharp tip. Figure 7 provides a comparison of probe AFM resolution
FIG. 5. 共Color online兲 Experimental frequency decrease 共䊊兲 with water immersion as a percentage of the peak resonance frequency for the1mode
共1= 38 kHz兲 in air 共drop down mode兲 and theoretical prediction 共—兲 using
Eq.共13兲as a function of probe depth below the water surface for the low-k probe.
FIG. 6. 共Color online兲 Experimental 共䊊兲 frequency decrease with water immersion as a percentage of the peak resonance frequency of the0mode
in air 共0= 24.7 kHz兲 and theoretical prediction 共—兲 using Eq.共14兲as a
function of probe depth below the water surface for the cut high-k probe.
FIG. 7. 共Color online兲 Topography image 共inset兲 of a nominal 20 nm high, 1 ⫻ 1 m square AFM calibration grating. The image was obtained with a non-FIB machined low-k NSOM probe in tapping mode. The line represents the location where a topographic sectional analysis was performed of the step edge with the NSOM probe operated in tapping共circles兲 and contact mode共triangles兲 feedback, demonstrating an increased effective probe aper-ture共10%–90% points兲 while operating in tapping mode.
with tapping mode 共similar conditions to those used in the damping experiments兲 and contact mode 共no oscillation兲. In agreement with our damping analysis tapping mode opera-tion does lead to poorer topographical resoluopera-tion 共a change of approximately 47 nm兲 due to an estimated 23 nm wobble amplitude of the probe aperture. We are currently making a comparison of tapping mode versus contact mode probe res-olution in water. However, torsional probe oscillation may be similar in air and water. In water torsional oscillations are highly damped relative to that experienced in air, however, the serious probe damping in water results in the use of higher piezoelectric drive amplitudes共up to ⫻10兲 to keep the rms voltage high共i.e., to keep a good signal to noise ratio in the laser deflection distance regulation feedback loop兲. Higher drive amplitudes are expected to more efficiently ex-cite the torsional vibrational modes.
IV. CONCLUSION
We have performed detailed measurements on the damp-ing behavior of tappdamp-ing mode, bent fiber NSOM probes at the air-water interface and with the probe immersed up to a depth of 500 m. We conclude that the meniscus damping model of Yazdanpanah et al.21 predicts the basic damping behavior of these probes at the interface. Attempts to reduce the meniscus damping by reducing the meniscus gradient 关i.e., higherin Eq.共5兲兴 could result in higher probe Q’s and more sensitive AFM-NSOM operation on soft sample sur-faces. This might be accomplished by coating the vertical part of the probe with a nonwetting compound. The progres-sive drop in the probe’s peak resonance frequency as it is submerged in water can be accounted for using the model of Kirstein et al.17with the realization that the bent fiber probe, when piezoelectrically driven vertically in the tapping mode, results in torsional modes of oscillation, the damping of which accounts for the frequency decrease. Further investi-gation of these torsional modes is required to assess their impact on probe sensitivity and probe resolution. Preliminary experiments show that removing the torsional modes of vi-bration by operating in the contact mode can lead to higher NSOM probe resolution. Unfortunately scanning soft samples in the contact mode is difficult usually resulting in either sample and/or probe damage. However, FCS-NSOM experiments on phase separated bilayers14can be performed in the contact mode once tapping mode imaging is used to locate the region of interest. We are currently investigating whether improved optical resolution results from contact mode operation in these experiments.
APPENDIX: CALCULATIONS OF PROBE SPRING CONSTANT AND RESONANCE FREQUENCIES IN AIR
We have used Sarid25to calculate v0 共fundamental兲 and
v1 共first higher mode兲 for a straight solid cylindrical lever
free to oscillate at one end, i.e., equivalent to a low-k fiber probe with effective length l = 1.46 mm and probe radius R = 18 m and with no vertical 共concentrated mass兲. In the case of the fundamental resonance frequency0 equals
0=共k/0.24 meff兲1/2=关共3ER4/4l3兲/0.24共R2l兲兴1/2.
共A1兲 In this expression k is the effective cantilever spring constant given by
k = 3ER4/4l3, 共A2兲
and meffis the effective cantilever mass equal to the product
of the cylinder volume共R2l兲 and the cantilever density 共兲. In the above equations E is Young’s modulus for the canti-lever. For fused silica E = 7.3⫻ 1010 N / m2 and density
= 2.2⫻ 103 kg/ m3. We calculate k = 5.8 N / m and 0= 8.6
⫻ 104
rad/ s corresponding to 0=0/2= 13.69 kHz.
Ex-perimentally we observed the resonance frequency to be very close, i.e., 13.88 kHz validating Sarid’s formulae for the case of a straight optical fiber glued at one end to an AFM stub. From Sarid25 the ratio of normal mode frequencies for a rectangular cantilever is 共v1/v0兲 = 共4.694/ 1.875兲2= 6.27
im-plying that the frequency of the next normal mode v1
= 102.72 kHz. Experimentally we observe 81.62 kHz 共ratio of 5.9兲, i.e., approximately 20% lower than predicted. The measured probe quality factor Q defined as/⌬, where ⌬ is the FWHM of the cantilever resonance curve for this near ideal cantilever was 350.
We have also used Sarid’s formulism to calculate v0and
v1 for a bent low-k fiber 共cantilever parameters outlined in
TableI兲 with an effective distributed length l of 1.0 mm and distributed mass of md=R2land with a fiber radius共R兲 of
19 m. We assume that the additional mass of the vertical part 共lver= 0.97 mm兲 of the fiber acted as a concentrated
mass共mc兲 suspended at the open end of the cylinder. In this
case:
0=共k/mtot兲1/2=关k/共mc+ 0.24 md兲兴1/2
=关共3ER4/4l3兲/共mc+ 0.24 md兲兴1/2. 共A3兲 We estimate that k = 22 N / m and mc=R2⫻ lver= 2.42
⫻ 10−9 kg and m
d= 2.5⫻ 10−9 kg 共i.e., mtot= mc+ 0.24 md
= 3.0⫻ 10−9 kg兲. Therefore
0= 85.6 krad/ s and 0
= 13.6 kHz. Experimentally based upon data from numerous probes0= 8 ⫾ 1 kHz共TableI兲.
For the high-k probe with dimensions outlined in TableI we get mc= 1.18⫻ 10−8 kg, 0.24 md= 0.17⫻ 10−8 kg and
mtot= 1.35⫻ 10−8 kg yielding k = 494 N / m and 0
= 30.5 kHz. Experimentally we obtained0= 13 kHz共Table I兲. A calculation of 0 was also made for the high-k probe
with the vertical part of the fiber cut in half to a length of 0.675 mm. In this case mc= 2.2⫻ 103⫻ 3.14⫻共3.55
⫻ 10−5兲2⫻ 0.67510−3
= 0.588⫻ 10−8 kg and with 0.24 md
= 0.17⫻ 10−8 kg gives mtot= 0.76⫻ 10−8 kg and 0
= 40.6 kHz. Experimentally we observed 共Table I兲 0
= 24.7 kHz. Not surprisedly Sarid’s formulae for ideal can-tilevers overestimate the experimental bent fiber resonance frequencies by up to a factor of ⫻2 with the greatest discrep-ancies corresponding to the largest suspended mass, i.e., highest mc/md ratio.
1
R. C. Dunn,Chem. Rev.共Washington, D.C.兲99, 2891共1999兲.
2
A. Lewis, A. Taha, A. Strinkovski, A. Manevitch, A. Khatchatouriants, R. Dekheter, and E. Amman,Nat. Biotechnol.21, 1378共2003兲.
3
B. De Lange, F. Cambi, R. Huijbens, B. de Bakker, W. Rensen, M. Garcia-Parajo, N. van Hulst, and C. Figdor, J. Cell Sci. 114, 4153共2001兲.
4
E. Betzig, J. K. Trautman, T. D. Harris, J. S. Weiner, and R. L. Kostelak,
Science251, 1468共1991兲.
5
G. A. Valaskovic, M. Holton, and G. H. Morrison,Appl. Opt.34, 1215
共1995兲.
6
D. Courjon, K. Sarayeddine, and M. Spajer,Opt. Commun.71, 23共1989兲.
7
R. S. Taylor, K. E. Leopold, M. Wendman, G. Gurley, and V. Elings,Rev. Sci. Instrum.69, 2981共1998兲.
8
C. E. Talley, G. A. Cooksey, and R. C. Dunn,Appl. Phys. Lett.69, 3809
共1996兲.
9
R. S. Taylor and K. E. Leopold, Microscopy and Analysis 5, 15,共1999兲.
10
H. Muramatsu, N. Chiba, K. Homma, K. Nakajima, T. Ataka, S. Ohta, A. Kusumi, and M. Fujihira,Appl. Phys. Lett.66, 3245共1995兲.
11
A. Ianoul, P. Burgos, Z. Lu, R. Taylor, and L. Johnston,Langmuir19,
9246共2003兲.
12
A. Ianoul, M. Street, D. Grant, J. Pezacki, R. Taylor, and L. Johnston,
Biophys. J.87, 3525共2004兲.
13
A. Ianoul, D. Grant, Y. Rouleau, M. Bani, L. Johnston, and J. Pezacki,
Nat. Chem. Biol.1, 196共2005兲.
14
D. Vobornik, D. Banks, Z. Lu, C. Fradin, R. Taylor, and L. Johnston,
Appl. Phys. Lett.93, 163904共2008兲.
15
H. Muramatsu, N. Chiba, N. Yamamoto, K. Homma, T. Ataka, M. Shigeno, H. Monobe, and M. Fujihira,Ultramicroscopy71, 73共1998兲.
16
M. Platkov, A. Tsun, L. Nagli, and A. Katzir,Appl. Phys. Lett.92, 104104
共2008兲.
17
S. Kirstein, M. Mertesdorf, and M. Schonhoff,J. Appl. Phys.84, 1782
共1998兲.
18
H. Muramatsu, N. Chiba, K. Homma, K. Nakajima, T. Ataka, S. Ohta, A. Kusumi, and M. Fujihira,Thin Solid Films273, 335共1996兲.
19
P. Lambelet, M. Pfeffer, A. Sayah, and F. Marquis-Weible, Ultramicros-copy71, 117共1998兲.
20
A. Fragola, L. Aigouy, P. Y. Mignotte, F. Formanek, and Y. de Wilde,
Ultramicroscopy101, 47共2004兲.
21
M. Yazdanpanah, M. Hosseini, S. Pabba, S. Berry, V. Dobrokhotov, A. Safir, R. Keynton, and R. Cohn,Langmuir24, 13753共2008兲.
22
P. G. de Gennes, F. Brochard-Wyart, and D. Quere, Capillary and Wetting
Phenomena, 1st ed.,共Springer, New York, 2002兲, Chap. 6, p. 143.
23
F.-J. Elmer and M. Dreier,J. Appl. Phys.81, 7709共1997兲.
24
P. Burgos, Z. Lu, A. Ianoul, C. Hnatovsky, M.-L. Viriot, L. J. Johnston, and R. S. Taylor,J. Microsc.211, 37共2003兲.
25
D. Sarid, Scanning Force Microscopy, Oxford Series in Optical and
Im-aging Sciences, revised ed.共Oxford University Press, New York, 1994兲.
26
Y. T. Yang, D. Heh, P. Wei, W. Fann, M. Gray, and J. Hsu,J. Appl. Phys. 81, 1623共1997兲.
27
M. K. Ghatkesar, T. Braun, V. Barwich, J.-P. Ramseyer, C. Gerber, M. Hegner, and H. Lang,Appl. Phys. Lett.92, 043106共2008兲.
28
R. Patois, P. Vairac, and B. Cretin,Appl. Phys. Lett.75, 295共1999兲.
29
W. H. J. Rensen, N. F. van Hulst, A. Ruiter, and P. West,Appl. Phys. Lett. 75, 1640共1999兲.
30
M. Koopman, B. de Bakker, M. Garcia-Parajo, and N. F. van Hulst,Appl. Phys. Lett.83, 5083共2003兲.