HAL Id: hal-00329257
https://hal.archives-ouvertes.fr/hal-00329257
Submitted on 1 Jan 2003
HAL is a multi-disciplinary open access
archive for the deposit and dissemination of
sci-entific research documents, whether they are
pub-lished or not. The documents may come from
teaching and research institutions in France or
abroad, or from public or private research centers.
L’archive ouverte pluridisciplinaire HAL, est
destinée au dépôt et à la diffusion de documents
scientifiques de niveau recherche, publiés ou non,
émanant des établissements d’enseignement et de
recherche français ou étrangers, des laboratoires
publics ou privés.
Latitudinal and radial variation of >2 GeV/n protons
and alpha-particles at solar maximum: ULYSSES
COSPIN/KET and neutron monitor network
observations
A. V. Belov, E. A. Eroshenko, B. Heber, V. G. Yanke, A. Raviart, R.
Müller-Mellin, H. Kunow
To cite this version:
A. V. Belov, E. A. Eroshenko, B. Heber, V. G. Yanke, A. Raviart, et al.. Latitudinal and radial
variation of >2 GeV/n protons and alpha-particles at solar maximum: ULYSSES COSPIN/KET and
neutron monitor network observations. Annales Geophysicae, European Geosciences Union, 2003, 21
(6), pp.1295-1302. �hal-00329257�
Annales
Geophysicae
Latitudinal and radial variation of >2 GeV/n protons and
alpha-particles at solar maximum: ULYSSES COSPIN/KET and
neutron monitor network observations
A. V. Belov1, E. A. Eroshenko1, B. Heber2, V. G. Yanke1, A. Raviart3, R. M ¨uller-Mellin4, and H. Kunow4
1IZMIRAN, Troitsk, Moscow region, 142190, Russia
2Fachbereich Physik, Universit¨at Osnabr¨uck, 49069 Osnabr¨uck, Germany 3DAPNIA/Service d’Astrophysique, C. E. Saclay, 91191 Gif-sur-Yvette, France
4Institut f¨ur Experimentelle und Angewandte Physik, Universit¨at Kiel, 24098 Kiel, Germany
Received: 17 September 2002 – Revised: 16 January 2003 – Accepted: 14 February 2003
Abstract. Ulysses, launched in October 1990, began its
sec-ond out-of-ecliptic orbit in September 1997. In 2000/2001 the spacecraft passed from the south to the north polar re-gions of the Sun in the inner heliosphere. In contrast to the first rapid pole to pole passage in 1994/1995 close to solar minimum, Ulysses experiences now solar maximum conditions. The Kiel Electron Telescope (KET) measures also protons and alpha-particles in the energy range from 5 MeV/n to >2 GeV/n. To derive radial and latitudinal gradi-ents for >2 GeV/n protons and alpha-particles, data from the Chicago instrument on board IMP-8 and the neutron moni-tor network have been used to determine the corresponding time profiles at Earth. We obtain a spatial distribution at solar maximum which differs greatly from the solar minimum dis-tribution. A steady-state approximation, which was charac-terized by a small radial and significant latitudinal gradient at solar minimum, was interchanged with a highly variable one with a large radial and a small – consistent with zero – lat-itudinal gradient. A significant deviation from a spherically symmetric cosmic ray distribution following the reversal of the solar magnetic field in 2000/2001 has not been observed yet. A small deviation has only been observed at northern polar regions, showing an excess of particles instead of the expected depression. This indicates that the reconfiguration of the heliospheric magnetic field, caused by the reappear-ance of the northern polar coronal hole, starts dominating the modulation of galactic cosmic rays already at solar max-imum.
Key words. Interplanetary physics (cosmic rays; energetic
particles) – Space plasma physics (charged particle motion and acceleration)
Correspondence to: B. Heber
(bheber@uni-osnabrueck.de)
1 Introduction
Cosmic ray measurements within a wide range of helio-graphic latitudes in the inner heliosphere were performed by detectors on board the Ulysses spacecraft in 1994–1996. This time period was characterized by low solar activity and weak modulation of cosmic rays. As displayed in Fig. 1 Ulysses reached a maximum heliographic latitude of 80.2◦in
the Southern and Northern Hemispheres, and has an orbital period of about half a solar cycle. As a consequence, solar activity was high when Ulysses performed the second rapid pole to pole transition in 2000 and 2001. Figure 1 shows the heliolatitude and radial distance of Ulysses from 1993 to 2004. Black and blue solid circles mark the start of each year during the first and second out-of-ecliptic orbit. The red and green histograms show the evolution of the maximum lati-tudinal extent of the heliospheric current sheet α during the first – solar minimum – and second – solar maximum – or-bit. Hoeksema (http://quake.stanford.edu/∼wso/) calculates
αusing two different magnetic field models: (1) The “clas-sical” model uses a line-of-sight boundary condition at the photosphere and includes a significant polar field correction. (2) The newer model uses a radial boundary condition at the photosphere, has a higher source surface radius (3.25 solar radii), and requires no polar field correction. In Fig. 1 we used the “classical” model. Note that the figure would not be altered qualitatively by using the newer model, whereas the absolute numbers would be different.
For the purpose of this paper, the exact value of α is not crucial, as α is used as a proxy for solar activity. It is low and high during solar minimum and maximum, respectively. All large modulation effects in solar cycle 22 during the first Ulysses orbit occurred while the spacecraft was at low lat-itudes in 1990 to 1993. Ulysses was again close to the he-liographic equator by the time of the onset of solar activity
1296 A. V. Belov et al.: ULYSSES COSPIN/KET and neutron monitor network observations
-80
-60
-40
-20
0
20
40
60
80
1
2
3
4
5
6
Heliocentric radius
[
AU
]
Heliographic latitude
[
o]
α
l, southα
l, north1993
1994
1995
1996
1997
1998
1999
2000
2001
2002
Fig. 1. Ulysses’ heliographic latitude as a function of radial
dis-tance. Black and blue solid circles mark the start of each year dur-ing the first and second out-of-ecliptic orbit. The red and green histograms show the evolution of the maximum latitudinal extent of the heliospheric current sheet α during the first, solar minimum and second, solar maximum orbit.
in solar cycle 23, at the end of 1997 and beginning of 1998. Since then α and also solar activity remained high.
The evolution of the maximum latitudinal extent of the he-liospheric current sheet α (a) and the solar polar magnetic field strength for the Southern and Northern Hemisphere (b) are displayed in Fig. 2 (from http://quake.stanford.edu/
∼wso/), together with the daily averaged count rate of 100–
125 MeV protons (c) and the 26-day averaged “quiet time” count rates of >2 GeV protons and >2 GeV/n alpha-particles (d) from Ulysses’ launch in 1990 to mid 2002. In panel (b) the corresponding 20 nHz smoothed solar polar magnetic field strength is superimposed. The 20 nHz low pass filter is used by the Wilcox Solar Observatory to eliminate yearly ge-ometric projection effects. From the time profiles it follows that the two hemispheres reversed their polarities in 1990 and 2000. Hence, the heliospheric magnetic field is expected to reverse its polarity accordingly. In 2001 the northern polar coronal hole was formed (McComas et al., 2001a), show-ing the correspondshow-ing signatures in the heliospheric magnetic field (Smith et al., 2001), indicating the decline towards so-lar minimum. It is important to note that such interplanetary signatures have not been observed by Ulysses in 2000, when the spacecraft was at 80◦S heliographic latitude.
The 26-day averaged “quiet time” counting rates in panel (d) of Fig. 2 are presented as percentage changes with re-spect to the maximal rates Cmax measured in mid 1997 at
solar minimum. “Quiet time” profiles have been determined by using only time periods when the 100–125 MeV proton channel (panel (c) of Fig. 2) showed no contribution of solar or interplanetary particles (Heber et al., 1999). Marked by shading in (c) and (d) are the Jovian flyby in 1992 (JE), the
10-4 10-2 count rate [ 1/s ] -40 -20 0 1990 1992 1994 1996 1998 2000 2002 (C(t)-C max )/C max [%] -200 -100 0 100 200
A
>
0
Polar Field [ G ] -30 30 90 α 3 5 3.5 2 2 3.5 5 4 2.5 1.5 -5 -30 -80 70 20 -15 -40 -70 0 70 r [AU] θ[o]Tilt
JE
FLS
EC
FLS
>2 GeV protons
>2 GeV/n helium
(c)
(b)
(a)
(d)
Fig. 2. (a) Evolution of the maximum latitudinal extent of the
helio-spheric current sheet α. (b) Solar polar magnetic field strength for the Southern (black) and Northern Hemisphere (red). The smoothed curves display the 20 nHz low pass filtered values; both are from http://quake.stanford.edu/∼wso/. (c) Daily averaged count rate of 100–125 MeV (0.3 GV) and (d) 26-day “quiet time” count rates of
>2 GeV protons and >2 GeV/n alpha-particles. Ulysses’ distance to the Sun and its heliographic latitude are shown on top.
two rapid pole to pole passages in 1994/1995 and 2000/2001 (FLS), and the ecliptic crossing in 1998 (EC). The observed variations in the particle intensities are caused by temporal and spatial variations due to the Ulysses trajectory. There-fore, the variation from solar minimum to solar maximum in 2000 does not reflect the total modulation amplitude at these rigidities. The two rapid pole to pole transitions at ∼1.5 AU should provide the best “snapshot” of the spatial distribution of cosmic rays in the inner heliosphere at solar minimum and maximum, respectively.
1.1 The 3-dimensional heliosphere at solar minimum Around solar minimum there is a clear separation between low and high latitudes: (1) While the region close to the he-liographic equator is embedded in slow solar wind, polar re-gions are dominated by the high speed solar wind, originat-ing from the polar coronal holes (McComas et al., 2001a). (2) The heliospheric current sheet, the thin layer separating both magnetic polarities of the heliospheric magnetic field,
is embedded in the slow solar wind regime and stable around solar minimum (McKibben et al., 1998). In an A > 0 so-lar magnetic cycle, like in the 1990’s, the heliospheric mag-netic field pointed outwards and inwards in the Northern and Southern Hemispheres, respectively. In that case drift mod-els predict that positively charged cosmic rays drift predom-inantly inward through the solar polar regions and then out-ward through the equatorial regions along the heliospheric current sheet (Jokipii et al., 1977). (3) The latitudinal dis-tribution of high energy cosmic rays measured by Ulysses showed the expected behavior (Paizis et al., 1995; Heber et al., 1998): The count rate of >2 GeV/n protons and helium increased towards high latitudes, and was nearly symmetric with respect to the equator (Heber et al., 1997; Belov et al., 1999). The observed time profile at these rigidities during Ulysses’ first fast latitude scan in 1994/1995 is dominated by the latitudinal gradient (Belov et al., 1999).
1.2 The 3-dimensional heliosphere at solar maximum The second fast latitudinal scan in 2000/2001 was the first exploration of the inner 3-dimensional heliosphere around solar maximum. The heliosphere was completely different from the first rapid pole to pole passage in 1994/1995. A rel-atively quiet, stable and well-structured heliosphere was in-terchanged with a highly variable solar wind and heliospheric magnetic field showing a large number of irregularities (Mc-Comas et al., 2001a; Smith et al., 2001). At solar mini-mum a clear separation exists between low-latitude slow so-lar wind and fast soso-lar wind. The heliospheric current sheet, which had a “simple” and stable configuration during solar minimum, became a much more complex structure and was observed at polar regions (Smith et al., 2001) (see Fig. 1). During Ulysses’ second out-of-ecliptic orbit, the polar coro-nal holes disappeared and were interchanged with short-lived coronal holes originating at low latitudes. This situation be-came even more complex due to (1) the increasing number of coronal mass ejections, causing large Forbush effects, which were nearly absent during solar minimum, and (2) the rever-sal of the solar magnetic field, as described above.
2 Data analysis
As described in the previous section, Fig. 2 displays the daily averaged count rates of 100–125 MeV protons and 26-day “quiet time” averages of >2 GeV/n protons and alpha-particles from the Kiel Electron Telescope (KET) on board Ulysses. Figure 3 shows the high energy KET channels with higher time resolution along with a 1-AU baseline measure-ment, which is derived from neutron monitor and IMP-8 ob-servations. A simple inspection of Figs. 2 and 3 shows the differences between the first (solar minimum) and the second (solar maximum) orbit. While the spatial variation dominates the temporal variation during Ulysses’ first orbit from 1994 to fall of 1997, the observed count rate variation from 1998 to 2001 is determined by the increasing temporal
modula--50 0 50 0 2 4 6 θ [ o ] R [ AU ] -40 -20 0 20 1994 1995 1996 1997 1998 1999 2000 2001 2002 2003 year Variation [%] 10 GV particles at Earth (−16%) protons (>2 GeV) helium (>2 GeV/N, −8%)
Ulysses radial distance
Ulysses heliographic latitude
Fig. 3. Ulysses’ heliographic latitude and radial distance to the Sun.
Daily and 26-day running mean averaged variations >2 GeV/n pro-tons and helium as measured by the KET and 10 GV cosmic ray variation at Earth. The latter is inferred from neutron monitor and IMP-8 observations.
tion in the inner heliosphere, reaching solar maximum condi-tions in 2000/2001. Although numerous solar particle events have been observed, the “quiet time” count rates of galactic cosmic ray protons and alpha-particles are continuously in-creasing during the second fast latitude scan, indicating that none of these events give rise to a modulation barrier, like the March to July activity in 1991 (McDonald et al., 2000).
Ulysses’ measurements alone are not sufficient to infer a concept about the spatial distribution of the cosmic ray phase space density during the rising phase of the solar cycle be-cause of its temporal variation. However, Fig. 2 indicates that because of the continuous increase during the rapid pole to pole passage in 2000/2001, no significant latitudinal gra-dients at solar maximum could be present. If such latitu-dinal gradients would have been present, then the temporal and Ulysses’ radial variation must have canceled them ex-actly. We find such a symmetric temporal variation, centered around day 136 of 2001, unlikely, and, therefore, reject this scenario. Since Ulysses moved from a distance of ∼2 AU at southern polar regions inward to 1.34 AU close to the helio-graphic equator and then back to ∼2 AU over the north pole, a radial gradient of ∼3%/AU would lead to a 1.021 times higher flux at polar regions. A negative latitudinal gradient of the order of 0.026%/degree might be masked by the radial variation.
In order to derive mean radial and latitudinal gradients around solar maximum, a model describing the temporal and time dependent spatial parameters is applied. The tempo-ral variations can be described by appropriate 1 AU observa-tions, as given by the neutron monitor network, and displayed together with the Ulysses observations in Fig. 3. The radial and latitudinal gradients are then derived from a fit to the KET data using Ulysses’ trajectory parameters as displayed in the upper panel of Fig. 4. We assume that temporal, radial
1298 A. V. Belov et al.: ULYSSES COSPIN/KET and neutron monitor network observations and latitudinal dependencies of the cosmic ray intensities are
separable, so that the cosmic ray intensity at Ulysses can be described as:
Ii(t, r, θ ) = I0i(t0, r0, θ0) · (1 + δi(t )) · fri(t, r) · fθi(t, θ ) ,(1)
where I0i(t0, r0, θ0)is the particle intensity at time t0at a
dis-tance r0from the Sun and at a heliographic latitude θ0; δi(t )
is the intensity variation at a time (t). Note that δi(t ) < 1. The index i is used for the type of particle (p for protons and
hfor alpha-particles). 2.1 Radial variation
Since Ulysses’ radial variation is small, we can write
fri(t, r) =exp(gir(t ) · (r − r0))with gri(t )as a time
depen-dent radial gradient. It is reasonable to relate gir(t )with the depth of modulation δi(t ): gir(t ) = g0,ri +gi1,rδi(t ), where
gi0,rdescribes the radial gradient at solar minimum and gi1,r its changes within the solar cycle. In what follows we will use both, the stationary and time dependent approximation of the radial gradient.
2.2 Latitudinal gradient
Although Ulysses’ observations over the whole latitude range from the heliographic equator to southern and north-ern polar regions indicates that two different modulation re-gions exist, with different latitudinal gradients in the fast and “slow” solar wind regime (Heber et al., 1998, 2002), we as-sume that fθi(t, θ ) = exp(gθi(t ) · (θ − θ0)). Herein is giθ(t )
the time dependent latitudinal gradient. 2.3 Temporal variations
Unfortunately, there is no 1-AU baseline instrument for the KET cosmic ray measurements available. The time variation
I0i(t0, r0, θ0)has to be estimated by observations of high
en-ergy particles by the neutron monitors from the world-wide network on Earth. From these data a rigidity spectrum of the cosmic ray density variations can be derived on a daily basis (Heber et al., 1997; Belov et al., 1999, 2001). Since a sim-ple power law rigidity spectrum is not sufficient to describe the long-term variations, we assumed a rigidity dependence
f (R) =1/(β +Rγ). The expected neutron monitor counting rate variation is δ = a0c0 = a0R
∞
Rc W (R)f (R)/f (R0)dR,
where a0and c0are amplitude and coupling coefficients of
the isotropic cosmic ray variation, respectively, Rcis the
ge-omagnetic cutoff rigidity, R0 = 10 GV. The parameters a0,
β, and γ can be found for every day by comparing the ex-pected variations and the real variations observed by the neu-tron monitor network (more than 30 stations). While the ap-proach of deriving the rigidity spectrum of the temporal vari-ation is useful at solar minimum (Heber et al., 1997; Belov et al., 1999), it is not reliable around solar maximum be-cause of the large uncertainties as described by Belov et al. (2001). In this paper we determine the temporal modula-tion for >2 GeV/n protons and alpha-particles, assuming that
the modulation depth δi(t )is proportional to the modulation
depth δ10(t )at 10 GV. The latter can be determined from
the neutron network observations with high accuracy. Taking into account all the assumptions listed above and introducing
lmodi =ln(Ii(t, r, θ )), we can rewrite Eq. (1):
lmodi =ln(Ii(t, r, θ )) = ai+bδiδ10+gθiθ +(gi0r+g 1
1rδi)·r.(2)
Herein the explicit time dependence of the five parameters especially for gθ, has been neglected. We used the
least-square root method to obtain the four or five unknown pa-rameters in Eq. (2) from the observations. It is important to note that the cosmic ray spatial distribution during high solar activity is more complicated than at solar minimum. For ex-ample, during Ulysses’ solar minimum orbit in 1994 to 1997 the cosmic ray observations were dominated by (1) latitudi-nal, (2) radial, and (3) temporal variations. Therefore, we could determine the latitudinal gradient, during Ulysses’ fast latitude scan, and the radial gradient, when Ulysses was back to the heliographic equator in 1997 (Belov et al., 1999).
At solar maximum one should take into consideration that the parameters gr, gθ in Eq. (2) become dependent on time,
radial distance and heliographic latitude (McDonald et al., 1997; Fujii and McDonald, 1997) The cosmic ray time pro-file, which should not be related to Ulysses’ position, cor-relates occasionally with the spacecraft distance and/or lati-tude. Such a correlation can be essentially high on relatively small time intervals (less than a year). To obtain a reliable and stable fit of Eq. (2) to the data we need to analyze the data sets for long time periods.
3 Results and discussion
To determine the mean radial and latitudinal gradients we analyzed the time period from January 1998 to mid 2002. This period is characterized by (1) increasing solar activity from 1998 to 2000, (2) solar maximum activity of cycle 23 in 2000/2001, and (3) declining activity in 2002. It is impor-tant to note that the latter period includes the reversal of the heliospheric magnetic field. The total observed cosmic ray modulation for 10 GV particles at Earth exceeded 30%. In what follows we will discuss the observations, excluding the time period of the heliospheric magnetic field reversal, which corresponds to the times when Ulysses was in the Southern Hemisphere, the observations during the second fast latitude scan, and the latest data, taken in the Northern Hemisphere. 3.1 Cosmic ray gradients during the rising and maximum
phase of the solar cycle
From January 1998 to May 2001 Ulysses was in the South-ern Hemisphere, reaching its maximum southSouth-ern latitude of 80◦S in November 2000, and returning to the heliographic equator in May 2001. In that time period its distance to the Sun was gradually decreasing from 5.4 to 1.4 AU. Al-though Ulysses scanned the whole latitude range, the cosmic
-2.7 -2.6 -2.5 -2.4 -2.3 ln (protons) [ 1/s ] -5.4 -5.2 -5 -4.8 1998 1999 2000 2001 2002 ln (helium) [ 1/s ] >2 GeV protons Approximation Approximation >2 GeV helium
Fig. 4. Daily and 26 day running mean averages >2 GeV Ulysses
protons (upper) and helium (lower panel) and the fit of Eq. (2) to the data. For the parameters in Eq. (2) see text.
ray measurements are dominated by the large, temporal vari-ation, leading to a high correlation in cosmic ray behavior measured at Earth and on board Ulysses.
Due to the different heliographic latitudes and longitudes of Ulysses and Earth, not all short-term cosmic ray decreases caused by, for example, coronal mass ejections or corotating interaction regions are seen at Earth and at Ulysses. Since Ulysses is at a larger radial distance than Earth, an outward moving disturbance will reach the spacecraft later. In order to account for these effects, we applied the following two corrections to the data:
1. Measurements at Earth have been “shifted” to the Ulysses position. If we take into account a propaga-tion speed of 400 km/s for a disturbance moving from 1 AU to Ulysses at a radial distance ru, the time
pro-files at Earth and at Ulysses are better correlated; the correlation coefficient increased from 0.954 to 0.972;
2. Solar rotation averaged running means have been used to minimize the longitudinal differences.
If we assume that the radial gradient is constant over the time period of interest (from January 1998 to May 2001),
g1,r=0, the fit of Eq. (2), as displayed in Fig. 4, leads to the
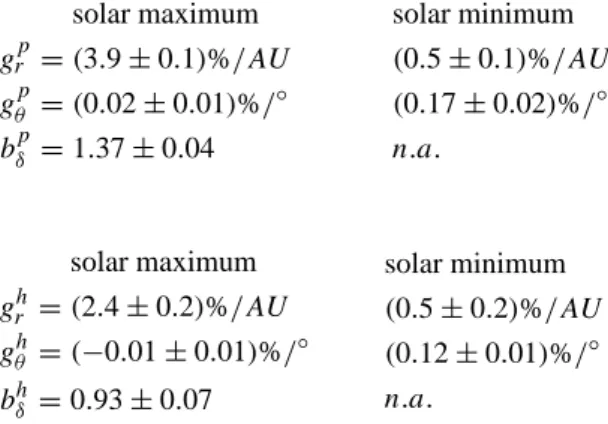
following results for >2 GeV/n protons and alpha-particles (for comparision the values obtained at solar minimum have been given too; Belov et al., 1999):
solar maximum gpr =(3.9 ± 0.1)%/AU gpθ =(0.02 ± 0.01)%/◦ bpδ =1.37 ± 0.04 solar minimum (0.5 ± 0.1)%/AU (0.17 ± 0.02)%/◦ n.a. solar maximum ghr =(2.4 ± 0.2)%/AU ghθ =(−0.01 ± 0.01)%/◦ bhδ =0.93 ± 0.07 solar minimum (0.5 ± 0.2)%/AU (0.12 ± 0.01)%/◦ n.a.
Using these parameters we obtain for protons and alpha-particles correlation coefficients of 0.972 and 0.81. Note that the poor correlation coefficient for the alpha-particles results from the large statistical uncertainties. If we take into ac-count the variation of the radial gradient with the modulation depth, we find for >2 GeV protons that the radial gradient is varying between 3.4 and 4.2%/AU. However, in that case the correlation coefficient is statistically not significant, and it is important to note that no temporal dependence of the lat-itudinal gradient has been taken into account; therefore, our results are not in contradiction with the result at lower rigidi-ties from Heber et al. (2002), who attributed the higher count rates of the data compared to the expectation in mid 1999 to the existence of latitudinal gradients. These gradients vanish later. It is important to keep in mind that Ulysses was be-low 20◦S before 1999 and around 30◦, when this latitudinal gradient has been observed. In Heber et al. (1997, 1998) it was shown that latitudinal gradients are significantly smaller close to the heliographic equator than at higher latitudes, so that a significant contribution of the latitudinal gradient is not expected to occur before 1999. If we attribute the excess of the observations in mid 1999 in Fig. 4 to a latitudinal gradi-ent, then we find gθ ∼=0.17%/degree. This value is in good
agreement with the value gθ =0.17 ± 0.02%/degree found
by Belov et al. (1999) at solar minimum.
In what follows we will neglect the latitudinal dependence, because the mean latitudinal gradient was found close to zero for the high latitude observations (see Fig. 4). We can rewrite Eq. (2) to:
lmodi =ln(Ii(t, r, θ )) = ai+biδδ10+gr,0i r . (3)
Our analysis showed that the approximation is even valid until July 2001, and we can extent our analysis to that period. We obtain the following parameters for >2 GeV/n protons and alpha-particles:
gpr =(3.7 ± 0.1)%/AU
bpδ =1.49 ± 0.03
ghr =(2.2 ± 0.2)%/AU
1300 A. V. Belov et al.: ULYSSES COSPIN/KET and neutron monitor network observations
Solar Minimum (A>0) Solar Maximum
Fig. 5. Meridional cut of the >2 GeV/n protons spatial
distribu-tion in a sphere of 5 AU radius during solar minimum (a) and solar maximum (b). Dark and light regions correspond to low and high intensities, respectively. For details see text.
The red curves in Fig. 4 correspond to the result of this spherically symmetric approximation. It is important to note that from mid 1999 to mid 2001, corresponding to 2 years around solar maximum, the cosmic ray distribution is in good agreement with a spherically symmetric one, which is characterized by large radial and nearly no latitudinal gradi-ents. In contrast, Belov et al. (1999) and Heber et al. (1997) determined radial and latitudinal gradients grp = 0.5%/AU
and gpθ = 0.19 ± 02%/◦ for the first Ulysses orbit. As
mentioned above they also found that the latitudinal gradient was small only within the narrow region of the streamer belt. To visualize the differences between the mean cosmic ray distribution obtained by Ulysses and the neutron monitor net-work at solar minimum in 1994 to 1996 and around solar maximum from mid 1999 to mid 2001, Fig. 5 (left) and Fig. 5 (right) display these distributions within a sphere of 5 AU radius. To obtain the solar minimum distribution we used
gr = 0.5%/AU, gθ =0 for |θ | < 15◦, else gθ =0.19%/◦,
gradually decreasing to zero above 70◦. To obtain the solar maximum distribution, a constant radial gradient of 4%/AU has been applied. In contrast to solar minimum our analy-sis indicates a spherically symmetric distribution of cosmic rays around solar maximum. The intensities in the inner he-liosphere depend on the radial distance from the Sun only, while in 1994 to 1996 the latitude dependence outside of the streamer belt (∼15◦) dominates the observations at
so-lar minimum. Since the radial gradient was increasing in 1997/1998 (Belov et al., 1999; McDonald et al., 2001), we suggest that the transformation from the minimum to the maximum distribution must have occurred around mid 1999, when the spacecraft was well below the heliographic equator, allowing for a good determination of latitudinal effects.
Another important conclusion can be made by the compar-ison of the spatial distributions displayed in Fig. 5. Since lat-itudinal gradients were positive at solar minimum in the last cycle and vanishing thereafter, the total modulation is higher at polar latitudes than in the ecliptic. While the observations at solar minimum in an A > 0 solar magnetic cycle con-firm the results from advanced modulation models (Potgieter
-2.54 -2.52 -2.5 -2.48 -2.46 -2.44 -50 0 50 heliographic latitude ln(count rate) -5.14 -5.12 -5.1 -5.08 -5.06 -50 0 50 heliographic latitude ln(count rate) protons helium
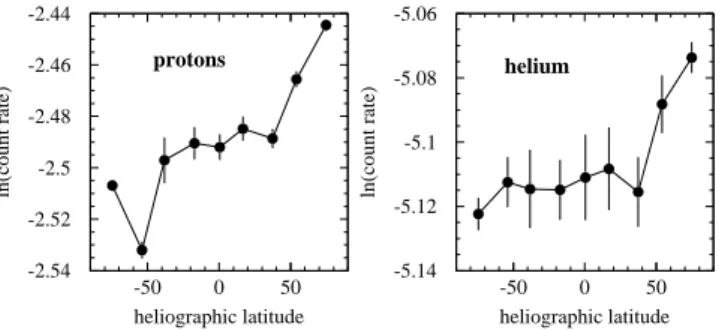
Fig. 6. Twenty-six-day averaged count rates of >2 GeV/n protons
and alpha-particles as a function of Ulysses’ heliographic latitude from the beginning of February to the end of September 2001 during the second fast latitude scan.
et al., 2001), the distribution obtained by Ulysses during the next A < 0 solar minimum will be a crucial test for such models.
3.2 Cosmic ray gradients around solar maximum in the Northern Hemisphere
The results discussed in the previous section relate to the Ulysses observations in the Southern Hemisphere. The fit of Eq. (2) and (3) to the Ulysses data from mid 2001 to the most recent data were not successful. This might have sev-eral causes:
– In contrast to the Southern Hemisphere observations, all
observations available were performed during the de-clining phase of the solar cycle 23;
– In contrast to the high southern latitudes a polar coronal
hole was observed in the Northern Hemisphere, indicat-ing the reconfiguration at the Sun. If latitudinal gradi-ents are tied to the fast solar wind region, then the fit by both equations will fail, because of the spatial depen-dence of the latitudinal gradient;
– As argued by Heber et al. (2002) the temporal change
of radial and latitudinal gradients does not occur simul-taneously.
In order to determine the gradients by fitting Eq. (2) to the data, more data at low latitudes are needed to determine the radial gradient with better precision. Due to the reconstruc-tion of the heliospheric magnetic field towards a well-ordered structure, the galactic cosmic ray distribution is expected to change (Heber et al., 2003), which might not be expressed by the modulation depth, so that Eq. (2) is not applicable. 3.3 The solar maximum fast latitude scan
The second fast latitude scan occurred early in the declin-ing phase of solar cycle 23, when the cosmic ray intensities started to recover. Besides the relative short time period – it took Ulysses 11 months from the southern polar cap to the
northern one – the radial variations were small. We selected the part of the Ulysses orbit, when the spacecraft was within 2.5 AU from the Sun, which covers the time period from De-cember 2000 to DeDe-cember 2001, and the whole latitudinal range from 80◦ S to 80◦N. Hence, we used the radial and temporal parameters as determined in the previous section. The residual profile should, therefore, reflect the latitudinal dependence of the cosmic ray fluxes as displayed in Fig. 6 for 2 GeV/n protons and alpha-particles as a function of Ulysses’ latitude. A simple inspection of Fig. 6 shows that the proton and helium intensities depend only weakly on latitude with the exception of the increase above ∼ 50◦N for both species. The drop in the Southern Hemisphere at about 60◦S is only observed in 2 GeV protons and might be rather caused by the increased solar activity in March 2001, with large short-term cosmic ray variations, rather than by the latitudinal distribu-tion. In contrast, the increase in the Northern Hemisphere is seen in both channels and has a consistent trend. If we attribute this trend to a latitudinal gradient, then a value of
gθ ∼0.12%/degree and gθ ∼0.1%/degree for protons and
alpha-particles is obtained. It is important to note that this latitudinal gradient is smaller than the one observed at solar minimum in 1994/1996, but it is still positive. At a first view this is a surprise because the solar magnetic field reversed in 2000/2001, and drift should operate in this solar cycle such that positively charged particles are streaming in along the heliospheric current sheet and out in polar directions, lead-ing to negative latitudinal gradients. However, the latitudinal dependence of cosmic rays is not only determined by drifts, but also by diffusion, convection and adiabatic deceleration. These mechanisms depend differently on the heliospheric conditions. In this context it is important to note that signif-icant latitudinal gradients were observed mainly in the fast solar wind regime (Heber et al., 1998; Belov et al., 1999). If the particle transport depends on such structures, one expects no dependence on the solar magnetic epoch. The reappear-ance of the northern polar coronal hole in 2001 (McComas et al., 2001b) would consequently lead to larger cosmic ray intensities at polar regions than close to the streamer belt. At the same time the structure of the heliospheric current sheet was still very complicated. Thus, drifts, which would cause negative latitudinal gradients, were not fully “operational”, leading to positive latitudinal gradients. This is in agreement with the constancy of the e/p-ratio at 2.5 GV as measured by Ulysses (Heber et al., 2003). In order to analyze and in-terpret the observations, further measurements are needed. A detailed analysis of the Northern Hemisphere data will be possible, when the spacecraft has returned close to the eclip-tic plane.
4 Summary and conclusion
In this paper we determined important modulation parame-ters, like the radial and latitudinal gradient, as well as the modulation depth from solar minimum to maximum, by us-ing Ulysses’ KET and neutron monitor network
observa-tions. We could show that the mean spatial distribution at solar minimum from 1994 to 1996 is remarkably different from the one at solar maximum from 1998 to mid 2001. While the positive latitudinal gradient dominates the picture at solar minimum this distribution is spherically symmetric around solar maximum, with large radial gradients in the in-ner heliosphere. The increase in solar activity is accompa-nied by an increase in the radial gradient. When Ulysses was at high heliographic latitudes above 30◦ S from mid 1999 on, no significant latitudinal structure could be found until July 2001, when Ulysses was going above ∼50◦N and the tilt angle α fell down sharply. It is interesting to note that, as a consequence of the reconstruction of cosmic rays from a latitude dominated to a spherically symmetric distribution at solar maximum, the magnitude of the 11-year cosmic ray cycle is essentially bigger at polar regions than close to the heliospheric equator, particularly near Earth.
Unfortunately, the observations during the slow northern descent of Ulysses in 2001/2002 are difficult to interpret, and we have not been successful in determining the gradients and temporal variations independently from each other. How-ever, we investigated the second fast latitude scan, assuming that the radial gradient as well as the parameters describing the temporal variation stay constant during these 11 months. As a result of this analysis we find higher cosmic ray in-tensities in the northern polar region than close to the helio-graphic equator. If we interpret these as latitudinal gradients, we can determine gθ to be 0.12%/degree and 0.1%/degree
for 2 GeV/n protons and alpha-particles, respectively, with a lower accuracy for the helium channel. It is important to note that this interval is correlated with the time period when Ulysses is embedded in the recently developing northern po-lar coronal hole. From mid 1999, when Ulysses was above 30◦ S to mid 2001, a highly variable and slow solar wind has been observed by Ulysses only (McComas et al., 2001b). In Heber et al. (1998) and Belov et al. (1999) we showed that latitudinal gradients are small in the streamer belt dom-inated region. Therefore, we argue here that the expansion described by the tilt angle and structure of the streamer belt to high heliographic latitudes leads to a strong increase in modulation and the form of the cosmic ray spatial distribu-tion in the inner heliosphere. As the tilt angle is decreasing towards solar minimum, with the development since 2001 of the northern polar coronal hole, fast solar wind emanating from that hole has been observed by Ulysses. Nearly simul-taneously an increase in the particle intensities at high north-ern polar latitude can be observed. This is in agreement with a concept of a close correlation of the cosmic ray modulation with the HMF configuration.
Acknowledgements. This work is supported by RFFR, grants
02-02-16992 and 01-02-17580. We are grateful to the Bartol Research Institute (U.S.NSF grant ATM-0000315), to University of Chicago (U.S. NSF grant ATM-9912341) and to all other contributors of the NM data. The ULYSSES/KET project is supported under grant No. 50 ON 9103 by the German Bundesminister f¨ur Bildung und Forschung (BMBF) through the Deutsches Zentrum f¨ur Luft- und Raumfahrt (DLR).
1302 A. V. Belov et al.: ULYSSES COSPIN/KET and neutron monitor network observations
Topical Editor R. Forsyth thanks two referees for their help in evaluating this paper.
References
Belov, A., Eroshenko, E., Heber, B., Yanke, V., Raviart, A., R¨ohrs, K., M¨uller-Mellin, R., Kunow, H., Wibberenz, G., and Paizis, C.: Latitudinal and radial variation of >2 GeV/n protons and alpha-particles in the southern heliosphere at solar maximum: ULYSSES COSPIN/KET and neutron monitor network obser-vations., Proc. 27th ICRC, 3996–3999, 2001.
Belov, A. V., Eroshenko, E. A., Heber, B., Ynake, V. G., Ferrando, P., Raviart, A., Bothmer, V., Dr¨oge, W., Kunow, H., M¨uller-Mellin, R., R¨ohrs, K., Wibberenz, W., and Paizis, C.: Latitudinal and radial variations of >2 GeV/n protons and α-particles in the northern heliosphere: Ulysses and neutron monitor network ob-servations, Adv. Space Res., 23, 443–447, 1999.
Fujii, Z. and McDonald, F. B.: Radial intensity gradients of galactic cosmic rays (1972-1995) in the heliosphere, J. Geophys. Res., 102, 24 201–24 208, 1997.
Heber, B., Belov, A. V., Raviart, A., Paizis, C., Eroshenko, E. A., Yanke, V., Dr¨oge, W., Green, G., and R¨ohrs, K.: Latitudinal and radial variation of >2 GeV/n protons derived by Ulysses-COSPIN/KET and neutron monitor network observations, in: Proc. 25th Int. Cosmic Ray Conf., Durban, South Africa, Vol. 2, 85–88, Space Research Unit, Potchefstroom University for CHE, Potchefstroom, 1997.
Heber, B., Bothmer, V., Dr¨oge, W., Ferrando, P., Haasbroek, L., Kunow, H., M¨uller-Mellin, R., C.Paizis, Potgieter, M. S., Raviart, A., and Wibberenz, G.: Latitudinal distribution of
>106 MeV protons and its relation to the ambient solar wind in the inner southern and northern heliosphere: Ulysses COSPIN/KET Results, J. Geophys. Res., 103, 4809–4816, 1998. Heber, B., Ferrando, P., Raviart, A., Wibberenz, G., M¨uller-Mellin, R., Kunow, H., Sierks, H., Bothmer, V., Posner, A., Paizis, C., and Potgieter, M. S.: Differences in the temporal variation of galactic cosmic ray electrons and protons: Implications from Ulysses at solar minimum, Geophys. Res. Lett., 26, 2133–2136, 1999.
Heber, B., Wibberenz, G., Potgieter, M. S., Burger, R. A., Ferreira, S. E. S., M¨uller-Mellin, R., Kunow, H., Ferrando, P., Raviart, A. C., Lopate, C., McDonald, F. B., and Cane, H. V.: Ulysses COSPIN/KET observations: Charge sign dependence and spa-tial gradients during the 1990–2000 A>0 solar magnetic cycle,
J. Geophys. Res., in press, 2002.
Heber, B., Sarri, G., Wibberenz, G., Paizis, C., Ferrando, P., Raviart, A.and Posner, A., M¨uller-Mellin, R., and Kunow, H.: The Ulysses Fast Latitude scans: COSPIN/KET results, Ann. Geo-physicae, this issue, 2003.
Jokipii, J. R., Levy, E. H., and Hubbard, W. B.: Effects of particle drift on cosmic ray transport, I. General properties, application to solar modulation, Astrophys. J., 213, 861–868, 1977. McComas, D. J., Elliott, H. A., Gosling, J. T., Reisenfeld, D.,
Sk-oug, R. M., Goldstein, B. E., and Neugebauer, M.: The solar wind’s return to a simple three-dimensional structure: Ulysses’ second fast-latitude scan, American Geophysical Union, Fall Meeting 2001, abstract #SH42C-03, 2001a.
McComas, D. J., Goldstein, R., Gosling, J. T., and Skoug, R. M.: Ulysses second orbit: Remarkably different solar wind, Spac. Sci. Rev., 97, 99–103, 2001b.
McDonald, F., Fujii, Z., Ferrando, P., Heber, B., Raviart, A., Kunow, H., M¨uller-Mellin, R., Wibberenz, G., McGuire, R., and Paizis, C.: The cosmic ray radial and latitudinal intensity gradi-ents in the inner and outer heliosphere 1996-2001.3, Proc. 27th ICRC, 3906, 2001.
McDonald, F. B., Ferrando, P., Heber, B., Kunow, H., McGuire, R., M¨uller-Mellin, R., Paizis, C., Raviart, A., and Wibberenz, G.: A comparative study of cosmic ray radial and latitudinal gradients in the inner and outer heliosphere, J. Geophys. Res., 102, 4643– 4652, 1997.
McDonald, F. B., Heikkila, B., Lal, N., and Stone, E. C.: The rela-tive recovery of galactic and anomalous cosmic rays in the distant heliosphere: Evidence for modulation in the heliosheath, J. Geo-phys. Res., 105, 1–8, 2000.
McKibben, R. B., Burger, R., Heber, B., Jokipii, J. R., McDonald, F. B., and Potgieter, M. S.: Latitudinal structure of modulation in the inner heliosphere, Spac. Sci. Rev., 23, 188–194, 1998. Paizis, C., Heber, B., Raviart, A., Ducros, R., Ferrando, P., Rastoin,
C., Kunow, H., M¨uller-Mellin, R., Sierks, H., and Wibberenz, G.: Latitudinal effects of galactic cosmic rays observed onboard the Ulysses spacecraft, 24th Int. Cosmic Ray Conf., Rome, Italy, Vol. 4, 756–759, 1995.
Potgieter, M. S., Burger, R. A., and Ferreira, S. E. S.: Modula-tion of Cosmic Rays in the Heliosphere From Solar Minimum to Maximum: a Theoretical Perspective, Space Science Reviews, 97, 295–307, 2001.
Smith, E. J., Balogh, A., Forsyth, R. J., and McComas, D. J., Ulysses in the south polar cap at solar maximum: Heliospheric magnetic field, Geophys. Res. Lett., 28, 4159–4162, 2001.