HAL Id: hal-00296993
https://hal.archives-ouvertes.fr/hal-00296993
Submitted on 26 Apr 2007
HAL is a multi-disciplinary open access
archive for the deposit and dissemination of
sci-entific research documents, whether they are
pub-lished or not. The documents may come from
teaching and research institutions in France or
abroad, or from public or private research centers.
L’archive ouverte pluridisciplinaire HAL, est
destinée au dépôt et à la diffusion de documents
scientifiques de niveau recherche, publiés ou non,
émanant des établissements d’enseignement et de
recherche français ou étrangers, des laboratoires
publics ou privés.
Separation of convective and stratiform precipitation for
a precipitation analysis of the local model of the
German Weather Service
I. Langer, E. Reimer
To cite this version:
I. Langer, E. Reimer. Separation of convective and stratiform precipitation for a precipitation analysis
of the local model of the German Weather Service. Advances in Geosciences, European Geosciences
Union, 2007, 10, pp.159-165. �hal-00296993�
© Author(s) 2007. This work is licensed under a Creative Commons License.
Geosciences
Separation of convective and stratiform precipitation for a
precipitation analysis of the local model of the
German Weather Service
I. Langer and E. Reimer
Institute for Meteorology, Free University of Berlin, Germany
Received: 13 July 2006 – Revised: 22 November 2006 – Accepted: 31 January 2007 – Published: 26 April 2007
Abstract. An improved independent precipitation data set
with the horizontal resolution of 7×7 km grid over central Europe was generated (Free University of Berlin (FUB)-precipitation analysis). For scale dependent evaluation of the Local model (LM) of the German Weather service, the precipitation data were separated into convective and strati-form fractions. To analyse precipitation amounts an interpo-lation scheme is used which contains the data set of “present weather” (ww), rain gauges and cloud types from the WMO-network in hourly resolution from the year 1992 until 2004 together with satellite cloud types derived from Meteosat-7 data. The structural analyses of cloud classes from satellite data as well as clouds from the synoptic observations were used to develop a statistical interpolation procedure to build up an independent precipitation analysis in resolution corre-sponding to the LM grid.
1 Introduction
Rain tends to be a discontinuous variable. The correct com-putation of the expected amounts does not depend only on the accurate determination of the instantaneous rainfall rates, but also on the effective coverage of the rain gauges. From satellite data a homogeneous monitoring field can be derived, but an exact algorithm to attach definitely these data with pre-cipitation amounts does not exist for mid-latitudes.
Satellite cloud data are highly important for the direct use in weather analysis and forecasting as well as in precipita-tion estimaprecipita-tion and in comparison with model output. In contrast to the surface observations by weather services net-works satellite data provides a complete horizontal and ho-mogeneous data coverage, but it is necessary to transform ra-diances to quantitative cloud information. The cloud
classi-Correspondence to: I. Langer
(ines.langer@met.fu-berlin.de)
fication and coverage derived from modern satellite data can be compared directly to model output data and can be used also to improve precipitation analyses. Most widely used are methods from geostationary satellites, partly in combi-nation with microwave sensors or AVHRR channels (Cheng and Brown, 1995; Uddstrom and Gray, 1996; Vincente et al., 1998; Todd, 1999; Levizzani, 2001; Rosenow, 2001; Ben-nartz, 2003).
2 Study area and WMO-synoptic data
In order to compare precipitation from rain gauges and
satel-lite data, the area between (5.0◦E–20.4◦E, 39.6◦N–55◦N)
has been selected. This area covers central Europe with a
wide of 2.45 Mill.km2(Fig. 1). For statistical analyses, data
of cloud cover, cloud types, actual weather type and precip-itation are taken from the German Weather service (DWD) in hourly intervals from the ground–based measurements. These data are used for the period of 1992 until 2003 (06:00– 18:00 UTC). (These data are from the daily transfer from the DWD to the Free University of Berlin.)
3 Statistical analysis of synoptic precipitation data
From the synoptic observations of “present weather” (ww) and cloud types at the WMO-synoptic stations (Fig. 1), a separation of convective and stratiform rain events at the time of observation or during the previous hour is possible. The numbering system of present weather which is used for the separation is given in Table 1. Within the code section 50–55, 60–65 and 70–75, higher values represent higher intensity of precipitation. The code numbers 20–29 refer to events dur-ing the last hour before the observation time (VUB2, 1999). In the next step, the convective and stratiform clouds will be defined, which produce precipitation. Figure 2 shows the relative frequency of cloud classes for “convective” and
160 I. Langer and E. Reimer: Convective and stratiform precipitation analysis compared with the LM from the DWD
Table 1. Code table of present weather used for separation of convective and stratiform rain events.
WMO-Code convective rain events stratiform rain events 17 nearby thunderstorm
20–24 rain, snow not falling as showers
25–29 (except 28) showers of rain, snow
50–59 drizzle
60–69 rain
70–75 solid precipitation not in showers
77 snow grains
80–99 showery precipitation or with current or recent thunderstorm
Fig. 1. Study area and distribution of the WMO-synoptic stations.
“stratiform” precipitation in Germany for low clouds de-rived from hourly values over a 12 year-period (1992–2003). All convective clouds including cumulonimbus are classified in the WMO-code classification as low clouds, because the cloud base is under 2500 m height.
The cloud classes for convective rainfall are as follows: 1. the cumulus class contains the cloud types: cumulus
mediocris, cumulus congestus and (“cumulus and stra-tocumulus” by a weight of 33%),
2. the cumulonimbus class includes: cumulonimbus calvus and cumulonimbus capillatus,
and for stratiform rainfall:
3. the stratus class contains the cloud type: stratocumu-lus, stratus nebulosus, stratus fractus and (“cumulus and stratocumulus” by a weight of 67%),
Fig. 2. Relative frequency of low clouds, each type distinguishing
between convective and stratiform clouds, when rain is observed from hourly synoptic data for the years 1992 until 2003, for the German stations.
4. the nimbostratus class contains the cloud type: altostra-tus opacus or nimbostraaltostra-tus, altocumulus translucidus or altocumulus together with altostratus or nimbostratus. This class belongs to middle level clouds.
The “cumulus and stratocumulus” cloud type (WMO-key 8 of low clouds) is separated into convective and stratiform cases by evaluating the present weather information Statisti-cal analysis (1992–2003) revealed that the weighting factor of this cloud type is associated with 67% of stratiform and 33% of this cloud type is convective. The results of the sta-tistical analysis belong to the single point observations of the synoptic network.
4 Satellite data
Meteosat-7 data with a temporal resolution of 30 minutes are archived from 1992 until present at the Free University of Berlin together with the derived products of “cloud cover-age” and “cloud classes”. The original resolution of the
Me-teosat IR data is 4×4 km2at the sub-satellite point, but only
around 6×8 km2in mid-latitudes. Meteosat-7 data are
trans-formed into a geographic projection with an effective spatial
resolution of 0.01◦. For the correction of the sun’s elevation,
the cosine of the sun’s distance to the zenith was used.
4.1 Cloud classes from satellite data
In order to determine the cloud classes and the cloud cover, the near-infrared (0.5–0.9 µm) and the thermal infrared chan-nel (10.5–12.5 µm) from Meteosat-7 between 06:00 and
18:00 UTC were selected. The cloud classification from
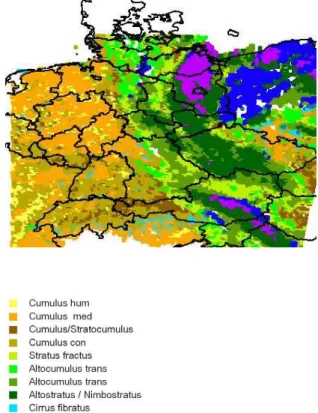
satellite data is based on the distribution of clouds in dif-ferent heights (i.e. with difdif-ferent cloud top temperatures) and with different optical thicknesses in a bi-spectral histogram (Berger, 1992). One extreme case is the cloudless surface which should be the warmest and darkest area in the satel-lite image and the other extreme case is the cloud top of a cumulonimbus as the coldest and brightest area. The au-tomated classification scheme tries to find those areas and builds test classes for other cloud types and calculates the arithmetic mean and the covariance for each class (Berger, 1992). For each pixel in the satellite image the probability of membership in the different classes is tested and the pixel is assigned to the class with the highest probability (Maxi-mum Likelihood Method). The calculations are performed separately for land and sea as well as for clouds over land and over sea. Generally the comparison of satellite derived clouds and clouds observed by surface observation is diffi-cult due to the fact that the clouds are observed from above and below the cloud layers. The comparison of precipita-tion derived from satellite and observed from rain gauges is generally difficult (Lutz, 2003). From Meteosat-7 data four clouds types in the high level were determined: cirrus spis-satus, cirrus fibratus, cirrus spissatus cumulonimbogenitus and cirrostratus. The medium-high clouds are determined by two cloud types, altocumulus trans and altocumulus together with altostratus/nimbostratus. The low clouds are separated into six cloud classes: cumulus hum, cumulus med, cumu-lus/stratocumulus, cumulus congestus, stratus fractus (higher clouds not visible from the ground), cumulonimbus or nim-bostratus. In fact, cumulonimbus and nimbostratus do not occur at the same time. If the nimbostratus has a cirrus layer above, the radiation characteristics due to the satellite chan-nels are very similar to those of cumulonimbus and a sep-aration of the cloud type is only possible with the help of the weather type from synoptic-based stations (Xie, 1995). Based on the results gained during GLOWA Elbe Experi-ment (Reimer et al., 2003), cloud types from satellite data
Fig. 3. Cloud classification from Meteosat data 12 August 2002,
13:00 UTC.
in comparison with synoptic data were statistically investi-gated. An example of the cloud types from Meteosat-7 data from 12 August 2002 at 13:00 UTC is shown in Fig. 3.
5 Interpolation scheme for the precipitation analysis
For the monitoring of rainfall and the use of rainfall data in model comparison, area-averaged fields are needed. Those fields can be derived by utilisation of satellite data. A weight-ing factor of precipitation for cloud types was generated by statistical analysis of satellite data and synoptic ground-based data. As a first step the interpolation scheme for the precipitation analysis is a simple linear interpolation Eq. (1), using the precipitation rate from observation and weights from cloud classes for different precipitation rates.
fo= P gifi P gi (1)
fo= precipitation rate [mm/h] at grid point
gi= weighting factor
fi = precipitation rate at observation station
Here the weighting factor gi is determined by
162 I. Langer and E. Reimer: Convective and stratiform precipitation analysis compared with the LM from the DWD
Table 2. Expectation of the relative weighting function w of cloud classes from Meteosat-7.
Precipitation [mm/h] 0–0.9 1–1.9 2–2.9 3–3.9 4–4.9 5–5.9 6–6.9 >7 cumulus 0.047 0.022 0.023 0.015 0.017 0.009 0.005 0.007 cumulonimbus 0.066 0.067 0.082 0.092 0.10 0.10 0.091 0.10 cumulus (WMO-type 8) 0.042 0.024 0.022 0.016 0.016 0.012 0.011 0.009 stratusfractus 0.10 0.025 0.021 0.005 0.008 0.008 0.005 0.0007 stratus 0.09 0.089 0.082 0.062 0.048 0.032 0.024 0.011 stratocumulus (WMO-type8) 0.064 0.042 0.034 0.025 0.017 0.013 0.014 0.005 altocumulus 0.055 0.064 0.066 0.079 0.076 0.050 0.056 0.049 altocumulus with alto-/nimbostratus 0.080 0.084 0.077 0.067 0.049 0.033 0.020 0.011
20 40 60 80 100 120 140 160 20 40 60 80 100 120 140 160 180 precipitation − 1h time : 2002081213 0 1 2 3 4 5 6 7 8 9 10 20 40 60 80 100 120 140 160 20 40 60 80 100 120 140 160 180 precipitation − 1h time : 2002081213 0 0.01 0.02 0.03 0.04 0.05 0.06 0.07 0.08 0.09 20 40 60 80 100 120 140 160 20 40 60 80 100 120 140 160 180 precipitation − 1h time : 2002081213 0 1 2 3 4 5 6 7 8 9 10
Fig. 4. (left above): Weight factor from Meteosat data at 12 August 2002, 13:00 UTC, (right above): Precipitation analysis [mm/h] without
and with (below) weight factor from satellite data, 12 August 2002, 13:00 UTC.
Eq. (2), where di denotes the distance between the position
vector of the grid point ro and the observation ri and w is the weight factor is given in Table 2.
gi =
1
di2|wo − wi |, di=|ro−ri | (2)
wo = cloud weight at grid point
wi = cloud weight at observation station
To introduce an anisotropic condition, the satellite born weights wo and wi for precipitation from Table 2 are used at the grid point from satellite cloud classes/types and at observation sites from observed or from satellite cloud classes/types. For each cloud class the local mean precipi-tation is determined and is normalized to the interval 0–1 in relation to all classes.
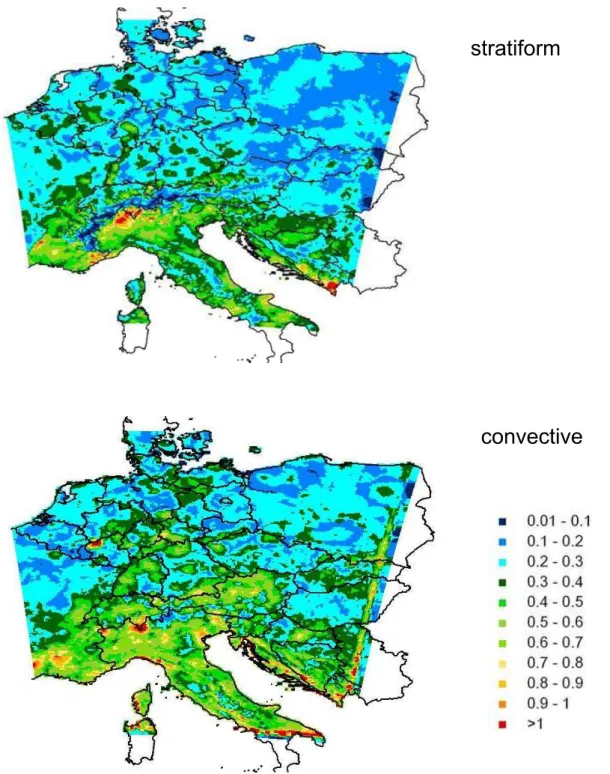
convective
stratiform
Fig. 5. Mean absolute error between LM and FUB analysis 2002 from hourly data.
In Fig. 4 an example is shown for 3-hourly precipitation from 12 August 2002 at 13:00 UTC. In Fig. 4a the weights
for precipitation from satellite are presented. Figure 4b
shows an example of an interpolated precipitation analysis. The satellite weighted analysis (Fig. 4a) shows more detailed structures, especially in the representation of the extreme val-ues.
5.1 Example for precipitation analysis for LM verification
The precipitation output of the LM is separated in convective and large scale components. This separation includes the dif-ferent processes and parameterisations of precipitation that are scaled and parameterized convective precipitation. In or-der to evaluate these processes, which take place at different
164 I. Langer and E. Reimer: Convective and stratiform precipitation analysis compared with the LM from the DWD scales, the separation fields of convective and stratiform
pre-cipitation by using synoptic WMO-data and the cloud classi-fication derived from Meteosat are compared. A time series of precipitation data separated into stratiform and convective, at the horizontal resolution of 7 km and a temporal resolution of one and three hours is generated.
Figure 5 shows an example of the mean absolute error (MAE) between the LM-precipitation analysis and the FUB – precipitation analysis for convective and stratiform precip-itation for the whole year 2002.
The results indicate that the stratiform precipitation (Fig. 5, below) has a larger error (yellow to red) in southern Europe. The mean absolute error for both, the convective and stratiform precipitation shows a greater error (red) over the Alpine region, particulary over Tessin and St. Gallen, which caused by the overestimation of the LM-precipitation. Gen-erally the hilly areas like the Schwarzwald, Harz and the Eifel were overrated by the LM-precipitation.
The mean absolute error of convective precipitation in northern Europe shows a more uniform structure with a nearly consistent error by about 0.1 until 0.3 while the MAE of stratiform precipitation shows more a spotted structure by a mean absolute error by about 0.4 until 0.7.
The model separation of precipitation into numerically re-solved and subgrid-scale parameterised precipitation does not well correspond to a classification of precipitation into convective and stratiform components based upon SYNOP reports and satellite imagery.
6 Conclusions and outlook
For model forecast evaluation on hourly time-scale, a new observational dataset for precipitation over Central Europe has been computed. In this study, a method is described to generate a precipitation analysis for Central Europe
sep-arated in convective and stratiform precipitation. With
the ground observation, of present weather, cloud types and clouds derived from satellite data, we separated non-precipitating from non-precipitating clouds, which we then sepa-rated into stratiform and cumuliform clouds.
By applying the maximum-likelihood-method a bi-spectral cloud classification of Meteosat-7 data has been per-formed. Due to the low resolution of the Meteosat data many pixels were not classified correctly. Mainly cloud-free areas, areas with thin clouds and sparsely clouded areas were af-fected, while for cloud clusters and organized cloud systems the classification works much better.
With the help of the statistical analyses of cloud classes from satellite data, as well as clouds from the synoptic obser-vations and measured precipitation we develop a statistical interpolation procedure to build up the precipitation analyses in resolution corresponding to the LM 7×7 km grid of the German Weather Service.
For the statistical interpolation procedure of calculating convective and stratiform precipitation, the satellite data of cloud types were weighted into a precipitation probability of clouds with rain from a 12 years period. The results are weightings which represent potential rainfall rates and were apply for the precipitation analyses. The precipitation analy-sis with the weights of potential rainfall shows more detailed structures, particularly for the representation of extreme val-ues. The main differences between FUB-precipitation analy-sis and LM-precipitation analyanaly-sis can be found in stratiform precipitation where the south of Europe shows higher mean absolute error values. On the other hand the LM overesti-mates the convective precipitation only for higher hilly area and for the south of Europe.
The next step will be the development of a statistical inter-polation procedure to build up an independent precipitation analysis in a resolution corresponding to the Local Model grid of 2.8 km. New products are available after the launch of the first satellite of the new generation of geostationary satel-lites (Meteosat-8). These satelsatel-lites provide 15-min products with a resolution at subsatellite point varying from 1.4 (high resolution VIS) to 4.8 km (IR) (Schmetz et al., 2002).
Acknowledgements. This work was funded by German DFG in the
framework of the “Quantitative precipitation forecast SPP 1167” programme.
Edited by: S. C. Michaelides and E. Amitai Reviewed by: anonymous referees
References
Bennartz, R. and Michelson, D.: Correlation of precipitation esti-mates from spaceborne passive microwave sensors and weather radar imagery for BALTEX, Int. J. Rem. Sens., 24, 723–739, 2003.
Berger, F. H.: Die Bestimmung des Einfusses von hohen Wolken auf das Strahlungsfeld und das Klima durch Analyse von NOAA AVHRR-Daten, Dissertation, Institut f¨ur Meteorologie, Freie Universit¨at Berlin, Wiss. Met. Abh., Neue Folge Serie A 6, 3, 1992.
Cheng, M. and Brown, R.: Delineation of precipitation areas by correlation of METEOSAT visible and infrared data with radar data, Mon. Wea. Rev., 1123, 2743–2757, 1995.
Levizzani, V., Schmetz, J., Lutz, H.J., Kerkman, J., Alberoni, P. P, and Cervino, M.: Precipitation estimations from geostationary orbit and prospects for METEOSAT Second Generation, Meteo-rol. Appl. 8, 23–41, 2001.
Lutz, H.-J., Inoue, T., and Schmetz, J.: Comparison of a split-window and a multi-spectral cloud classification for MODIS ob-servations, J. Meteorol. Soc. Japan, 81, 623–631, 2003. Reimer, E., Oestreich, A., Koslowsky, D., and Langer, I.: Wolken
und Niederschlag aus Satellitenmessungen: eine 11j¨ahrige Reihe f¨ur das ElbeEinzugsgebiet, Poster zur 6. DKT in Potsdam vom 22.9–25.9.03., 2003.
Reimer, E. and Scherer, B. : An operational meteorological diag-nostic system for regional air pollution analysis and long-term
modelling, in: Air Pollution Modelling and it Applications IX., edited by: van Doop, H., Plenum Press., 1992.
Rosenow, W., G¨uldner, J., and D. Sp¨ankuch: The “satellite Weather” of the German Weather Servicean assimilation proce-dure with a spectral component, Proceedings of the 2001 EU-METSAT Data Users Conference, 541–545, 2001.
Schmetz, J., Pili, P., Tjemkes, S., Just, D., Kerkmann, J., Rota, S., and Ratier, A.: An introduction to Meteosat Second Generation (MSG), Bull. Amer. Meteorol. Soc., 83, 977–992, 2002. Todd, M. C.: Estimation of daily rainfall over the upper Nile river
using a continuously calibrated satellite infrared technique, Me-teorol. Appl., 6, 201–210, 1999.
Uddstrom, M. and Gray, W.: Satellite cloud classification and rain-rate estimation using multispectral radiances and measures of spatial texture, J. Appl. Meteorol., 35, 839–858, 1996.
Vincente, G. A., Scofield, R. A., and Menzel, W. P.: The opera-tional GOES infrared rainfall estimation technique, Bull. Amer. Meteorol. Soc., 79, 1883–1898, 1998.
VUB2: Vorschriften und Betriebsunterlagen Nr. 2, Wetter-schl¨usselhandbuch Band A Schl¨uselform, 1999.
Xie, P. and Arkin, P. A.: An intercomparison of gauge observations and satellite estimates of monthly precipitation, J. Appl. Meteo-rol., 34, 1143–1160, 1995.