Development of a Landslide Hazard Map for the Island of
Puerto Rico
by
Sameer A. Kamal B.Sc., Chemical Engineering University of Texas at Austin, 2006
SUBMITTED TO THE DEPARTMENT OF CIVIL AND ENVIRONMENTAL ENGINEERING IN PARTIAL FULFILLMENT OF THE REQUIREMENTS FOR THE
DEGREE OF
MASTER OF ENGINEERING IN CIVIL AND ENVIRONMENTAL ENGINEERING AT THE
MASSACHUSETTS INSTITUTE OF TECHNOLOGY JUNE 2008
© Massachusetts Institute of Technology All rights reserved
Signature of Author ... MASAUHUSE TTS INSTITUTE OF TECHNOLOGY
JUN
12 20081
LIBRARIES
ARCHNVE
Department of Civil and Environmental EngineeringMay 9, 2008
Certified by ... ... ... ... Rafael Bras Professor, Civil and Environmental Engineering
Certified by .... ...
Peter Shanahan Senior Lecturer, Civil and Environmental E5n0 eering
Accepted by ... ... ... .. ...
Daniele Veneziano Professor, Civil and Environmental Engineering Chairman, Departmental Committee for Graduate Students
Development of a Landslide Hazard Map for the Island of
Puerto Rico
by
Sameer A. Kamal
Submitted to the Department of Civil and Environmental Engineering on May 9, 2008 in Partial Fulfillment of the
Requirements for the Degree of Master of Engineering in Civil and Environmental Engineering
ABSTRACT
This thesis describes the development of a landslide hazard map for the island of Puerto Rico through the use of Graphical Information System (GIS) tools.
Parameters considered in this study are elevation, slope aspect, slope angle and land use. This study employed data for a total of 2,966 landslides. The elevation and land use analysis was conducted on the entire landslide dataset, while the slope aspect and slope angle analysis was conducted on a smaller subset (366 landslides). This work builds on previous landslide studies in Puerto Rico by employing a 5-m Digital Elevation Model (DEM) for the slope angle and slope aspect analysis. The major steps involved in the landslide hazard map generation are: a categorization analysis to determine relative hazards for each parameter, assignment of weights to each parameter based on their range of relative hazard values, and a consolidation of results from each parameter that is analogous to a multi-factorial analysis.
Results indicate that slope angle is the dominant factor (87.5%) in determining landslide hazard, followed by elevation, slope aspect and land use. The slope angle results were found to be very sensitive on the choice of sampling methodology and data resolution. . In particular, the 5-m DEM provides significantly more detail than available for previous analyses and results in much greater sensitivity of risk to slope angle.
Further study is recommended into issues relating to the resolution at which the landslide data is obtained and normalized, as well as an inclusion of other parameters (such as soil type and geology) into this landslide hazard assessment.
Thesis Supervisors: Rafael Bras
Title: Professor, Department of Civil and Environmental Engineering Peter Shanahan
ACKNOWLEDGEMENTS
I would like to acknowledge the following people at M.I.T. for their support in the completion of this thesis:
Dr. Pete Shanahan, for his patience, thoughtful feedback and guidance over the course of this project and the MEng program. Dr. Rafael Bras, for his advice, encouragement and the opportunity to continue to work with his distinguished research group at M.I.T. Chiara Lepore and Enrico Bono, for their friendship and their technical input over the various stages of this project. Daniel Sheehan and the GIS Lab staff, for teaching me the tools without which this work would not have been possible. Dr. Eric Adams, Susan Murcott and the MEng program staff, whose dedication to the program and students have made this an unforgettable and enriching experience. My colleagues in the MEng
program and the CEE Department, for their companionship, camaraderie and friendly banter. I am honored and grateful to have shared in this experience with them.
I would like to acknowledge my professors and colleagues at the University of Texas at Austin, particularly Dr. Desmond Lawler, who helped set the academic grounding that prepared me for graduate school.
Most importantly, I would like to thank my family and friends who have supported me on my academic and personal journey. My father, Altamash, for his continued and
unwavering support of my endeavors and decisions, and for his determination in teaching an obstinate little boy from a blue algebra book. My mother, Simi, whose example has been instrumental to the personal and professional goals I have set for myself, and whose love and advice have molded me into the person I am today. My aunt Ajam, uncle Asif, and their family, whose love and support have made all of this possible. My brother Maazin and sister Daanika, whose courage continues to be a source of strength and inspiration for me. My grandparents (dado, nana and nani), and my cousins and extended family, for their encouragement and enduring support. Finally, my close friends, old and new, who from their respective parts of the world have continued to be there for me and helped me believe in myself.
TABLE OF CONTENTS
LIST O F FIG U R E S ...
5
LIST O F TA B L E S ...
6
CHAPTER 1: INTRODUCTION ...
7
CHAPTER 2: BACKGROUND ... 9
CHAPTER 3: METHODOLOGY ...
....
... 16
CHAPTER 4: RESULTS ... 27
CHAPTER
5:
CONCLUSIONS ...
...
... 43
B IB L IO G R A PH Y ... 46
APPENDIX A ...
...
49
LIST OF FIGURES
Figure 2.1: Data for 2,966 landslides in the Coamo, Cayaguas and Rio Blanco regions of
Puerto Rico were employed in this study... ... 15
Figure 3.1: 3D Representation of 1-m DEM for generated landslide truth...17
Figure 3.2 1 m slope angle grid - derived from landslide truth DEM. ... 18
Figure 3.3: 5 m slope angle grid - derived from landslide truth DEM ...19
Figure 3.4: 30 m slope angle grid - derived from landslide truth DEM ... ... 19
Figure 3.5: Dataset A consists of 366 landslides in the regions of Cayaguas, Ica and M am ayes ... ... 22
Figure 3.6: Features of a typical landslide, reproduced from Highland (2004) ...23
Figure 4.1: The relative landslide hazard increases significantly after the 0 - 200 m bin but is relatively constant across subsequent bins ... ...28
Figure 4.2: Relative landslide hazard varies slightly with the slope aspect, which is likely due to the direction of the prevailing trade winds...29
Figure 4.3: Mean daily trade wind direction, reproduced from Larsen (1998), shows that trade winds in the cities of San Juan and Ceba occur dominantly from the east and northeast...30
Figure 4.4: The wind direction frequency distribution for the inland site of Gurabo, an inlet site close to the regions in Dataset A. Reproduced from Altaii et al. (2003)...30
Figure 4.5: The relative landslide hazard does not vary appreciably with different land uses. Note that roads are buffered to 85 m on each side ... 32
Figure 4.6: The relative landslide hazard indicates a slight increase in hazard for roads and structures when a 40-m road buffer is applied ... 33
Figure 4.7: Manually determined slope angle values are generally higher than those determined from the 5-m and 30-m DEMs...35
Figure 4.8: Slope angle hazard normalized on a 5-m DEM... ... 36
Figure 4.9: Slope angle hazard normalized on a 30-m DEM (averaged from 5-m DEM) ... 3 7 Figure 4.10: The 5-m DEM is able to capture steeper slopes better than the 30-m DEM, which results in different relative hazards due to the different normalization areas for each bin... ... 38
Figure 4.11: Overall hazard map for Puerto Rico...41
LIST OF TABLES
Table 4.1: Summary of relative hazards for bins in each parameter... ...39 Table 4.2: Summary of weights assigned to each parameter ... 40
CHAPTER 1: INTRODUCTION
Historically, landslides have been a significant threat to human life. Landslides can be triggered by rainfall, earthquakes, volcanoes or human activity. In the United States, there
are an estimated 25-50 deaths and $1 -2 billion in economic losses annually due to landslides (Schuster 1996). The October 1985 Mameyes landslide in Puerto Rico was the worst landslide disaster in North America. At least 129 people were killed and more than 100 homes were destroyed. More recently, the February 2006 landslide in the village of Guinsaugon in the Philippines resulted in at least 139 deaths, with an additional 980 missing (presumed dead).
In addition to human life, direct costs from landslides include repair, replacement and maintenance of infrastructure, while indirect costs include loss of industrial, agricultural and forest productivity; loss of tourist and other revenues due to damage to land, facilities or transportation networks; loss of human and animal productivity and adverse impacts on water quality. Often, the true impacts of landslides are lost as they may occur as part of multiple-hazard disasters (Schuster 1996).
While there are several complex interactions that ultimately result in landslides, this study focuses on specific characteristics of hillslopes where historic landslides have been observed to develop a landslide hazard map for the island of Puerto Rico.
The methodology employed in the development of this landslide hazard map somewhat parallels that employed by Larsen et al. (1998). GIS data from existing landslides were superimposed on the Puerto Rico digital elevation model (DEM) using ArcGIS software. The slope angle, slope aspect and slope elevation at each landslide location were then analyzed. In addition, data layers accounting for land use and soil/geology added two additional parameters for the landslide hazard assessment. This study builds on previous work by employing DEM data at higher resolutions (5 m by 5 m) than was available in previous studies (160 m by 160 m).
This study is part of a wider NASA-funded research study being undertaken by research group of Professor Rafael Bras at M.I.T. The wider study aims to test the hypothesis that the use of higher resolution rainfall data (that NASA's upcoming GPM satellites aim to provide) will significantly improve landslide prediction capability using existing skills and computer models. The availability of significant data on landslides in Puerto Rico, in addition to a substantial body of work concerning the relationship between hill-slope characteristics, rainfall and landslide frequencies there, makes it a good setting for such a study. The study's main focus is on rainfall-triggered landslides.
The overall research focus in the Bras research group is to test the following hypotheses:
1) Because TRMM/GPM data capture complex spatial patterns in precipitation and provide frequent observations, they can be used with a distributed hydrology
consistent with relevant slope stability indices.
2) Detailed process modeling of spatio-temporal patterns of infiltration and lateral moisture redistribution using TRMM/GPM precipitation input as forcing
significantly improves the skill ofpredictions of landslide timing, location and spatial extent.
The distributed hydrology model referenced above is the tRIBS (TIN-based Real-time Integrated Basin Simulator) model, which is based on a triangulated irregular network
(TIN) representation (Ivanov 2004). Such a representation employs triangles of different sizes (instead of equally sized grids) to represent different areas with the same
characteristics. Recent studies have highlighted the distinct advantages of a TIN-based approach, which include computational savings in areas of low terrain variability (Goodrich 1991) and the ability to preserve linear features by using a "constrained triangulation" (Nelson 1994).
The tRIBS model allows for modeling of hydrologic process in a time-continuous fashion (Ivanov 2004). A modified version of tRIBS that accounts for vegetation effects (tRIBS-VEGGIE) has been widely employed for modeling purposes. Previous TIN-based
landslide work in the Bras group includes the successful use of the Channel-Hillslope Integrated Landscape Development (CHILD) model. The CHILD model employs slope stability equations and incorporates the effects of diffusive processes, rainfall, geology and vegetation (Istanbulluoglu and Bras 2005).
In addition to being an independent body of work, the landslide hazard map developed in this project facilitates the generation of a TIN with multiple resolutions that will be used in conjunction with the tRIBS-VEGGIE computer model for further study in the Bras group. Areas on the map that show a high susceptibility to landslides will be assigned a higher resolution in the TIN (and vice versa), after which the model will be forced using precipitation data to determine areas that may become susceptible to landslides after
rainfall events.
It is hoped that this work will ultimately contribute to a real-time landslide warning system that can be applied on the island, and that the methodology employed in this project (and the wider research study) will be applicable to other parts of the world that have had a high historic occurrence of landslides.
CHAPTER 2: BACKGROUND
Puerto Rico
As indicated in Chapter 1, the setting for this analysis is the island of Puerto Rico. Puerto Rico is located in the northeastern Caribbean, 1,280 miles off the coast of Florida. The island measures approximately 160 km east to west and 55 km north to south.
Topographically, a large part of the island is mountainous. The two main mountain ranges include the Cordillera Central mountain range in central Puerto Rico (maximum peak of 1338 m) and the Sierra de Luquillo mountain range in the northeast (maximum peak of 1074 m). The island is largely composed of Cretaceous to Eocene volcanic rocks, which are overlain by younger Oligocene and other sedimentary rocks (Pando 2005). The climate of Puerto Rico varies significantly due to its varied topography, ranging from humid-tropical in the central mountain range and north coast to seasonal dry in the
southern coastal plain (Larsen et al. 1993). The prevailing trade winds are from the east and northeast, and much of the rainfall during the May through December wet season is associated with these winds. Annual rainfall ranges between 760 to more than 5,000 mm, with variations mostly due to the changes in land elevation over the central mountain range. The mean annual temperature varies with elevation, ranging from 23 to 27 OC along the coastal plains to 19 to 23 'C at the higher peaks.
Historically, Puerto Rico has had significant landslide activity. The types of landslides include shallow soil slips, debris flows, debris slides, debris avalanches and slumps (Larsen et al. 1993). One factor contributing to high landslide activity in Puerto Rico is the relatively moist condition of soils. Compared to selected humid cities in the United States, Puerto Rico has almost twice the mean number of days where precipitation
exceeds 3 mm. In the forested areas of Eastern Puerto Rico, the average year-long rate of daily moisture loss in the upper 305 mm of soil was found to be about one-half that of the average summer rate in humid climates of the United States (U.S Army Corps of
Engineers, 1960). This lower soil moisture depletion rate is likely due to climatic
differences between Puerto Rico and the United States, such as shorter summer days and a lower maximum summer temperature (Larsen et al. 1993). Puerto Rico also has a significant historic hurricane frequency, with hurricane season running from June through October and the large majority of hurricanes occurring in August and September.
Landslide data from three areas of Puerto Rico - Coamo, Rio Blanco and Cayaguas - will be employed in this study.
Landslides and Related Terminology
The term landslide denotes "the movement of a mass of rock, debris or earth down a slope." Varnes (1996) provides useful guidelines on the major types and classifications of landslides. Different types of landslides are typically described by two nouns, the first denoting the material involved and the second denoting the type of movement. A complete description of a landslide would include sets of these two nouns (one for each
movement) in addition to descriptors that further elaborate the state, distribution and style of the landslide.
According to Varnes, there are three primary types of materials involved in landslides: rock, debris and earth. A rock is defined as a "hard or firm mass that was intact and in its natural place before the initiation of movement." Debris and earth are both considered a part of soil, which is broadly defined as an aggregate of solid particles (generally
minerals or rocks) that either was transported or was formed by the weathering of rock in place. Earth describes material in which 80 percent or more of the particles are smaller than 2 mm (i.e. finer material) while debris describes material where 20 to 80 percent of the material is larger than 2 mm (i.e. coarser material).
In addition, there are five main types of movements: falls, topples, slides, spreads and flows. A fall involves detachment of a soil or rock that descends through falling,
bouncing or rolling and where the movement is very rapid to extremely rapid. A topple, which is generally driven by gravity, is the forward rotation out of the slope of a mass of
soil or rock about a point or axis below the center of gravity of the displaced mass. A slide is a downward movement of a soil or rock mass that occurs dominantly along surfaces of rupture -in a rotational slide, the surface is curved and concave, while in a translational slide, the surface is planar. Translational slides are typically shallower than
rotational slides. A spread is a generally gradual extension and subsidence of a cohesive soil or rock mass into softer underlying material. A flow is a spatially continuous
movement where the distribution of velocities in the displacing mass is similar to that of a viscous liquid. Slides can often turn into flows with increased water content, mobility and evolution of the movement.
Destructive potentials of landslides can usually be gauged by velocity of the landslide. Landslide velocity is divided into seven categories, three of which classify "slow" landslides (extremely slow, very slow and slow), three of which classify "rapid"
landslides (extremely rapid, very rapid and rapid) and the last that classifies a "moderate" landslide. Important limits appear to be between "very rapid" and "extremely rapid" (on the scale of about 5 m/s) and between "slow" and "very slow" (1.6 m/year).
Further descriptors for landslides include the state of landslide activity (i.e. how "active" the landslide is at a particular time), the style of the landslide activity (i.e. how the
different movement processes described above contribute to the overall landslide) and the water content of the landslide materials (i.e. whether the materials are "dry," "moist," "wet" or "very wet.") For a more detailed discussion on landslide terminology, see Varnes (1996).
Slope Stability
In order to quantitatively determine the potential for a landslide, a slope stability analysis is often performed. Duncan (1996) provides an overview of soil slope stability analysis. In general, the stability of a slope is usually analyzed by methods of limit equilibrium. The potential sliding mass is subdivided into a series of smaller units, and each of these
units is analyzed by computational methods to determine their potential for failure. A key step in limit equilibrium techniques is the calculation of a factor of safety, which is determined for the critical slip surface (i.e. the surface that is most likely to fail by sliding).
The factor of safety is defined as the ratio of the shear strength (or resisting forces) to the shear stress (or driving forces) required for equilibrium of the slope, and effectively represents the factor by which the strength would have to be reduced to bring the slope to failure and cause a landslide. In other words, a factor of safety value of less than 1 indicates that driving forces will prevail, leading to slope failure. Factor of safety values greater than 1 do not indicate unconditional stability, but rather that the probability of stability increases as the value of the factor of safety increases (Selby 1993).
Process-based models have employed variations of the factor of safety equations and coupled them with geomorphic, hydrologic, geologic and vegetation data (Dietrech et al. 1993; Selby 1994; Iverson 2000). The factor of safety equation to be employed by the tRIBS model, for a particular element at an arbitrary depth Z and at time t, is reproduced below:
FS(Z t)= tanr c'(t) (Z, t)y,tan y
rd tana (yZ+B(Z,t))sinacosa (yZ+B(Z,t)>inacosa
where c '(t) is the apparent soil cohesion that is a function of root biomass, a is the slope angle, p is the internal friction angle of the soil, B(Z,t) is sum of the weight of the biomass above Z and the amount of water retained in the canopy, and ~(Z,t) is the soil matric potential at depth Z and time t. y, and yw are the specific weights of the soil and water, respectively.
The first term in the equation above represents the friction resistance of soil material, the second resistance due to cohesion and the third the reduction in resistance associated with soil water pore pressures. For a more detailed explanation of the factor of safety equation, see Dietrich et al. (1993), Selby (1993) and Iverson (2000).
Rainfall as a Landslide Triggering Mechanism
While landslides can have many long-term causes, they are generally attributed to a single "trigger". Landslide triggers, which essentially weaken the slope stability enough to cause a landslide, include intense rainfall, rapid snowmelt, water-level change, volcanic eruption and earthquakes (Wieczorek 1996).
The close relationship between rainfall intensity and landslides are well documented in various studies. The mechanism by which shallow landslides are generated during storms is considered to be soil saturation and the rise in pore-water pressures associated with rainfall (Wieczorek 1996). In addition, lower parts of hillslopes and stream channels may be particularly vulnerable to debris flows due to the high sediment contents in the stream
that are a result of intense rainfall.
Rainfall also increases shear stress on the land. Rainfall could remove the "toe" of a slope through erosion, thereby steepening the slope. Additional weight due to material washed up by rainfall onto slopes can also increase shear stress (Varnes 1996). Often, soils with low permeability do not have time to drain when such load changes occur, resulting in unequal excess pore pressures that lead to slope failure (Duncan 1996).
Approaches to Landslide Studies in the Literature
In general, previous landslide studies can be simplified into three general categories (Casadeit et al. 2002). This study generally falls into the category of probability-based studies, which involve an empirical mapping of historic landslide locations. The
assumption in probability-based studies is that the occurrence of future landslides can be predicted based on the hillslope parameters that have resulted in landslides historically. Different studies have focused on different parameters, and a common challenge in many of these studies is the resolution of the DEM employed (Casadeit et al. 2002).
For example, Akgun et al. (2007) considered slope angle, slope aspect, distance from drainage, distance from roads and geology (lithologic units) for historic landslide locations to generate a susceptibility map for a region in northeast Turkey. Weights for each parameter were determined by employing the analytical hierarchy process (AHP) method. Similarly, Santana et al. (2003) did a GIS-based analysis for the Eastern
Pyrenees region of Spain. Santana et al. generated a landslide susceptibility map based on a multivariate analysis, and compared predicted susceptibility to historic landslide
occurrences. Landslide studies in Puerto Rico that have employed this probability approach are discussed in the following section.
A second class of landslide studies has focused on an empirical analysis of landslide-producing storm characteristics. Caine (1980) collected an inventory of global landslide data and presented the results as an intensity-duration (ID) graph. Subsequent studies have conducted a similar analysis on more local scales (e.g., Larsen 1993) and sought to modify or improve the methodology for producing ID graphs (e.g., Wilson 2000). An inherent limitation of such studies is that they do not allow for a determination of the spatial extent of risk (Casadeit at al. 2002). Relevant intensity-duration studies conducted in Puerto Rico are discussed in the following section.
Other fairly recent studies have explored the possibility of using coupled hydrology-slope stability models for landslide studies. These studies are different from probability-based hazard map approaches in that they attempt to predict both the location and timing of landslides. For example, Casadei et al. (2002) looked at linking a combined shallow subsurface runoff model to an infinite slope model, and concluded that the performance of such a model appears to be significantly better than the intensity-duration threshold approach but requires a more detailed dataset and considerable calibration effort.
Similarly, Archarya et al. (2006) generated safety maps for the Rasuwa district in Nepal by employing a physically-based slope stability model coupled to a simplified
groundwater flow model to estimate soil wetness. The paper placed a large emphasis on a number of features associated with soil types such as the hydraulic conductivity, specific weight, soil cohesion and soil friction angles. The safety maps were generated for steady state soil saturation conditions as well as for quasi-dynamic conditions meant to simulate
1- and 10-year storm events. Casadei et al. (2003) noted that the rapidly growing availability of detailed GIS data and of computing power has led to advances in such coupled hydrology-slope stability models.
Ultimately, the results from this study will be used to support research in Professor Rafael Bras' group at M.I.T., which will also employ a hydrology and slope stability model and use precipitation data from satellites as a key input.
Previous Landslide Studies in Puerto Rico
In Puerto Rico, prior studies of landslides relevant to this project fall into two general categories. The first category of studies has assessed rainfall-triggered landslide probabilities conditioned on physical features of the hillslope such as slope angle, orientation, vegetation cover, etc. In general, the focus of these studies has been to use data at historic landslide locations to establish relative landslide hazards based on selected parameters. This "probability approach" is also employed in the current study. The second category has focused more on the rainfall that has resulted in these landslides, and as such focuses on landslide-triggering rainfall intensity, duration and frequency. A summary of studies most relevant to this project is presented below.
Larsen et al. (1998) developed landslide maps from 1:20,000-scale aerial photographs (with a 10 m by 10 m lower limit of observation) and GIS measurements. The landslides were characterized by a range of geomorphic indicators, which included a sharp break or disruption in vegetation type, bare soil or soil with little vegetation regrowth, steep head, and side scarps and downslope debris deposits. This approach was limited in that
landslides masked by thick forest canopy or shadows on steep hillslopes were not detected. Similarly, much older landslides on hillslopes that, over decades, had been restored close to their pre-landslide vegetative conditions were not detected (Larsen 2001). Three regions of Puerto Rico were selected as study areas (Blanco, Cayaguas and Coamo). A set of simplified matrices that related landslide occurrence to slope angle, slope elevation, slope aspect (the direction the slope faces) and land use were developed. It was found that hillslopes with gradients of 12 degrees or more, elevations in excess of 400 m and slope aspect facing the trade winds corresponded to an appreciable increase in landslide frequency.
Larsen et al. (1993) used data for 256 storms from 1959 to 1990 in the central mountain region of Puerto Rico to develop a threshold relation between rainfall intensity-duration and landslides. This threshold for Puerto Rico was, in turn, compared with a worldwide threshold developed by Caine (1980). The Puerto Rico threshold indicated that as much
as three times more rainfall is required to trigger landslides (for rainfall durations less than 1 Oh) in humid-tropical PR than the rainfall amount that triggers rainfall worldwide. In contrast, for rainfall approaching 100 h, the difference between humid-tropical and temperate environments may be less significant. More than half of the storms linked to moderate to extensive landsliding were topical disturbances such as hurricanes, tropical storms, tropical depressions, tropical waves or troughs, while 27% were associated with localized heavy rains or convective thunderstorms and 20% with winter cold fronts. Pando et al. (2005) updated the threshold developed in 1993 based on additional landslide data collected through 2003. They also presented a summary of literature published on rainfall induced landslides in Puerto Rico, and concluded that there is a lack of systematic research and analysis into the causes and consequences of slope stability problems. They recommended additional studies to account for geologic and topographic settings, failure types and land use.
In addition to studies in the two categories above, prior studies have also indicated that the frequency of landslides commonly increases near constructed highways and roads, particularly in mountainous regions. An extensive study of the relationship between roads
and landslides in Puerto Rico was conducted by Larsen and Parks (1997). Landslide frequencies were determined in relation to highways and major roads comprising a transportation network of 126 km through an area of 201 km of primarily humid-tropical, mountainous and forested terrain in the Luquillo Experiment Forest. The study
area generally was comprised of topographic and climatic conditions typical of rural Puerto Rico. The study considered a total of 1609 landslides, with an average landslide
length of around 30 m and a standard deviation of around 30 m. The impact of roads and highways were considered independently of other factors such as slope angle.
The study attempted to identify a "buffer" or "disturbance" zone in which there was a significant spatial association of landslides with roads and highways. This was
accomplished by studying the changes in historic landslide frequencies for a series of buffer zones created at specified distances perpendicular from the road. It found that historic landslide frequencies were five to eight times more frequent within 85 m of each
side of the road/highway.
This increased frequency of landslides was attributed in part to the frequent road maintenance required along these roads with high landslide frequencies. Because road crews often clear landslide debris from the main highway and dump it on the downslope
side of the highway, there is an increased weight on the hillslope that could result in hillslope steepening as well as an alteration of the runoff pathway (Larsen and Parks,
1997). Thus, the way that prior landslides are managed near roads and highways could play a role in propagating further landslides near those areas.
Available Data Set
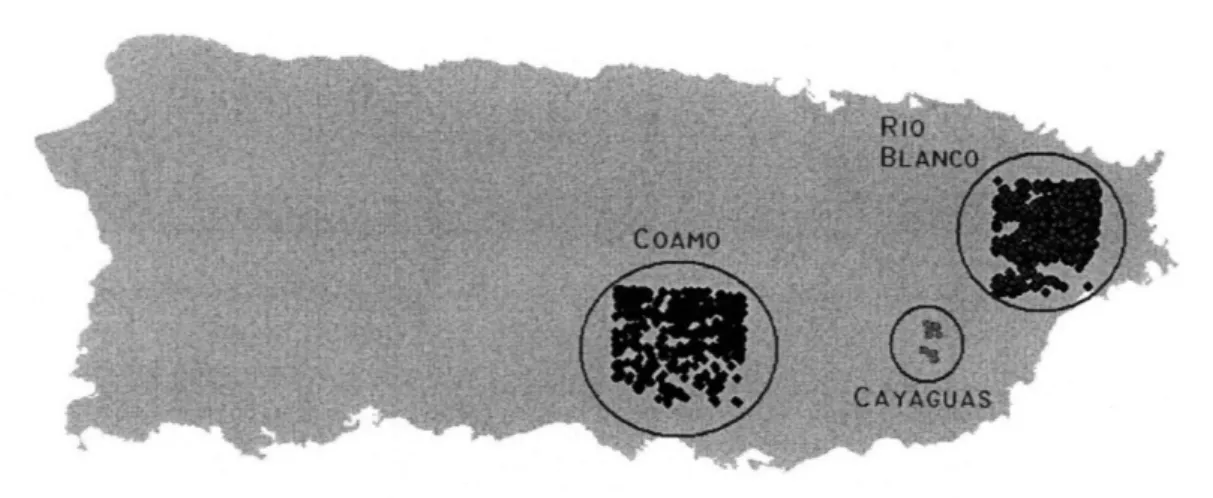
The data on landslides employed in this study was obtained from the United States Geological Survey (USGS) and includes data sets for the regions of Coamo (1024 landslides), Rio Blanco (1860 landslides) and Cayaguas (82 landslides). Thus, landslide data for a total of 2,966 landslides were employed. See Figure 2.1.
Figure 2.1: Data for 2,966 landslides in the Coamo, Cayaguas and Rio Blanco regions of Puerto Rico were employed in this study.
The landslide data provided by the USGS were derived through the use of 1:20,000 scale photographs dating from 1951 to 1990. Because larger landslides as old as 10 years were identifiable on these photographs (before being masked by vegetation), the data set reflects landslides over a period of about 50 years (Larsen 1998). Landslides were manually identified from these photographs based on observations such as a break in the
forest canopy, bare soil or other geomorphic characteristics typical of landslide scars. The lower limit of observation for this method is about 10 m by 10 m (Larsen 1998).
The landslide locations in the data set were depicted either as lines (for smaller landslide scars), as polygons (for larger landslide scars) or as points (for data in the Cayaguas region). The "length" (distance from the head scarp to the slope base) was recorded in the data set. The average landslide length in the dataset was around 25 m.
CHAPTER 3: METHODOLOGY
Overview
Using newly obtained data sets from the USGS, landslides in specified locations in Puerto Rico are characterized by four main parameters. These parameters are slope angle, slope aspect, elevation and land use. The purpose of such a characterization is to draw general conclusions about the relative hazard of landslides based on these parameters. The relative hazards of each parameter are combined to yield an overall "map" of landslide hazard.
Such an approach builds on previous landslide studies conducted in Puerto Rico, specifically Larsen et al. (1998) who developed a set of simplified matrices to relate landslide occurrence to slope angle, slope elevation, slope aspect and land use. The goal in such an approach is to infer and document conditions of the topography before the landslide (in other words, the pre-landslide conditions). Thus, this analysis is based on the premise that the likelihood of future landslides can be "predicted" by the pre-landslide conditions that have resulted in historic landslides.
There is one subtlety to note in this approach. For the sake of argument consider that an ant walking over a sand pile and causing a slope failure could also be considered a "landslide" at a small enough scale. Historically, landslides have likely occurred
everywhere on the earth's surface -but only specific landslides can be documented (i.e. those that are relatively recent and relatively large). The definition of a "landslide"
-which comes about both by our ability to detect it and by what is considered significant to society -ultimately drives the methodology employed to study them. In this study, the limits of observation for a landslide are about 10 m by 10 m - hence, a slide smaller than this is not detected and is effectively excluded from the definition of a "landslide" in the
context of this study.
Resolution of available data
Since the study conducted by Larsen et al. in 1998, Digital Elevation Models (DEMs) with much higher resolutions have become available. Larsen et al. based their work on a
180-m DEM. A DEM for the entire island is now available at 30 m, and DEMs for certain basins are available at 5 m. A DEM with a resolution of 5 m consists of grids that are 5 m by 5 m, with elevation specified for each grid. Thus, a 5-m DEM unit grid has an area of 25 m2 that is assigned the same elevation. A 30-m DEM, which is a unit grid with
an area of 900 m2, can thus hold 36 5-m DEM unit grids.
Through the use of mapping tools like ArcGIS, key aspects of the topography like slope angle, slope aspect and elevation can be determined at higher resolutions through the use of these DEMs.
While the grid sizes for the DEMs available today are at significantly higher resolutions than those employed by Larsen et al. (160 m), it is crucial that these DEMs are employed
appropriately when determining the values of parameters inferred from the DEM. A 160 m grid represents a fairly large unit grid (with an area of 25,600 m2). With the typical landslide in the data set having an area of around 1000 m2, there is clearly an opportunity
to employ the higher resolution DEMs to better infer the pre-landslide conditions. It is important to note that the 5-m and 30-m DEMs represent post-landslide conditions, while the approach taken in this study is concerned primarily with pre-landslide
conditions. Therefore, sampling the topographical features of a landslide at its
geographical location at the finest resolution available could capture local post-landslide effects. This point is illustrated and discussed further in the Landslide Truth Simulation section.
Furthermore - regardless of the availability of high resolution DEMs - there is expected
to be a "characteristic scale" below which sampling a landslide will cease to be accurate.
Landslide Truth Simulation
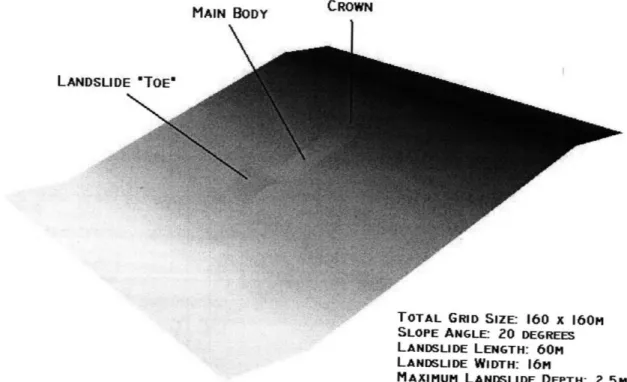
As part of this exercise, a "typical" landslide was simulated in ArcGIS by specifying elevations for each lm by lm cell in a synthetic 1-m DEM. This rotational landslide was attributed fairly typical values for landslides in the available data set. The landslide width was set at 16m, the landslide length at 60 m and the maximum depth at about 2.5 m. The slope upon which the landslide occurred was inclined at a slope angle of 20 degrees with an average elevation of 600 m. The land area modeled was a square 180 m long and 180 m wide. A 3D view of this simulated landslide is shown in Figure 3.1 below.
CROWN MAIN BODY
LANDSLIDE LENGTH: OOM
LANDSLIDE WIDTH: 16M
MAXIMUM LANDSLIDE DEPTH: 2.5m
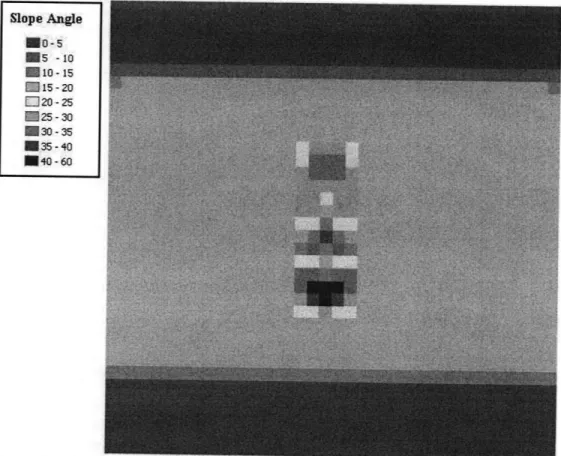
Slope angles for this 1-m DEM were calculated at resolutions of 1 m, 5 m and 30 m. Such a sampling process in ArcGIS averages all the smaller grid size values (i.e elevation values) contained in the larger grid, and assigns a single value to that larger grid, and then uses these new values to calculate corresponding slope angles.
Figures 3.2 through 3.4 depict the slope angles calculated using grid sizes of 1 m, 5 m and 30 m. In the dataset used in the this, if a landslide were to be depicted by a single point (i.e. the "centroid" of the landslide), it becomes clear that the landslide could be
assigned a range of slope angle values depending on the exact location of this centroid relative to the landslide. Thus, a process that would automatically sample slope angle at the highest resolution available would not allow for an effective determination of pre-landslide slope angle values.
In addition, border effects were observed in the 5 m and 30 m grids. These come about
because the grids at the borders of the DEMs have fewer cells neighboring them compared to the other grids in the DEM. These effects become more pronounced (i.e. cover a larger area) at higher grid sizes. Refer to Figures 3.3 and 3.4.
Slope Angle ES -10 10o--15 •15- 20 020- 25 *25-30 M30-35 s35 -40 N 40 -60
rigure 3.2: 1 m slope angle grid - derived trom landslide truth DEM.
Slope Angle m0-5 5 -10 10o. 15 E: 15- 20 J 20- 25 125- 30 30 -35 035- 40 040-60 igure 3.3: 5 im Slope Angle 5s - 20
020-25
25 -30 30 -35 035- 40 540-60Sslope angle grid - derived from landslide truth DEM.
Figure 3.4: 30 m slope angle grid - derived from landslide truth DEM. F
The landslide truth simulation suggested two courses of action to ensure that determined parameters such as the slope angle are representative of the pre-landslide conditions:
1. Ensuring that border effects do not bias the results.
Border effects can bias slope angle values due to the averaging methodology used by ArcGIS, which looks at values of the eight grids immediately surrounding a particular grid to determine the value assigned to that particular grid. At the borders, where there are less than eight grids surrounding a particular grid, the values of the grids that are present are weighed more heavily than normal. Thus, the data analysis technique must ensure that such border effects for landslide points near the border of the DEM do not bias results.
2. Ensuring that the scale at which parameters such as slope angle are determined is appropriate.
For example, if a landslide has a width of 60 m, it is not practical or appropriate to simply use a single, averaged 30 m by 30 m grid to determine the pre-landslide slope angle. At the same time, neither is it appropriate to use a 160 m by a 160 m grid, since more detailed information may be available at finer resolutions. This suggests that the determination of slope angle (and similarly slope aspect) may not be effectively accomplished through the uniform application of traditional sampling and surface analysis tools available with ArcGIS.
The data set employed in this study represents landslides as distinct points (centered at the head of the feature). For the majority of the dataset available at 5 m resolution, these points are accompanied by either lines (for smaller scars) or polygons (for larger scars). Based on the results from the truth analysis, a data sampling technique was developed in which slope angle and slope aspect were manually determined from the available 5-m DEM and landslide data. This manual procedure is discussed further in the "Data Analysis Techniques" section that follows.
Note that the two issues identified above do not influence the Elevation and Land Use parameters, which were sampled for a wider dataset using the 30-m DEM. While the elevation values assigned in the 5-m DEM and the 30-m DEM were different, this difference was not significant enough to influence the results and conclusions. The sampling resolution was not an issue with land use, since the land use data was available as a map layer with delineated areas represented as 100 m by 100 m grids.
Characteristic Scale
This section expands on the landslide truth simulation discussed above and discusses the characteristic scale of a landslide and how it affects the data analysis.
As discussed in Section 2, the limit of observation for landslides inferred from 1:20,000 aerial photographs was around 10 m by 10 m, while the average landslide length in the complete dataset was about 23 m long and about 17 m wide. Thus, smaller slides
occurring at a scale of a few meters would be excluded from this analysis. Effectively, it is this limit of observation that provides a definition for what a "landslide" is in the
context of this study.
As a thought experiment, consider that an ant walking on a sand pile causes a disturbance that, at an appropriate scale (perhaps a few centimeters), would be considered a
"landslide". Further suppose that it was possible to obtain a DEM for Puerto Rico at a scale of a few centimeters and hence determine a slope angle at that scale as well. At a resolution of a few centimeters there may be several areas that show a very high slope angle (and hence, a potentially higher susceptibility to landslides). But, the resolution is so much smaller than the characteristic scale of actual landslides in this dataset that a characterization of those areas as having a "high" hazard of landslides is not accurate. Even if there were to be an unstable slope that resulted in a landslide on that magnitude, it would not be captured by this study or be significant to society. Thus, there would be some point at which the resolution of the data would be below the characteristic scale of the landslide, and hence inappropriate for this study.
This thought experiment can be extended to the 5-m DEM employed in this study. While the 5-m DEM does allow for a more detailed analysis of areas where landslides have occurred, it may be inappropriate to simply sample landslide (and conversely "non-landslide" or normalization) data at that scale since the average length and width of the landslides we are looking at are significantly greater than 5 m.
Data Analysis Techniques
The entire collection of DEM data obtained from the USGS was divided into two main datasets - those for areas for which 5-m DEMs are available, and those for which 30-m DEMs are available. Each of these datasets was analyzed using different methodologies.
Dataset A: Slope Angle and Slope Aspect
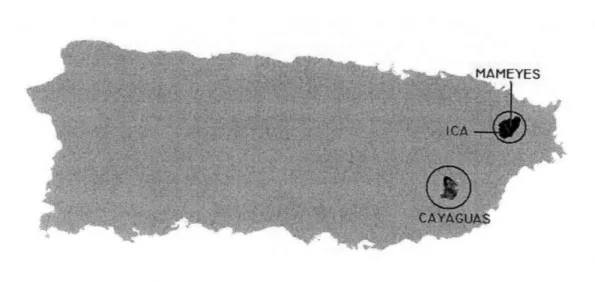
This data set (consisting of 366 landslides) was used to study the correlation of historic landslides with slope angle and slope aspect. Slope angle and slope aspect, both of which can vary substantially over small distances, were determined exclusively from maps generated from the 5-m DEMs. These included the Ica, Mameyes and Cayaguas basins as delineated in Figure 3.5 below. Note that the Ica and Mameyes basins both fall into the general region of Rio Blanco as shown in Figure 2.1.
Figure 3.5: Dataset A consists of 366 landslides in the regions of Cayaguas, Ica and Mamayes.
The slope angle values were determined by a manual inspection of historic landslide scars in Dataset A using the 5-m DEM. As mentioned previously, landslide scars that have relatively short widths are represented as lines while those with larger widths are represented as polygons. The landslides in Dataset A were mapped from the crown of the landslide feature to the toe, thereby encompassing the entire length of the slide.
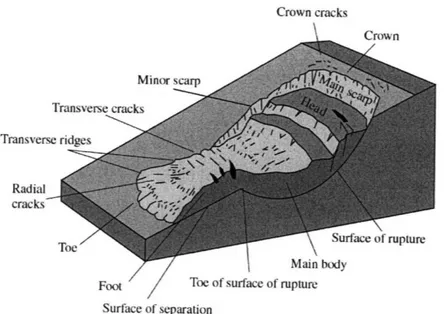
Highland (2004) illustrates a typical landslide and its major features. This figure is reproduced as Figure 3.6. As seen in Figure 3.6, a typical landslide has a surface of rupture (located towards the crown of the feature) from which mass has been removed during the landslide. This mass is deposited on the surface of separation (located towards the toe of the feature). The slip failure resulting in the landslide is located at some point along this surface of rupture, which occurs on the upper portion of the landslide near the crown.
Crown cracks
Prnv n
Transvers
Radial cracks
Foot Toe of surface of rupture Surface of separation
Figure 3.6: Features of a typical landslide, reproduced from Highland (2004). The slope angle and slope aspect were determined by manual inspection around the landslide locations. Firstly, the general direction of the landslide was determined by looking at the elevation trends around the mapped landslide. Typically, the direction of the slide was fairly clear based on the landslide outline and the corresponding elevation gradient. Once the two-dimensional extent of the landslide was established in this way, the slope angle was determined based on measurements a few meters just outside the horizontal extent of the landslides in the "upper" half of the slides.
The manual procedure described above attempts to sample landslide data at a scale of measurement appropriate to the characteristic scale of the landslide, and recognizes that simply sampling data at the finest resolution available (i.e. 5 m) or at the center of the landslide may not be representative of the slope conditions that resulted in the landslide.
Dataset B: Elevation and Land Use
Dataset B (consisting of 2,966 landslides) was a broader data set that included Dataset A but also considered additional landslides in the Rio Blanco region as well as landslides in the Coamo region. This expanded dataset was used to analyze the correlation of historic landslides with elevation and land use. Dataset B comprises all landslide data used in this study, and is depicted in Figure 2.1 in the previous chapter.
The land use data was generated by combining a land use layer from the USGS National Atlas Land Use dataset (The National Map Seamless Server) and road layers obtained from the TIGER (Topologically Integrated Geographic Encoding and Referencing) data base (Census 2000 TIGER/Line Data). The land use layer was represented as 100-m grids and was divided into the following categories for the island: Urban and Built Up Land; Dryland Cropland and Pasture; Grassland; Savanna; Evergreen Needleleaf Forest; Herbaceous Wetland and Wooded Wetland. These categories were generalized into "Forest" (which included Grassland, Savanna, Evergreen Needleleaf Forest, Herbaceous
Wetland and Wooded Wetland) and "Pasture" (which included Dryland Cropland and Pasture) for the purposes of this study. The different road layers for each region were merged into one road layer for the entire island.
Previous work on landslides has determined that there is a "mass-wasting zone"
associated with constructed highways and roads that result in so-called road-associated landslides (Varnes 1996). Larsen (1996) used landslide data for the Luquillo
Experimental Forest (largely located in the Rio Blanco region) to estimate a buffer or disturbance zone in which the occurrence of a landslide could be the linked to the presence of a road. Buffer zones of different widths, ranging from 5 m to 400 m
(measured perpendicular to the road) were employed in the study. The results suggested that at distances of 85 m or less on either side of the road, there was an appreciable increase in mass-wasting disturbance rate (five to eight times). Larsen concluded that a buffer zone of 85 m (i.e. a swath of 170 m) appeared to be an appropriate representation for a zone with road-associated landslides.
Based on the results from Larsen (1996), the width of roads in this land use analysis was increased to 85 m on each side. This new, buffered road layer was then overlain on the land use layer, and all areas of overlap between these two layers were replaced by the road layer. In this way, a new land use layer incorporating roads was created and employed for this study.
A summary of both Datasets A and B are presented in Appendix A.
Categorization Analysis and Relative Hazard
Once the four parameters (elevation, slope aspect, slope angle and land use) were obtained for each landslide using the methodology described above, the results were organized into different "bins". The bin categories for each parameter are listed below: Elevation: 0 - 200 m, 200 - 400 m, 400 - 600 m, 600 - 800 m, 800+ m
Slope Aspect: North, Northeast, East, Southeast, South, Southwest, West, Northwest Slope Angle: 0 - 50, 5 - 100, 10 - 150, 15 - 200, 20 - 250, 25 - 300, 30 - 350, 35 - 400 and 40 - 600.
Land use: Forest, Roads/Structures, Pasture/Agriculture
Once the number of landslides occurring in each "bin" was determined, this number was normalized by the land area corresponding to that bin value to obtain a normalized value in units of landslides per km2. For example, if 50 landslides occurred where the slope
aspect faced north, this frequency would be normalized by the total area where the slope aspect faced north. If the total area with a slope aspect of north was 25 km2, the
normalized frequency was determined to be 2 landslides per km2.
The areas that were used to normalize the data were based on the 30-m DEM. While it was possible to normalize the data using the 5-m DEM for Dataset A, this approach may not be accurate since it would be below the characteristic scale of the landslide. This
process of normalization, which greatly influences the results and the perceived hazard, is discussed further in the "Results" section.
By normalizing the landslide frequencies in each bin as described above, it became possible to directly compare values across different bins by computing normalized percentages for the landslides in each bin.
Finally, a relative hazard value was calculated based on the normalized percentages. The bin with the lowest value of normalized percentage was assigned a hazard value of 1, and all other bins were assigned a hazard scaled appropriately relative to this value of 1. In this way, relative hazard values were calculated for each parameter.
Weights of Different Parameters
Once relative hazard values for each bin within a parameter were determined, each parameter had to be assigned a relative weight for the overall landslide hazard map. While there is no obvious methodology to assign relative weights to parameters as distinct as slope angle and land use, one could infer that parameters where relative hazard varies more drastically across different bins are likely more significant than parameters where the relative hazard across the different bins are less varied.
Thus, the approach taken in this study is to calculate the ratio of the highest relative hazard bin value to the lowest relative hazard bin value for each parameter. This ratio, which effectively represents the range of hazard for each parameter, was in turn used to assign a weight to each parameter.
Development of Hazard Map
The 30-m DEM for the entire island of Puerto Rico was used to obtain overlays for elevation, slope angle and slope aspect. Overlays for land use were obtained from the
USGS National Atlas land use dataset as 100 m by 100 m grids (The National Map
Seamless Server). This land use layer was fairly coarse and did not account for roads; data for roads was obtained from the TIGER Census 2000 database (Census 2000 TIGER/Line Data).
For each parameter, data for the entire island of Puerto Rico was divided into bins similar to those used for the relative hazard determination. Based on the relative hazard of each bin and the weight of each parameter, an overall hazard map for Puerto Rico was generated.
The actual development of the map involved a process analogous to a multi-factorial analysis. Firstly, a relative hazard for each bin within each parameter was determined based on the results from the categorization analysis. The result was a set of relative hazards, one value per parameter. This was accomplished through the use of the ArcGIS
"Reclassify" tool. Next, each of the parameters (i.e. slope angle, elevation, slope aspect and land use) was assigned a weight relative to the other parameters. This weight
assigned to each parameter was based on the range of relative hazard observed within each parameter. Refer to Chapter 4 for an example calculation of the parameter weight. The logic behind weighing the parameter according to its range of relative hazard was that parameters that exhibited a high variability in hazard were more significant than parameters that did not exhibit a high variability. The ArcGIS "Raster Calculator" tool was employed to assign weights to each parameter's hazard. Finally, the weighed hazard
CHAPTER 4: RESULTS
Summary
The results for each of the four parameters (elevation, slope aspect, slope angle and land use) as well as their integration into the overall hazard map are presented in this section. The results for elevation and slope aspect were generally consistent with results from previous studies in Puerto Rico. There was a marked increase in landslide hazard (by a factor of about two) for elevations above 200 m. For slope aspect, the relative hazard was generally higher in slopes facing the prevailing winds. The land use results indicated that landslide hazards only slightly increased for roads/structures and agriculture/pasture when compared to forest areas. This is very different from the results obtained by Larsen et al. in 1998, who found an appreciable increase in landslide hazard for roads/structures as opposed to forest and agriculture/pasture land use. This difference may be attributable to an explicit road buffer applied in this study. The slope angle analysis indicated a high variability and range of hazard. While the trend of a higher hazard with a higher slope angle is consistent with the findings by Larsen et al., the range of the relative hazard is far more dramatic. Because the slope angle analysis employed in this study is very sensitive to the resolution of the DEM and the normalization procedure involved, it prompts a discussion about the appropriate resolution and "characteristic scale" of a landslide.
Elevation
Based on historic landslide occurrences for Dataset B examined on a 30-m DEM, the relative landslide hazard was found to increase appreciably at elevations greater than 200 m. Elevation bins greater than 200 m were all found to be roughly twice as likely to have landslides when compared to elevations less than 200 m. The relative hazard values are depicted in Figure 4.1.
Figure 4.1: The relative landslide hazard increases significantly after the 0 - 200 m bin but is relatively constant across subsequent bins
These results are generally consistent with those obtained by Larsen et al. in 1998. As part of the study, Larsen at al. looked at relative landslide frequencies for the Blanco and Coamo regions. For the Blanco region, the normalized frequency of landslides in
hillslopes with elevations greater than 400 m was 1.4 times that for elevations lower than 400 m. For Coamo, the normalized frequency of landslides on hillslopes with elevations greater than 300 m was 2.4 times that for elevations lower than 300 m.
The study by Larsen et al. suggests that an appropriate elevation cut-off for regions that have a significantly higher landslide hazard is 300 m or 400 m. While the results above appear to suggest that a cut-off closer to 200 m may be more appropriate, this could be an artifact of the bins employed to group the landslides. It is possible that a more appropriate elevation cut-off actually occurs somewhere inside the 200 -400 m bin.
Larsen et al. suggested that the increase in landslide frequency with increasing elevation occurs due to a greater mean annual rainfall and higher soil moisture (resulting from lower evapotranspiration losses due to cloud cover) at higher elevations. In addition, they suggested that geologic and land use factors were also likely related to this higher
landslide frequency.
For a summary of the data used for the elevation analysis, refer to Appendix A.
Slope Aspect
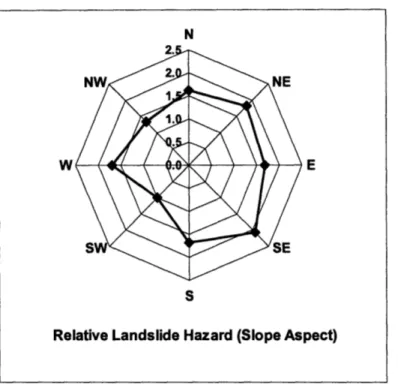
Slope aspect values were determined by a manual inspection of historic landslide scars in Dataset A using the 5-m DEM. As shown in Figure 4.2, this analysis revealed that the relative landslide hazard was slightly higher for slopes facing the prevailing trade winds
Relative Landslide Hazard
(Elevation) 0.0 0.5 1.0 1.5 2.0 2.5 Hazard
I
U
800 + E 600-800 .2 400-600 i 200-400 u0200 0-200 1111 11 II ' I -L II LCrrlll II rl · ~~ T-~cla Ih 'UI I -' I I _II_ I ~~II ~LI ILIl · 112that are dominantly from the east and northeast, and higher for slopes facing the south and southeast. Refer to Appendix A for a summary of the data used for the slope aspect analysis.
Figure 4.2: Relative landslide hazard varies slightly with the slope aspect, which is likely due to the direction of the prevailing trade winds.
These results are generally consistent with the results in Larsen at al. (1998). Larsen et al. found that the normalized frequency of landslides was found to be 2.3 times greater for hillslopes facing the prevailing winds than for hillslopes not facing the prevailing winds. The frequency of landslides was found to be lowest on those slopes facing the southwest,
west and northwest. Larsen et al. (1998) attributed this increase to the fact that rainfall is delivered to Puerto Rico by trade winds that are dominantly from the east and northeast. This is depicted in Figure 4.3 (reproduced from Larsen et al. 1998).
E
... San Juan - ýoba
Figure 4.3: Mean daily trade wind direction, reproduced from Larsen et al. (1998), shows that trade winds at the cities of San Juan and Ceba occur dominantly from the east and northeast.
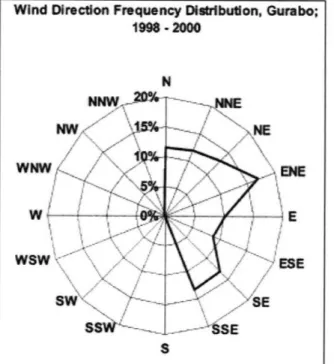
Altaii et al. (2003) also studied wind profiles in four parts of the island (Aguadilla, Gurabo, Ponce and San Juan) and noted that the predominant distributions of wind fall in the sectors between 00 north to almost 1800 south clockwise, while the frequency of wind coming from 1800 south to 00 north clockwise was "insignificant." The wind direction frequency for Gurabo, an inland site located very close to the areas used in Dataset A, is reproduced from Altaii et al. in Figure 4.4.
Figure 4.4: The wind direction frequency distribution for the inland site of Gurabo, an inlet site close to the regions in Dataset A. Reproduced from Altaii et al. (2003).
Wind Direction Frequency DItbibution, Gumrabo;
198 -2000 WNY W WSv
WO
, 'n, E .METhe wind direction frequency in Figure 4.4 depicts a significant frequency of winds from the southeast and south-southeast direction, which could be responsible for the higher relative hazard observed for winds originating in the south and southeast in Figure 4.2. Previous studies have shown that watersheds facing the trade winds exhibit greater runoff than those that do not (Dias et al., 1994) and that the majority of historic
landslide-triggering storms generally approach the island from the east (Larsen 1993). The dataset used to determine the relative hazards for aspect consists of landslides generally located inland and on the eastern half of the island. Altaii et al. (2003)
determined that the wind frequency in two coastal cities on the western half of the island (Aguadilla and Ponce) also generally occur from the east and northeast directions. While it is possible that the effect of these trade winds may be somewhat subdued in the inland regions of the western half of the island, the relative hazard for aspect is expected to be generally consistent for a large part of the island based on the typical wind speed
frequencies determined by Larsen (1998) and Altaii et al. (2003). In addition, the range in relative hazard for Puerto Rico is ultimately far less significant than the slope angle. For the purposes of this study, the overall hazard map is not expected to be appreciably biased by this regional variability in trade winds over the island.
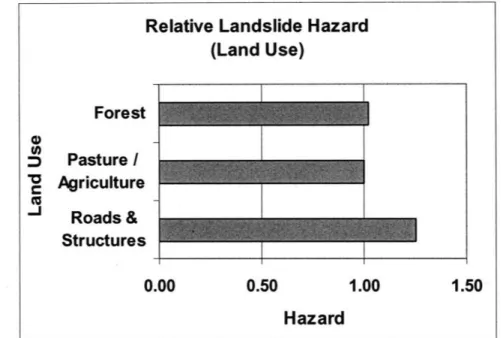
Land Use
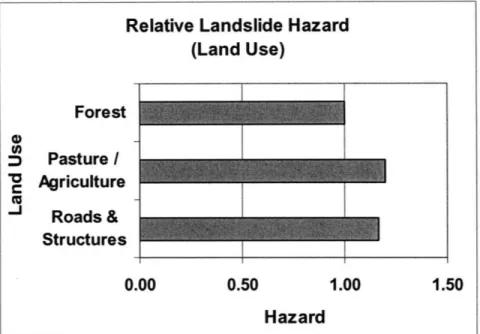
The relative landslide hazard associated with land use was determined from Dataset A and a land use GIS map which incorporated major roads in Puerto Rico with a 100 m by 100 m grid size map obtained from the USGS National Atlas data set (The National Map Seamless Server). The analysis, whose results are shown in Figure 4.5, suggests that the relative hazard does not change appreciably for the different land uses. The relative landslide hazard for lands associated with roads and structures and pasture / agriculture is marginally higher than for lands associated with forests.
Figure 4.5: The relative landslide hazard does not vary appreciably with different land uses. Note that roads are buffered to 85 m on each side.
These results are significantly different from those found by Larsen at al. (1998), which found a more pronounced impact of land use on historic landslide frequencies. Larsen et al. found that the relative frequency of landslides was 2.3 to 8.4 times higher for areas in which land was used for roads and structures as opposed to land attributed to forest or pasture / agriculture. The land use dataset employed by Larsen et al. was digitized from
1:20,000 scale maps and that study employed a grid spacing of approximately 180 m by 180 m. Larsen et al. determined the land use attributes for each grid from unpublished Puerto Rico Department of Natural and Environmental Resources maps made in 1977. Larsen et al. classified the land use into broader categories, either as forest or agricultural land use. Landslides found in a cell corresponding to forest or agriculture were assigned to that category, but were reassigned to a road if they were found to intersect a separate road layer. There is no indication to suggest that the roads used in Larsen et al.'s analysis were "buffered", which means that the landslides attributed to roads were those that directly intersected the 10-m road width.
There are a couple of differences between this study and the study by Larsen et al. Firstly, different land use datasets at different resolutions were employed to assign land use. Another difference is how the landslides in each study are assigned to a "road' land use. Following Larsen and Parks (1997), this study employs a road layer buffered to 85 m on each side (i.e. a 170 m swath) which results in about one-third of the total area of Dataset A being assigned to roads. While this also means that more landslides points are now associated with roads, it is possible that the increase in the area of roads (by which these landslides are normalized) is proportionally much greater than the increase in the number of landslide points associated with roads. Larsen et al., on the other hand, did not
explicitly account for a buffer but did reassign land use categories to roads if a road layer was found
Relative Landslide Hazard (Land Use)
Forest
Pasture / M Agriculture "J Roads & Structures 0.00 0.50 1.00 1.50 Hazardi
The analysis in this study was repeated employing a road layer buffer to 40 m on each side, in order to gauge the sensitivity of the hazard representation on the road buffer width. Results are shown in Figure 4.6. While the use of a 40-m road buffer indicates that the highest relative hazard occurs for roads and structures, the relative hazard values are again very close to 1 and do not indicate high variability with land use.
Figure 4.6: The relative landslide hazard indicates a and structures when a 40-m road buffer is applied.
slight increase in hazard for roads
For a summary of the data used for the land use analysis, refer to Appendix A. Slope Angle
The slope angle analysis is particularly sensitive to the methodology employed at
landslide locations and the resolution of the dataset employed for the area normalization. In several areas, the slope angle values were observed to vary significantly between neighboring 5-m DEM cells. This variation in slope angle was significantly more
pronounced than the variation in slope aspect, which was the other parameter inferred at the 5-m DEM.
Determination of slope angle at landslide locations
As discussed in Chapter 3, the slope angle values were determined by manual inspection of historic landslide scars in Dataset A using the 5-m DEM. This manual analysis
involved examining the trend of elevation along and adjacent to the slide and determining a representative slope angle value from the slope angles located closer to the "crown" of the landslide. This procedure attempted to capture the slope angle on the surface of rupture, which is the likely location of the slope failure that led to the landslide.
Relative Landslide Hazard (Land Use) Forest 5 Pasture / V Agriculture "J Roads & Structures 0.00 0.50 1.00 1.50 Hazard
This procedure effectively employed a fraction of the total length of the slide (perhaps one fourth to one third of the total length). Based on the average landslide length of 65 m, this corresponds to a distance of about 16 to 22 m. Similarly, the horizontal distance considered extended a few meters on either side of the horizontal extent of the landslide. Based on the average landslide width of 16 m, this corresponds to a distance of around 26 to 36 m.
Another way to infer the slope angle is to simply sample the slope angle value at the centers of the landslide locations superimposed on the 5-m and 30-m DEMs. Based on the results of the landslide truth analysis discussed previously, it is clear that sampling the slope angle values in this way would lead to significantly different slope angle values depending on which grid the center of the landslide happened to lie in. In addition, because this approach would sample slope angle in the center of the landslides, it is not expected to capture the pre-landslide slope conditions existing on the surface of rupture (where the slope failure likely occurred).
A comparison of the landslide tabulation from this manual procedure to the landslide tabulation from an automatic (i.e. employing the ArcGIS Surface Analysis Slope Angle tool) sampling procedure (at both 5-m and 30-m DEMs) indicated that the manual procedure tended to identify slope angle values that were 4.50 (5-m DEM) to 6.70 (30-m DEM) steeper. As shown in Figure 4.5, the manually determined slope angle values were, on average, appreciably higher than those that would be inferred from the DEMs at the landslide's center location. Note that the y-intercepts for each line were set to go through the origin.