HAL Id: hal-02141544
https://hal.archives-ouvertes.fr/hal-02141544
Submitted on 28 May 2019
HAL is a multi-disciplinary open access
archive for the deposit and dissemination of
sci-entific research documents, whether they are
pub-lished or not. The documents may come from
teaching and research institutions in France or
abroad, or from public or private research centers.
L’archive ouverte pluridisciplinaire HAL, est
destinée au dépôt et à la diffusion de documents
scientifiques de niveau recherche, publiés ou non,
émanant des établissements d’enseignement et de
recherche français ou étrangers, des laboratoires
publics ou privés.
Influence of temperature and pearl rotation on
biomineralization in the pearl oyster, Pinctada
margaritifera
Gilles Le Moullac, Lucie Schuck, Sébastien Chabrier, Corinne Belliard, Pierre
Lyonnard, Floriane Broustal, Claude Soyez, Denis Saulnier, Chloé Brahmi,
Chin-Long Ky, et al.
To cite this version:
Gilles Le Moullac, Lucie Schuck, Sébastien Chabrier, Corinne Belliard, Pierre Lyonnard, et al..
Influ-ence of temperature and pearl rotation on biomineralization in the pearl oyster, Pinctada margaritifera.
Journal of Experimental Biology, Cambridge University Press, 2018, 221 (18), �10.1242/jeb.186858�.
�hal-02141544�
RESEARCH ARTICLE
Influence of temperature and pearl rotation on biomineralization in
the pearl oyster, Pinctada margaritifera
Gilles Le Moullac1,*, Lucie Schuck1, Sébastien Chabrier2, Corinne Belliard1, Pierre Lyonnard1,
Floriane Broustal1, Claude Soyez1, Denis Saulnier1, Chloé Brahmi3, Chin-Long Ky1and Benoit Beliaeff1
ABSTRACT
The objective of this study was to observe the impact of temperature on pearl formation using an integrative approach describing the rotation of the pearls, the rate of nacre deposition, the thickness of the aragonite tablets and the biomineralizing potential of the pearl sac tissue though the expression level of some key genes. Fifty pearl oysters were grafted with magnetized nuclei to allow the rotation of the pearls to be described. Four months later, 32 of these pearl oysters were exposed to four temperatures (22, 26, 30 and 34°C) for 2 weeks. Results showed that the rotation speed differed according to the movement direction: pearls with axial movement had a significantly higher rotation speed than those with random movement. Pearl growth rate was influenced by temperature, with a maximum between 26 and 30°C but almost no growth at 34°C. Lastly, among the nine genes implicated in the biomineralization process, only Pmarg-Pif177 expression was significantly modified by temperature. These results showed that the rotation speed of the pearls was not linked to pearl growth or to the expression profiles of biomineralizing genes targeted in this study. On the basis of our results, we consider that pearl rotation is a more complex process than formerly thought. Mechanisms involved could include a strong environmental forcing in immediate proximity to the pearl. Another implication of our findings is that, in the context of ocean warming, pearl growth and quality can be expected to decrease in pearl oysters exposed to temperatures above 30°C.
KEY WORDS: Magnetometer, Rotation speed, Nacre growth, Nacre thickness, Gene expression, Pmarg-Pif177
INTRODUCTION
Pinctada margaritifera is a filter-feeding bivalve that inhabits the lagoons of islands and atolls in the Indian and Pacific Oceans (Yukihira et al., 2006), where it grows between 10 and 50 m depth (Andréfouët et al., 2016; Zanini and Salvat, 2000). This species is used to produce cultured pearls. As natural pearls are scarce, the deliberate introduction of a foreign body can be performed to stimulate the formation of nacre, also known as mother-of-pearl (Jameson, 1902). Cultured pearls are produced from a grafting operation, during which a small piece of mantle tissue from a donor oyster (the graft) is put in the gonad of the recipient oyster together
with a nacre bead, the nucleus (Wada, 1999). Once inserted into the recipient oyster, the outer epithelium cells of the graft multiply and form a pearl sac around the nucleus. The pearl sac then starts to deposit nacre (aragonite) layers onto the nucleus. This is the starting point of the future pearl. A rearing period of approximately 18 months is then needed to produce a pearl with a sufficiently thick layer of nacre for sale (Gueguen et al., 2013).
The cells of the pearl sac will deposit mother-of-pearl continuously on the nucleus, leading to the formation of the pearl by the superimposition of mother-of-pearl layers around the nucleus at a rate of 3 to 4 per day (Caseiro, 1995; Linard et al., 2011). Pearls can have a spherical, drop or baroque (irregular) shape, as well as varying colour and size (Cartwright et al., 2013). Mother-of-pearl is a structure dominated by aragonite, a form of polymorphic CaCO3.
It has been shown that mature aragonite tablets are arranged in layers with an interlamellar matrix between them made up of proteins and carboxylates. These tablets grow according to a process of nucleation, which reveals the first crystalline germs of a solid phase, called nuclei, and crystallization, which isolates these crystalline germs in the form of crystals.
Growth fronts of nacre, equivalent to those found on the inner shells of pearl oysters, can be observed at a microscopic scale on the surface of the pearl and may take the form of spirals or targets (Cartwright et al., 2013). These lines, which resemble fingerprints, correspond to the growth fronts of nacre layers and suggest that the pearl moves within the pearl sac. Caseiro (1995) mentions the idea of specific types of movement corresponding to different pearl shapes. Cartwright et al. (2013) put forward a theory of pearl rotation, explaining how forces at work during the deposit of aragonite tablets would lead to a particular type of pearl movement. The layers of aragonite oriented in specific directions on the surface would give momentum to the pearl during the growth of its layers, thus causing movement. Once activated, a dynamic mechanism would become established and different rotational movements could appear depending on whether a defect was present. Defects may hinder rotation, resulting in axial rotation. Evidence of pearl rotation in the pearl sac in P. margaritifera was obtained using an electromagnetic system recording the change of position of a magnet inserted into the nucleus in a grafted pearl oyster (Gueguen et al., 2015). The mathematical analysis showed that pearls rotate in the pearl sac from the moment the pearl sac is closed and functional. The type of movement has thus been shown to be associated with pearl shape and defects. However, only a few descriptions of this movement are available.
Temperature has a significant impact on the physiological processes of the pearl oyster P. margaritifera (Le Moullac et al., 2016; Yukihira et al., 2000). It has been shown that shell growth and biomineralization are directly controlled by temperature (Joubert et al., 2014). The impact of temperature on pearl formation has also been studied in P. fucata (Muhammad et al., 2017), showing in situ
Received 19 June 2018; Accepted 25 July 2018
1Ifremer, UMR EIO 241, Labex Corail, Centre du Pacifique, BP 49, 98719 Taravao,
Tahiti, French Polynesia.2Université de Polynésie Française, laboratoire
GEPASUD, BP 6570, 98702 Faa’a, Tahiti, French Polynesia.3Université de
Polynésie Française, UMR EIO 241, Labex Corail, BP 6570, 98702 Faa’a, Tahiti, French Polynesia.
*Author for correspondence (gilles.le.moullac@ifremer.fr) G.L., 0000-0003-3749-8239
Journal
of
Experimental
that the growth of pearls in this species accelerates in summer and slows down in winter, whereas in P. margaritifera, pearl growth was seen to be faster at 30°C than at 22°C (Latchère et al., 2018). The present study examines the question of whether a broader range of temperature influences pearl formation acting on pearl rotation, and how this impacts the molecular functioning of the pearl sac, nacre deposition rate and aragonite microstructure. To examine these questions in the present study, grafted pearl oysters with magnetized nuclei were subjected to four temperatures (22, 26, 30 and 34°C).
MATERIALS AND METHODS Preparation of pearl oysters
Pearl oysters [Pinctada margaritifera (Linnaeus 1758)] used for the experiment were collected from the wild as juveniles and cultured on long lines at a commercial pearl farm (Pahai Poe Pearl Farm) on the atoll of Apataki (15°26′45″S, 146°19′53″W), Tuamotu archipelago, French Polynesia. Fifty pearl oysters were grafted by a professional expert grafter under the same conditions as for a commercial graft but inserting a magnetic nucleus. The nuclei (6.6 mm diameter, Imai Seikaku Co. Ltd, Sumoto, Japan) were made from the shells of the freshwater mussel Amblema sp. Each was previously pierced to insert a 5-mm cylindrical neodymium magnet (Supermagnete, Gottmadingen, Germany). The magnet was inserted so that the centre of gravity of the nucleus was identical to that of the magnet. Dental resin was then used to close the hole, which was then polished. After grafting, the pearl oysters were placed in the Apataki lagoon to observe the nucleus retention. For this, they were placed in separate subdivisions in transparent retention bags (10 oysters per retention bag) with their hinges facing upwards so that the nucleus could not slip out of place owing to the pull of gravity. At 45 days post-grafting, the oysters were checked for nucleus retention, as previously described in Ky et al. (2014). Thirty-five of the oysters had retained their nuclei at this point and were transferred by plane in cooled iceboxes to the Ifremer facilities in Vairao (Tahiti, French Polynesia), where they were acclimated in the lagoon at a mean temperature of 28.0±0.2°C and reared in the lagoon for 2 months prior to the temperature exposition and rotation measurements, which were conducted in tanks.
Experimental design
The exposure for 2 weeks of two pearl oysters at each of the four temperatures (22, 26, 30 and 34°C) was repeated four times. The first 7 days comprised a simple acclimation to the temperature and the following 7 days were devoted to recording the movements of the pearl by the magnetometer, at the same temperature. For each of the temperatures tested, pearl oysters were randomly selected in twos and simultaneously acclimated for 1 week in a tank (98×50×16 cm, length×width×depth) at the desired temperature. The following week, the pearl oysters were moved into two separate tanks (49×50×16 cm, length×width×depth), each equipped with a magnetometer to acquire rotation data, as previously described by Gueguen et al. (2015). The experiment tested a total of 32 pearl oysters of 148.1±27.9 g mass and 10.4±0.9 cm height (means±s.d.) in this way. The pearl oysters were randomly assigned to each temperature. The seawater of the acclimation tank was renewed at a rate of 800 ml min−1and that of each of the two magnetometer tanks was renewed at a rate of 400 ml min−1. The pearl oysters were fed continuously with a mixture of microalgae composed of Isochrysis lutea and Chaetoceros gracilis at a concentration of 30 cell µl−1in each of the tanks. The microalgae concentration in the experimental tanks was monitored daily.
Magnetometer and pearl rotation data management
The magnetometer used in this study is made of three main connected parts. The measuring part is a dome with sensors. The dome is a half-sphere of acrylic glass (diameter 20 cm) on which are set 25 magnetic sensors consisting of two components, the HMC1021 compass from Honeywell (a one-axis magnetic sensor) and an offset compensation circuit. Twenty-four of the 25 sensors are spread across the convex surface of the dome in three circles of eight elements at 0, 30 and 60 deg angles with the base. The last sensor is located at the top of the dome at 90 deg. Each sensor is glued on the dome with a cyanoacrylate paste and protected from impacts and water by an acrylic glass tube. The electrical part of the magnetometer is composed of a data acquisition board with 26 RJ45 sockets (25 are used to connect the cables from the sensors and the last to make the ethernet connection with the computer) and 25 wiring cables, each of which ends in a RJ45 plug. The human– machine interface (HMI) is a program called‘magneto’, developed by VEGA Industrie (Avrainville, France), which is composed of two parts. The first of these is a microcontroller that uses internal software to collect, process and transfer data to the second part of the HMI. This second part, on the computer, is the software (magneto-magnetometer interface 1.0) that collects data from the microcontroller, allows data to be collected from real-time sensors and produces visualized data, thus tracking the acquisition process. This interface is used to define communication, data acquisition parameters and make backup. The following parameters were defined for our experiments: acquisition frequency: 50 (1/10 s); filtration rate: 5; and recording periodicity: 1 min. The export data file is a .CSV file, which the software names with references to the date and hour of start: Magneto_AAAA_MM_JJ_HH_MM.csv. The data acquired by the magnetometer were processed with a MATLAB routine to convert the data acquired into 3D coordinates and perform calculations on the pearl movement kinetics. Mean angular speed of rotation (min−1) and a graphical representation determining the type of pearl motion could then be derived from the converted data (Table S1). The rotation parameters of each studied pearl oyster were recorded for 7 days.
Pearl calcein marking, nacre deposit measurement and pearl shape determination
At the beginning of the acclimation phase, the developing pearls were marked with calcein (Linard et al., 2011) to measure aragonite deposition during the 2 weeks of the experiment. The pearl oysters were anaesthetized with benzocaine and 100 µl of calcein (200 mg l−1) were then injected into the pearl sac using a syringe.
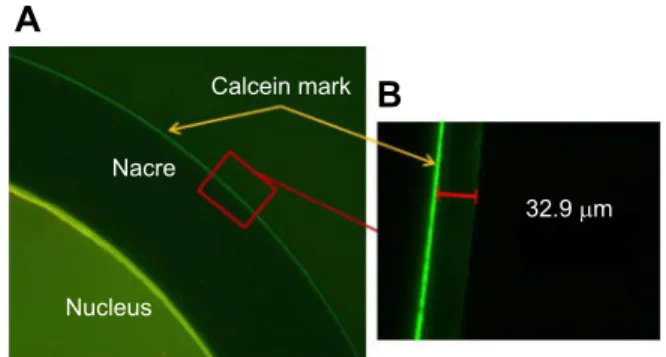
Calcein mark Nacre Nucleus 32.9 μm
A
B
Fig. 1. Marking of a section of a pearl using calcein as fluorochrome. (A) Section of a pearl showing the calcein mark (red arrow).
Magnification ×100. (B) Enlargement showing measurement of the nacre deposit. Magnification ×400.
RESEARCH ARTICLE Journal of Experimental Biology (2018) 221, jeb186858. doi:10.1242/jeb.186858
Journal
of
Experimental
At the end of the 2 weeks, the pearls were extracted and sawn in half. The calcein mark on the half-pearl could be located under a Leica DM microscope (×10) with epifluorescence (Fig. 1). Fifteen photographs were taken representing the entire circumference of each of the half-pearls studied. On each of these images, two measurements of the thickness of the total aragonite deposits were made with LAS software v3.8 (Leica, Heerbrugg, Switzerland). The thickness values were then converted to µm day−1 in order to express the nacre deposit rate. At harvest, the cultured pearls were sorted visually into three categories: round, drop and surface defect (called‘defect’).
SEM analysis
Half of each pearl was broken to observe its microstructure by scanning electron microscopy (SEM; Hitachi TM3030, Tokyo, Japan). A fragment was positioned on a rack covered with a carbon adhesive tape to present the area to be observed. The samples were then covered with a silver lacquer promoting the dissipation of electrons on the surface of the sample. Observations were made with a 15 kV acceleration voltage in‘charge effect reduction’ mode (used for non-conductive and non-metallized samples). The thickness of the aragonite tablets was measured from photographs obtained at ×9000 magnification. Tablet thickness was measured in three different areas of the fragment of each pearl (n=30 measurements per fragment). The surface of the half-pearls was also observed to compare the aragonite mineralization fronts.
Gene expression analysis
Total cellular RNA was extracted from the pearl sacs of P. margaritifera using Trizol reagent (Life Technologies, Carlsbad, CA, USA) according to the manufacturer’s recommendations. RNA was quantified using a NanoDrop ND-1000 spectrophotometer (NanoDrop Technologies, Wilmington, DE, USA). For each sample, 2μg of total RNA were treated with DNase (Ambion, Austin, TX, USA) to degrade any potential DNA contaminants. The expression levels of nine biomineralization-related genes were then analyzed with quantitative reverse transcription-polymerase chain reaction (RT-qPCR) analysis using a set of forward and reverse primers (Table 1). Three other genes coding for the following proteins were used as housekeeping genes: 18S rRNA, glyceraldehyde 3-phosphate dehydrogenase (GAPDH) and an export factor binding protein (REF1) (Joubert et al., 2014). First-strand cDNA was synthesized from 400 ng of total RNA using a Transcriptor First Strand cDNA synthesis kit (Roche, Basel, Switzerland) and a combination of random hexamer and oligo (dT) primers in a final reaction volume of 20μl. Quantitative PCR (qPCR) amplifications were carried out on a Stratagene MX3000P using Brilliant II SYBR Green QPCR master mix (Stratagene, La Jolla, CA, USA) with 400 nmol l−1of each primer and 10μl of
1:100 diluted cDNA template. The qPCR reactions consisted of an initial step of 10 min at 95°C, followed by 40 cycles of 95°C for 30 s, 60°C for 60 s and 72°C for 30 s. At the end of these steps, an additional cycle was performed from 55 to 95°C, increasing by 0.1°C every second, to generate dissociation curves and verify the specificity of the PCR products. All measurements were performed on duplicate samples. Expression levels were estimated by evaluating the fluorescence signal emitted by SYBR Green®.
This fluorescent marker binds to double-stranded DNA (dsDNA) and the fluorescence emitted is proportional to the dsDNA present in the reaction mix. Calculations were based on cycle threshold (Ct) values. The relative gene expression ratio of
each biomineralization-related gene was calculated following the delta-delta method normalized to three reference genes (Livak and Schmittgen, 2001). This was defined as: ratio=2−[ΔCt,sample−ΔCt,calibrator]=2−ΔΔCt, where the ΔC
t sample is the
ΔCtobtained for a target gene in one sample after normalization to
the reference gene, and theΔCtcalibrator is the mean of theΔCt
values obtained for all the genes and tested temperatures.
Statistics
The values of rotation speed, growth and thickness of aragonite were analyzed according to the temperature and direction of pearl movement. The normality of the data distribution and homoscedasticity of variances were checked with Shapiro–Wilk
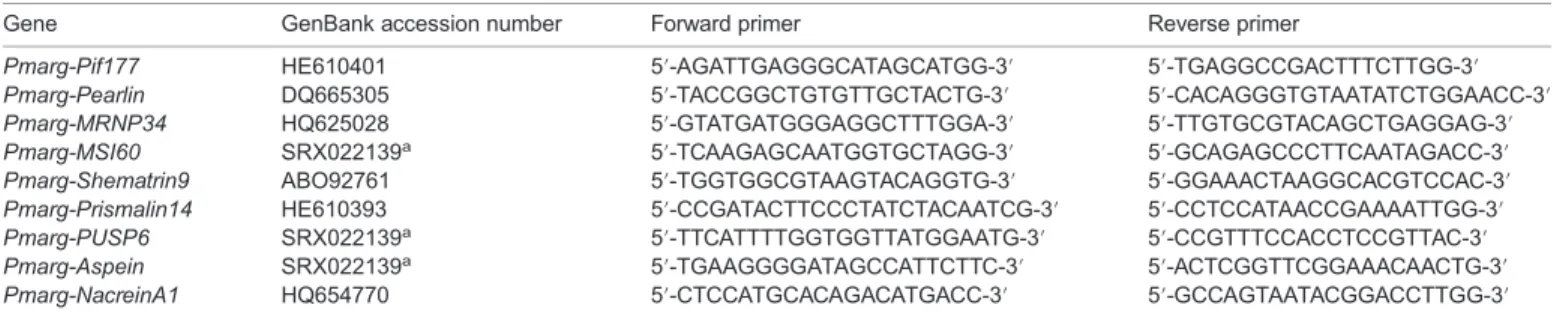
Table 1. Set of forward and reverse primers used for gene expression analysis
Gene GenBank accession number Forward primer Reverse primer
Pmarg-Pif177 HE610401 5′-AGATTGAGGGCATAGCATGG-3′ 5′-TGAGGCCGACTTTCTTGG-3′ Pmarg-Pearlin DQ665305 5′-TACCGGCTGTGTTGCTACTG-3′ 5′-CACAGGGTGTAATATCTGGAACC-3′ Pmarg-MRNP34 HQ625028 5′-GTATGATGGGAGGCTTTGGA-3′ 5′-TTGTGCGTACAGCTGAGGAG-3′ Pmarg-MSI60 SRX022139a 5′-TCAAGAGCAATGGTGCTAGG-3′ 5′-GCAGAGCCCTTCAATAGACC-3′
Pmarg-Shematrin9 ABO92761 5′-TGGTGGCGTAAGTACAGGTG-3′ 5′-GGAAACTAAGGCACGTCCAC-3′ Pmarg-Prismalin14 HE610393 5′-CCGATACTTCCCTATCTACAATCG-3′ 5′-CCTCCATAACCGAAAATTGG-3′ Pmarg-PUSP6 SRX022139a 5′-TTCATTTTGGTGGTTATGGAATG-3′ 5′-CCGTTTCCACCTCCGTTAC-3′
Pmarg-Aspein SRX022139a 5′-TGAAGGGGATAGCCATTCTTC-3′ 5′-ACTCGGTTCGGAAACAACTG-3′
Pmarg-NacreinA1 HQ654770 5′-CTCCATGCACAGACATGACC-3′ 5′-GCCAGTAATACGGACCTTGG-3′
aSRA accession number; EST library published in Joubert et al. (2014).
Table 2. Characterization of pearls according to their shape and movement
Pearl shape
Graphical
representation of motion Motion direction Drop-shaped pearls have
axial movement (52%)
Defect and circled pearls have axial movement (16%)
Round pearls have random movement (32%)
The percentage of pearls in each motion direction is given in parentheses.
Journal
of
Experimental
and Bartlett tests, respectively. The conditions for ANOVA were fulfilled for pearl growth, thickness of aragonite tablets and the log-transformed rotation speed. Gene expression was analyzed after Box–Cox transformation. Fisher’s protected least significant difference (PLSD) test was applied to compare averages in pairs. Differences were considered significant at the level P<0.05. Fisher’s exact test was used to analyze pearls according to their shape and type of movement.
RESULTS
The frequency of pearl shapes and type of rotation
Three main categories were identified among the pearls collected during the experiment– drop, defect and round – which correspond to two different types of movement of the pearl in the pearl sac: random movement (RM) and axial movement (AM) (Table 2). One pearl oyster died between measurement and harvest, and so this analysis concerns only the remaining 31. Of the 31 pearls collected, 10 were round, 16 were drop-shaped and five were defect (Table 3). Fisher’s exact test did not reveal any effect of temperature on the type of pearl movement (P=0.630), neither did the frequency of the different pearl forms differ according to temperature treatment (P=0.890).
Eight of the 10 round pearls exhibited RM, and 13 of the 16 drop pearls exhibited AM oriented around a rotation axis (Table 4). The shape of the pearls was significantly related to the type of motion (Fisher’s exact test, P=0.007): there were significantly more round pearls with RM than AM (8 versus 2, respectively), and significantly more drop pearls with AM than RM (13 versus 3, respectively) (Table 4).
The rotation speed of pearls
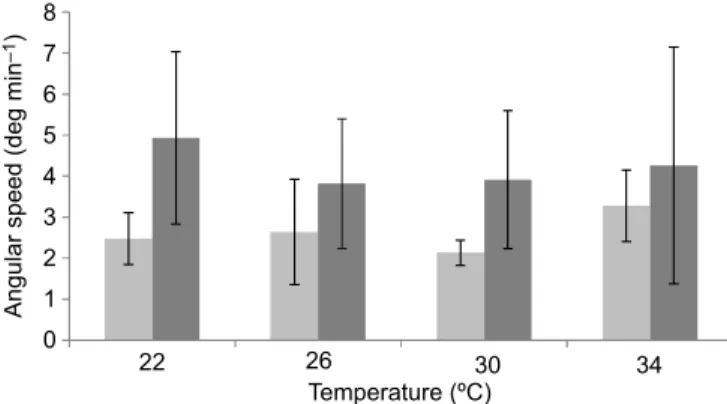
The mean angular speed of pearl rotation was not significantly linked to temperature (F=0.322, P=0.809), but there was a significant difference of rotation speed according to the type of motion (F=6.363, P=0.019), with RM<AM. There was no significant interaction between temperature and pearl motion type (F=0.472, P=0.705; Fig. 2). For all temperatures combined, the mean angular speed of AM pearls was 4.24 deg min−1, 1.6 times higher than the angular speed of RM pearls, which was 2.64 deg min−1.
Pearl growth rate
Pearl growth rate was significantly influenced by temperature (F=13.560, P<0.0001). The Tukey test revealed that the fastest growth occurred at 26 and 30°C, while at 34°C, growth was
significantly weaker. Type of pearl motion (AM versus RM) had no effect on pearl growth rate (F=0.107, P=0.747) and there was no significant interaction between temperature and motion category for pearl growth (F=0.161, P=0.921; Fig. 3).
Pearl growth rate (G) can be modelled according to the temperature (T ) following the polynomial equation: G=0.05T2+
2.65T–33.34 (r=0.81). According to this equation, the optimal temperature for pearl growth rate was estimated at Topt=27.1°C. Nacre tablet thickness
The average thickness of the aragonite tablets was 390±51 nm. At 34°C, no aragonite tablets were observed in four out of the eight individuals assessed. In samples where aragonite was observed, its thickness was not significantly different according to the type of pearl movement (F=0.641, P=0.433) or temperature (F=2.644, P=0.077; Fig. 4). No significant interaction was observed (F=2.208, P=0.119).
Gene expression in the pearl sac
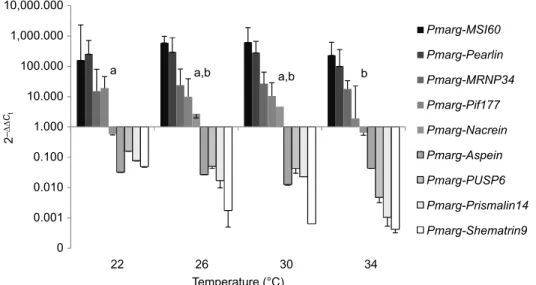
Overall, the genes encoding proteins involved in the formation of aragonite were overexpressed, while those involved in the formation of calcite were underexpressed (Fig. 5). Among the nine candidate genes tested, only the expression of Pmarg-Pif177, implicated in aragonite formation, was affected by temperature (F=3.627, P=0.033; Table 5), with the highest expression at the lowest temperature and vice versa (Fig. 5). The PLSD post hoc tests
Table 3. Number of pearls according to shape and type of movement recorded
Pearl shape Pearl movement Temperature (°C) Round Drop Defect Axial Random
22 3 4 1 4 4
26 1 5 2 4 4
30 2 4 1 5 2
34 4 3 1 6 2
Table 4. Number of pearls according to their shape and type of movement
Shape Axial movement Random movement
Defect 4 1
Drop 13 3
Round 2 8
Numbers in bold are significantly different from the expected frequency according to Fisher’s exact test.
22 0 1 2 3 4 5 6 7 8 26 Temperature (ºC)
Angular speed (deg min
–1
)
30 34
Fig. 2. Rotation speed of pearls according to temperature and type of movement: random movement (light grey) and axial movement (dark grey) (n=2–6 pearls in each condition of temperature and movement). Data are means±s.d.
22 0 1 2 b a c a 3 4 26 Temperature (ºC)
Pearl growth rate (
μ
m day
–1
)
30 34
Fig. 3. Pearl growth rate (µm day−1) according to temperature and type of movement: random movement (light grey) and axial movement (dark grey). The homogeneous groups identified by Fisher’s PLSD post hoc test are labelled a, b and c (n=2–4). Data are means±s.d.
RESEARCH ARTICLE Journal of Experimental Biology (2018) 221, jeb186858. doi:10.1242/jeb.186858
Journal
of
Experimental
showed that Pmarg-Pif177 gene expression was significantly different between 22 and 34°C, while at 26 and 30°C, expression was not significantly different from that at 22 or 34°C (Fig. 5). Type of rotation was not significantly related to expression in the pearl sac of any of the genes tested (Table 5).
DISCUSSION
Rotation speed is controlled by pearl shape
The analysis of the rotation and the formation of the pearls examined the simultaneous effect of temperature and category of movement. Despite the three possible shapes of the pearls (round, drop and defect) harvested in this experiment, only two kinds of rotational behaviour were identified: axial and random. Gueguen et al. (2015) identified three kinds of rotational behaviour generated by particular pearl shapes (drop, half-round or round). Our study confirmed that round pearls have a random movement associated with the absence of defects constraining their rotational behaviour. Pearls with defects such as craters, pits and circles, but being almost round, also had random movement. Drop-shaped pearls and pearls with outgrowths had rotation movements around their longest axis. We have thus established a link between rotation speed and pearl shape, because this speed is related to the form of the pearls and their type of movement. The pearls that turned on a single axis had higher
speeds than those with random movement. Cartwright et al. (2013) suggested that pearls move under the influence of the appearance of nacre deposits. The next section will explore how the mechanism may be more complex than this principle alone.
Pearl growth and microstructural aspects of nacre according to temperature
We observed nacre deposition on two levels: (1) pearl growth by measuring the rate of nacre deposition, and (2) the thickness of the aragonite tablets laid down. We were able to show that the nacre growth rate was higher at 26 and 30°C than at 22 and 34°C. The temperature response curve of pearl growth rate was used to calculate the optimum temperature for pearl growth, which was 27.1°C. It can be noted that this thermal optimum associated with biomineralization is 1.6°C below the previously calculated bioenergetic optimum of 28.7°C for pearl oysters of the same age and species (Le Moullac et al., 2016). This gap between optima could indicate seasonal control of energy allocation to somatic growth and reproduction in the warm season and to biomineralization (shell and pearl growth) in cooler periods. Pearl growth rates observed at 26 and 30°C in our study were slightly lower than those observed by Caseiro (1995) on cultured pearls in the Takapoto lagoon, where the temperature varied from 26.5 to 30.5°C. In P. fucata grown in Japanese lagoons, pearl growth was also found to be strongly dependent on the seasonal temperature: monthly pearl growth decreased from the hottest month (August) to the coldest (December) (Muhammad et al., 2017).
The hypothesis that nacre ultrastructure in molluscs depends on environmental temperature at the time of biomineral deposition (Olson et al., 2012) was demonstrated in pen shells (Gilbert et al., 2017). The challenge of controlling the thickness of nacre tablets is at the level of the lustre; indeed, the fine layers of nacre enhance pearls’ lustre (Matsui, 1958 in Nagai, 2013). A link has been established between lustre and temperature because temperature is lower and lustre higher in the Gambier Archipelago than in the north of the Tuamotu Archipelago (Ky et al., 2016). In the present study, we showed that the thickness of aragonite tablets was not linked to temperature, but there is some contradiction in the scientific literature about the effect of temperature on aragonite tablets. Indeed, a previous laboratory study showed that thicker tablets developed at 30°C than at 22°C in P. margaritifera (Latchère et al., 2018), while another study on grafted P. fucata reared in open seawater found no
22 0 100 200 300 400 500 600 26 Temperature (ºC)
Nacre tablet thickness (nm)
30 34
Fig. 4. Aragonite tablet thickness (nm) according to temperature and type of movement: random movement (light grey) and axial movement (dark grey) (n=2–6). Data are means±s.d.
0 0.001 0.010 0.100 1.000 10.000 100.000 1,000.000 10,000.000 22 26 30 34 Pmarg-MSI60 Pmarg-Pearlin Pmarg-MRNP34 Pmarg-Pif177 Pmarg-Nacrein Pmarg-Aspein Pmarg-PUSP6 Pmarg-Prismalin14 Pmarg-Shematrin9 Temperature (°C) 2 –ΔΔ Ct a a,b a,b b
Fig. 5. Effect of temperature on relative expression in the pearl sac of genes coding for proteins potentially involved in the construction of the prismatic layer (Shematrin9, PUSP6, Pmarg-Prismalin14, Pmarg-Aspein), nacreous layer (MSI60, Pearlin, Pmarg-MRNP34, Pmarg-Pif177) and both prismatic and nacreous layers (Pmarg-Nacrein). Statistical differences between temperature are indicated for Pmarg-Pif177; the homogeneous groups identified by Fisher’s PLSD post hoc test are labelled a and b (n=7–8). Data are means±s.d.
Journal
of
Experimental
influence of temperature on nacre tablet thickness between 27 and 19°C, but an effect of colder temperatures around 13°C (Muhammad et al., 2017). In our experiment, aragonite microstructures were not affected by temperature between 22 and 30°C. At 34°C, however, some pearls lacked aragonite tablets altogether, whereas others had low-quantity nacre tablets with the same thickness as those formed at other temperatures. The average thickness of aragonite tablets was no different according to the category of pearl movement. However, these results suggest that the theory of Cartwright et al. (2013) does not apply beyond 34°C. Indeed, the pearls continued to rotate when little or no growth was observed.
Expression of genes in the pearl sac
This study provides the broadest view to date of the effect of temperature on gene expression in the pearl sac of P. margaritifera. Among the nine genes tested, clear expression patterns appeared. The four genes encoding aragonite proteins were over-regulated, whereas the four encoding calcite proteins were under-regulated. Among the genes encoding aragonite proteins, only the expression of Pmarg-Pif177 was significantly modulated by temperature. The response of the gene encoding nacrein to temperature, although in a narrow range, was overexpressed at 26 and 30°C.
In any case, the low impact of temperature found here is consistent with the transcriptomic response in the pearl sac at 22 and 30°C observed by Latchère et al. (2018). However, it should be noted that the response of the pearl sac to temperature was not consistent with that of the mantle for most of the genes tested. The same design previously used to study the transcriptomic response in the mantle of pearl oysters exposed to these same four temperatures (22, 26, 30 and 34°C) revealed a different response model, where the expression of Pif177 was not altered, whereas Pmarg-Nacrein genes had maximum expression at 26°C (Le Moullac et al., 2016). Therefore, the response to temperature of the gene encoding nacrein in the mantle (Le Moullac et al., 2016) and in the pearl sac ( present study) appears to be similar. Interestingly, this response looks like the growth rate of the pearl. This shows that nacrein participates in the growth of pearls, but this study failed to establish a link with the ultrastructure of nacre.
The mantle edge cells are considered to be responsible for the formation of the prismatic layers, whereas the mantle pallium cells enable the formation of the nacreous layers (Joubert et al., 2010; Takeuchi and Endo, 2006). Therefore, it appears normal to find in the pearl sac a biomineralizing activity oriented towards the production of nacre. This is confirmed by our results, which show the over-regulation of genes encoding aragonite proteins in the pearl sac. That is probably due to the fact that the cells of the pearl sac are derived from a graft cut from the part of the mantle secreting proteins involved in the formation of nacre (Marie et al., 2012; Sato et al., 2013).
Conclusions
This study provides additional knowledge on pearl formation through an integrative approach describing pearl rotation in the pearl sac, measuring the rate of nacre deposition and thickness of the
aragonite tablets, and assessing the biomineralizing potential of the cells of the pearl sac via the expression of some key genes. We found that among the parameters measured, only a few were influenced by temperature, namely the rate of nacre deposition and the expression of one gene, Pmarg-Pif177, out of nine studied. In a broader context, including that of ocean warming, this study provides information on the risks to pearl culture. The slower growth observed over 30°C is accompanied by a decrease in the biomineralizing capacity of the pearl sac. Indeed, the significant decrease in the expression of the gene encoding the Pmarg-Pif177 protein confirmed the predictive character of the decline of growth and quality of pearls (Blay et al., 2016, 2018).
We showed that pearl rotation speed is not controlled by environmental temperature, but rather by pearl shape. This result leads us to question the theory of pearl rotation put forward by Cartwright et al. (2013). Indeed, at 34°C, pearls continued to rotate even when pearl growth was low and even in the absence of nacre deposition, which means that rotation cannot be explained by a ratchet effect alone. According to Cartwright et al. (2013), rotation frequency is approximately 1 turn every 20 days (10−6Hz), while measurements by Gueguen et al. (2015) indicate that pearls complete a turn every 4 h on average (1.27 deg min−1) meaning that the pearl would turn 120 times in 20 days. One can therefore suppose that there is another important factor controlling pearl rotation, which could be associated with pearl oyster physiology. The existence and nature of such a factor remain to be demonstrated experimentally.
Acknowledgements
We would like to thank the pearl farm site, Pahai Poe Pearl Farm (Apataki atoll, Tuamotu Archipelago, French Polynesia) for their generous assistance with the grafted animal supplies.
Competing interests
The authors declare no competing or financial interests.
Author contributions
Conceptualization: G.L., P.L.; Methodology: G.L., L.S.; Software: S.C.; Validation: G.L., S.C.; Formal analysis: G.L., L.S., S.C., F.B.; Investigation: L.S.; Resources: L.S., S.C., C. Belliard, P.L., F.B., C.S., D.S., C. Brahmi, C.K., B.B.; Data curation: G.L.; Writing - original draft: G.L.; Writing - review & editing: G.L.; Supervision: G.L.; Project administration: G.L.; Funding acquisition: B.B.
Funding
This work was supported by the grant Tripagen project no. 9532/MEI/DRMM from the Direction des Ressources Marines et Minières of French Polynesia.
Supplementary information
Supplementary information available online at
http://jeb.biologists.org/lookup/doi/10.1242/jeb.186858.supplemental
References
Andréfouët, S., Thomas, Y., Dumas, F. and Lo, C. (2016). Revisiting wild stocks of black lip oyster Pinctada margaritifera in the Tuamotu Archipelago: the case of Ahe and Takaroa atolls and implications for the cultured pearl industry. Estuar. Coast. Shelf Sci. 182, 243-253.
Blay, C., Parrad, S., Cabral, P., Aiho, V. and Ky, C.-L. (2016). Correlations between cultured pearl size parameters and PIF-177 biomarker expression in Table 5. ANOVA significance levels of calcifying gene expression according to temperature
Pmarg-MSI60 Pmarg-Pearlin Pmarg-MRNP34 Pmarg-Pif177 Pmarg-Nacrein Pmarg-Shematrin9 Pmarg-Aspein Pmarg-PUSP6 Pmarg-Prismalin14 Temperature 0.169 0.138 0.494 0.033 0.576 0.645 0.243 0.913 0.716 Movement 0.944 0.695 0.626 0.367 0.253 0.865 0.548 0.289 0.135 Interaction 0.664 0.941 0.801 0.587 0.488 0.698 0.272 0.681 0.614 Bold text indicates a significant difference (P<0.05).
RESEARCH ARTICLE Journal of Experimental Biology (2018) 221, jeb186858. doi:10.1242/jeb.186858
Journal
of
Experimental
Pinctada margaritifera families reared in two contrasting environments. Estuar. Coast. Shelf Sci. 182, 254-260.
Blay, C., Planes, S. and Ky, C.-L. (2018). Cultured pearl surface quality profiling by the shell matrix protein gene expression in the biomineralised pearl sac tissue of Pinctada margaritifera. Mar. Biotechnol. 20, 490-501.
Cartwright, J. H. E., Checa, A. G. and Rousseau, M. (2013). Pearls are self-organized natural ratchets. Langmuir 29, 8370-8376.
Caseiro, J. (1995). Evolution de l’épaisseur des dépots de matériaux organiques et aragonitiques durant la croissance des perles de Pinctada margartitifera. CR Acad. Sci. Paris Sér. II 321, 9-16.
Gilbert, P. U. P. A., Bergmann, K. D., Myers, C. E., Marcus, M. A., DeVol, R. T., Sun, C.-Y., Blonsky, A. Z., Tamre, E., Zhao, J., Karan, E. A. et al. (2017). Nacre tablet thickness records formation temperature in modern and fossil shells. Earth Planet. Sci. Lett. 460, 281-292.
Gueguen, Y., Montagnani, C., Joubert, C., Marie, B., Belliard, C., Tayale, A., Fievet, J., Levy, P., Piquemal, D., Marin, F. et al. (2013). Characterization of molecular processes involved in the pearl formation in Pinctada margaritifera for a sustainable development of pearl farming industry in French Polynesia. In Recent Advances in Pearl Research (ed. S. Watabe, K. Maeyama and H. Nagasawa), pp. 183-195. Tokyo: TERRAPUB.
Gueguen, Y., Czorlich, Y., Mastail, M., Le Tohic, B., Defay, D., Lyonnard, P., Marigliano, D., Gauthier, J.-P., Bari, H., Lo, C. et al. (2015). Yes, it turns: experimental evidence of pearl rotation during its formation. R. Soc. Open Sci. 2, 150144.
Jameson, H. L. (1902). On the origin of pearls. Proc. Zool. Soc. Lond. 1, 140-165. Joubert, C., Piquemal, D., Marie, B., Manchon, L., Pierrat, F., Zanella-Cléon, I., Cochennec-Laureau, N., Gueguen, Y. and Montagnani, C. (2010). Transcriptome and proteome analysis of Pinctada margaritifera calcifying mantle and shell: focus on biomineralization. BMC Genomics 11, 613. Joubert, C., Linard, C., Le Moullac, G., Soyez, C., Saulnier, D.,
Teaniniuraitemoana, V., Ky, C. L. and Gueguen, Y. (2014). Temperature and food influence shell growth and mantle gene expression of shell matrix proteins in the pearl oyster Pinctada margaritifera. PLoS ONE 9, e103944.
Ky, C.-L., Molinari, N., Moe, E. and Pommier, S. (2014). Impact of season and grafter skill on nucleus retention and pearl oyster mortality rate in Pinctada margaritifera aquaculture. Aquac. Int. 22, 1689-1701.
Ky, C.-L., Okura, R., Nakasai, S. and Devaux, D. (2016). Quality trait signature at archipelago scale of the cultured pearls produced by the black-lipped pearl oyster (Pinctada margaritifera var. cumingi) in French Polynesia. J. Shellfish Res. 35, 827-835.
Latchère, O., Mehn, V., Gaertner-Mazouni, N., Le Moullac, G., Fievet, J., Belliard, C., Cabral, P. and Saulnier, D. (2018). Influence of water temperature
and food on the last stages of cultured pearl mineralization from the black-lip pearl oyster Pinctada margaritifera. PLoS ONE 13, e0193863.
Le Moullac, G., Soyez, C., Latchere, O., Vidal-Dupiol, J., Fremery, J., Saulnier, D., Lo Yat, A., Belliard, C., Mazouni-Gaertner, N. and Gueguen, Y. (2016). Pinctada margaritifera responses to temperature and pH: acclimation capabilities and physiological limits. Estuar. Coast. Shelf Sci. 182, 261-269.
Linard, C., Gueguen, Y., Moriceau, J., Soyez, C., Hui, B., Raoux, A., Cuif, J. P., Cochard, J.-C., Le Pennec, M. and Le Moullac, G. (2011). Calcein staining of calcified structures in pearl oyster Pinctada margaritifera and the effect of food resource level on shell growth. Aquaculture 313, 149-155.
Livak, K. J. and Schmittgen, T. D. (2001). Analysis of relative gene expression data using real-time quantitative PCR and the 2−ΔΔCT method. Methods 25, 402-408. Marie, B., Joubert, C., Belliard, C., Tayale, A., Zanella-Cléon, I., Marin, F., Gueguen, Y. and Montagnani, C. (2012). Characterization of MRNP34, a novel methionine-rich nacre protein from the pearl oysters. Amino Acids 42, 2009-2017. Muhammad, G., Atsumi, T., Sunardi, and Komaru, A. (2017). Nacre growth and thickness of Akoya pearls from Japanese and hybrid Pinctada fucata in response to the aquaculture temperature condition in Ago Bay, Japan. Aquaculture 477, 35-42.
Nagai, K. (2013). A history of the cultured pearl industry. Zool. Sci. 30, 783-793. Olson, I. C., Kozdon, R., Valley, J. W. and Gilbert, P. U. P. A. (2012). Mollusk shell
nacre ultrastructure correlates with environmental temperature and pressure. J. Am. Chem. Soc. 134, 7351-7358.
Sato, Y., Inoue, N., Ishikawa, T., Ishibashi, R., Obata, M., Aoki, H., Atsumi, T. and Komaru, A. (2013). Pearl microstructure and expression of shell matrix protein genes MSI31 and MSI60 in the pearl sac epithelium of Pinctada fucata by in situ hybridization. PLoS ONE 8, e52372.
Takeuchi, T. and Endo, K. (2006). Biphasic and dually coordinated expression of the genes encoding major shell matrix proteins in the pearl oyster Pinctada fucata. Mar. Biotechnol. 8, 52-61.
Wada, K. (1999). Formation and quality of pearls. J. Gemmol. Soc. Jpn. 20, 47-62. Yukihira, H., Lucas, J. S. and Klumpp, D. W. (2000). Comparative effects of temperature on suspension feeding and energy budgets of the pearl oysters Pinctada margaritifera and P. maxima. Mar. Ecol. Prog. Ser. 195, 179-188. Yukihira, H., Lucas, J. S. and Klumpp, D. W. (2006). The pearl oysters, Pinctada
maxima and P. margaritifera, respond in different ways to culture in dissimilar environments. Aquaculture 252, 208-224.
Zanini, J. M. and Salvat, B. (2000). Assessment of deep water stocks of pearl oysters at Takapoto Atoll (Tuamotu Archipelago, French Polynesia). Coral Reefs 19, 83-87.