HAL Id: hal-02619270
https://hal.archives-ouvertes.fr/hal-02619270
Submitted on 25 May 2020HAL is a multi-disciplinary open access archive for the deposit and dissemination of sci-entific research documents, whether they are pub-lished or not. The documents may come from teaching and research institutions in France or abroad, or from public or private research centers.
L’archive ouverte pluridisciplinaire HAL, est destinée au dépôt et à la diffusion de documents scientifiques de niveau recherche, publiés ou non, émanant des établissements d’enseignement et de recherche français ou étrangers, des laboratoires publics ou privés.
Laura Cadiz, Jose-Luis Zambonino-Infante, Patrick Quazuguel, Lauriane
Madec, Herve Le Delliou, David Mazurais
To cite this version:
Laura Cadiz, Jose-Luis Zambonino-Infante, Patrick Quazuguel, Lauriane Madec, Herve Le Delliou, et al.. Metabolic response to hypoxia in European sea bass (Dicentrarchus labrax) displays developmental plasticity. Comparative Biochemistry and Physiology - Part B: Biochemistry and Molecular Biology, Elsevier, 2018, 215, pp.1-9. �10.1016/j.cbpb.2017.09.005�. �hal-02619270�
Please note that this is an author-produced PDF of an article accepted for publication following peer review. The definitive publisher-authenticated version is available on the publisher Web site.
and Molecular Biology
January 2018, Volume 215, Pages 1-9
http://dx.doi.org/10.1016/j.cbpb.2017.09.005 http://archimer.ifremer.fr/doc/00404/51536/
© 2017 Published by Elsevier Inc.
http://archimer.ifremer.fr
Metabolic response to hypoxia in European sea bass
(Dicentrarchus labrax) displays developmental plasticity
Cadiz Laura 1, *, Zambonino Jose-Luis 1, Quazuguel Patrick 1, Madec Lauriane 1, Le Delliou Herve 1, Mazurais David 1
1
IFREMER, Centre de Bretagne, LEMAR (UMR 6539), 29280 Plouzané, France * Corresponding author : Laura Cadiz, email address : Laura.Cadiz.Barrera@ifremer.fr
Abstract :
Several physiological functions in fish are shaped by environmental stimuli received during early life. In particular, early-life hypoxia has been reported to have long-lasting effects on fish metabolism, with potential consequences for fish life history traits. In the present study, we examine whether the synergistic stressors hypoxia (40% and 100% air saturation) and temperature (15° and 20 °C), encountered during early life, could condition later metabolic response in European sea bass (Dicentrarchus labrax) juveniles. Growth rate and metabolic parameters related to carbohydrate and lipid metabolism in the liver were investigated at the juvenile stage under normoxic and chronic hypoxic conditions. Juvenile growth rates were significantly lower (p < 1 × 10− 6) under hypoxic conditions and were not improved by prior early-life exposure to hypoxia. Growth was 1.3 times higher (p < 5 × 10− 3) in juveniles reared at 15 °C during the larval stage than those reared at 20 °C, suggesting that compensatory growth had occurred. Early-life exposure to hypoxia induced higher (p < 2 × 10− 6) glycogen stores in juveniles even though there was no apparent regulation of their carbohydrate metabolism. In the liver of juveniles exposed to chronic hypoxia, lower glycogen content combined with stimulation of phosphoenolpyruvate carboxykinase gene expression and higher lactate concentration indicated a stimulation of the anaerobic glycolytic pathway. Furthermore, hypoxia only induced lower (p < 1 × 10− 3) lipid content in the liver of juveniles that had experienced 15 °C at the larval stage. The present study provides evidence that environmental conditions experienced during early life shape the metabolic traits of D. labrax with potential consequences for juvenile physiological performance.
ACCEPTED MANUSCRIPT
Metabolic response to hypoxia in European sea bass (Dicentrarchus labrax) displays developmental plasticity
Laura Cadiz*, José-Luis Zambonino-Infante, Patrick Quazuguel, Lauriane Madec, Herve Le Delliou, David Mazurais
IFREMER, Centre de Bretagne, LEMAR (UMR 6539), 29280 Plouzané, France.
*Corresponding author: Laura Cadiz, email address: Laura.Cadiz.Barrera@ifremer.fr
Abstract
Several physiological functions in fish are shaped by environmental stimuli received during early life. In particular, early-life hypoxia has been reported to have long-lasting effects on fish metabolism, with potential consequences for fish life history traits. In the present study, we examine whether the synergistic stressors hypoxia (40% and 100% air saturation) and temperature (15° and 20°C), encountered during early life, could condition later metabolic response in European sea bass (Dicentrarchus labrax) juveniles. Growth rate and metabolic parameters related to carbohydrate and lipid metabolism in the liver were investigated at the juvenile stage under normoxic and chronic hypoxic conditions. Juvenile growth rates were significantly lower (p< 1x10⁻⁶) under hypoxic conditions and were not improved by prior early-life exposure to hypoxia. Growth was 1.3 times higher (p < 5x10⁻³) in juveniles reared at 15°C during the larval stage than those reared at 20°C, suggesting that compensatory growth had occurred. Early-life exposure to hypoxia induced higher (p < 2x10⁻⁶) glycogen stores in juveniles even though there was no apparent regulation of their carbohydrate metabolism. In the liver of juveniles exposed to chronic hypoxia, lower glycogen content combined with stimulation of phosphoenolpyruvate carboxykinase gene expression and higher lactate concentration indicated a stimulation of the anaerobic glycolytic pathway. Furthermore, hypoxia only induced lower (p< 1x10⁻³) lipid content in the liver of juveniles that had experienced 15°C at the larval stage. The present study provides evidence that environmental conditions experienced during early life shape the metabolic traits of D. labrax with potential consequences for juvenile physiological performance.
Key words: hypoxia, developmental plasticity, metabolism, European sea bass
Abbreviations: Atgl, adipose triglyceride lipase; CJ, control juvenile group; CL, control larval group; Cq, quantification cycle; Dgat1, diacylglycerol O-acyltransferase 1; DMSO, dimethyl sulfoxide; Dph, days post hatching; Ef1 elongation factor-1 isoform alpha; Glut2, glucose transporter-2; GP,
ACCEPTED MANUSCRIPT
glycogen phosphorylase; Gs, glycogen synthase; HIF, hypoxia inducible factor; HJ, hypoxia juvenile group; HL, hypoxia larval group; HIS, hepatosomatic index; NADPH, nicotinamide adenine dinucleotide phosphate; Pepck, phosphoenolpyruvate carboxykinase; PHD-3, prolyl hydroxylase domain-containing protein 3; Pk, pyruvate kinase; PIT, passive integrated transponder; qPCR, quantitative polymerase chain reaction; RGR, relative growth rate; RIN, RNA integrity number; RT, reverse transcription
1. Introduction
Global climate warming and eutrophication caused by nutrient inputs are the two main causes increasing the prevalence of environmental hypoxia in aquatic environments, particularly in shallow marine areas (Diaz, 2001; Diaz and Rosenberg, 2008, 2011; Gillanders et al., 2011). It is known that reduced oxygen availability impacts many behavioural traits, physiological processes and ecological interactions in marine organisms including fish species (Ficke et al., 2007; Levin et al., 2009; Nagelkerken and Munday, 2016; Portner and Farrell, 2008). Oxygen is indeed essential for the supply of metabolic fuel, which in turn determines individual performance for specific energetically expensive processes. More precisely, as the final acceptor of the electron transport chain in the inner membrane of mitochondria, oxygen is involved in the oxidative phosphorylation that drives the generation of energy in the form of ATP. The acclimation of fish to low environmental O2 conditions
is likely to interact with increased temperature, because both of these stressors affect aerobic metabolism (Anttila et al. 2015; McBryan et al., 2013, 2016; Pörtner and Farrell 2008). Raised temperatures force ectothermic fish to increase their metabolism, resulting in higher O2 demands,
while hypoxia limits O2 supply. Recent data obtained in Atlantic Killifish (Fundulus heteroclitus)
demonstrated that hypoxia tolerance dramatically reduced with acute temperature increase (McBryan et al., 2016). The inability of fish to provide sufficient energy to meet their need through aerobic metabolism under hypoxia forces them to use anaerobic metabolism. The switch to anaerobic respiration is related to the utilization of the glycolytic pathway, in which glucose is converted to pyruvate in the absence of oxygen, producing lactate as the end product (Mandic et al., 2013; Richards, 2011). Glucose can be supplied from glycogen stocks, but also by gluconeogenesis, which can be additionally activated to increase hepatic glucose production during hypoxia in vertebrates, including fish (Gracey et al., 2001; 2011; Martínez et al. 2006). Moreover, glucose has been suggested to be generated from glycerol derived from triglycerides in some hypoxia-tolerant species, such as burrow-dwelling goby (Gillichthys mirabilis), when exposed to hypoxia (Gracey et al., 2011). In fish, as in other vertebrates, the hypoxia-inducible factor (HIF) signalling pathway is
ACCEPTED MANUSCRIPT
involved in the physiological response to hypoxia by regulating the transcription of a number of hypoxia-inducible genes, including some involved in metabolic pathways (Wu, 2002).
The adaptive capacity of organisms, including fish, to cope with environmental constraints (e.g., oxygen, temperature, nutrition) depends on species and ontogenic stage, but also on the conditions encountered during early life stages (Geurden et al., 2007; Robertson et al., 2014; Scott and Johnston, 2012). This may be related to developmental plasticity, which consists of the irreversible phenotypic changes to an organism's ontogeny induced by environmental conditions at early life stages (Schaefer and Ryan, 2006; Terblanche and Chown, 2006). Developmental plasticity may offer the ability for an organism exposed to a specific environmental constraint during its early-life period to form phenotypes better able to cope with this environment at later stages (Bateson et al., 2014). Robertson and collaborators (2014) have shown that exposure of zebrafish (Danio rerio) to hypoxia during the embryonic stage affects sex determination in such a way as to produce more males, which are more hypoxia tolerant than females at the adult stage. Developmental plasticity may involve an intricate regulation (programming) of different biological processes including metabolic pathways, which can be detected by modifications in gene expression (Liu et al., 2017). While metabolic programming has been extensively addressed in a number of mammal studies (Fernandez-Twinn and Ozanne, 2010; Hanley et al., 2010; Patel and Srinivasan, 2010), its ecological implications in aquatic organisms are poorly understood (Fuiman and Perez, 2015). In particular, it remains unknown whether temperature and hypoxic conditions encountered by fish at early life stages could influence their subsequent metabolic adaptability in later life to habitats experiencing hypoxia episodes.
The main purpose of the present study was to determine whether the metabolic adaptability of European sea bass (Dicentrarchus labrax) juveniles to low oxygen availability could be modulated by larval “life-history”, especially by temperature and hypoxia exposure at early-life stages. European sea bass larvae likely enter shallow coastal areas just after the flexion stage and could therefore be exposed to environmental fluctuations (Dufour et al., 2009; Jennings and Pawson, 1992). Previous studies on European sea bass revealed that exposure to moderate hypoxia at the larval stage had a negative impact on subsequent juvenile growth rate. This negative effect on growth was associated with a long-lasting down-regulation of genes involved in energy consuming metabolic pathways in the liver (Vanderplancke et al. 2015). In the present study, we wanted to go further and obtain a more environmentally realistic assessment of synergistic effects of stressors that fish larvae would be likely to encounter. As hypoxia could often be associated with warming episodes, we evaluated whether a combination of different oxygen concentration (40% and 100% air saturation) and
ACCEPTED MANUSCRIPT
temperature (15 and 20°C) experienced during early-life could change the subsequent juvenile response to hypoxia, with observable long-lasting regulation of metabolic processes. Experimental conditions tested here mimic field conditions that sea bass is likely to experience along the European West coast of Atlantic Ocean (Copernicus Marine environment monitoring service, http://marine.copernicus.eu). Growth rate was used to evaluate the overall physiological status of juveniles. Trypsin expression was measured as an indicator of food consumption and digestion. The capacity for energy production was analysed by assessing different metabolites (glycogen, glucose, lactate and lipids) and by investigating activity or gene expression of different proteins involved in carbohydrate metabolism [glycogen phosphorylase (GP) activity and gene expression (gp); glycogen synthase (gs), phosphoenolpyruvate carboxykinase (pepck), glucose transporter-2 (glut2) and pyruvate kinase (pk) gene expression] and lipid metabolism [pancreatic lipase activity; adipose triglyceride lipase (atgl), fatty acid transporter (slc27) and diacylglycerol O-acyltransferase 1 (dgat1) gene expression]. Special interest was also paid to the expression of prolyl hydroxylase domain-containing protein 3 gene (phd3), an actor in the HIF signalling pathway.
2. Material and methods
2.1 Animal rearing and treatments
D. labrax larvae were reared under normal oxygen conditions in 12 tanks at 15 ± 0.4°C water
temperature and 35 ± 0.2‰ salinity. They were fed daily with Artemia according to Zambonino et al. (1996) until the end of larval development. Water temperature was progressively increased from 15°C to 20°C in six tanks between 23 and 28 days post hatching (dph) for acclimation purposes. From 28 dph, three replicate tanks of larvae were exposed to each combination of oxygenation level [40% air saturation (2.95 mg O2 L−1): hypoxia larval group (HL); and 100% saturation (7.35 mg O2 L−1):
control larval group (CL)] and temperature (15°C and 20°C). Hypoxic conditions were created by bubbling N2 in a gas equilibration column placed upstream of the experimental tank. Dissolved O2
was monitored daily using an Odeon oxygen meter (ODEON Classic OPTOD; Caudan, France). Other water quality parameters (salinity, temperature and pH) were also checked daily in each tank during the experiment. It had previously been determined that the level of hypoxia used did not induce mortality; thus, genetic selection during larval exposure was avoided. Larvae were returned to normal oxygen conditions (100% air saturation) at 43 dph, for larvae exposed at 20°C (745°C·day), and at 50 dph, for larvae exposed to 15°C (750°C·day), to ensure that larval treatments were applied at the same stage of development. Replicate tanks were then pooled into one 1 m3-tank per treatment and kept under normoxic conditions at 15-17°C. At this stage, the fish were fed with a commercial diet (NeoSupra; Coopérative Le Gouessant, Lamballe, Côtes-d’Armor, France). At 166
ACCEPTED MANUSCRIPT
dph, 60 fish from each of the treatment tanks were selected and tagged subcutaneously to identify the early stage treatments (Passive Integrated Transponder; PIT-tag) for individual identification. The fish were then fed with NeoGrower commercial diet (Coopérative Le Gouessant; Lamballe, Côtes-d’Armor, France) and pooled in a 4-m3 tank. From 196 to 296 dph, fish were separated into two tanks, including 30 juveniles from each larval group in each tank. Water temperature was then progressively increased to 20°C and water oxygenation in one of the tanks was reduced to 40% air saturation (hypoxia juvenile group, HJ), while it was maintained at 100% saturation in the other (control juvenile group, CJ). Experimental protocol was summarized in Fig. 1.
2.2 Growth monitoring
From each of the HJ and CJ groups, 120 juveniles (including 30 fish from each of the larval groups 15/20°C HL and 15/20°C CL) were weighed individually at 196 and 296 dph after light anaesthesia (Tricaine methane-sulfonate 10 mg L-1). Growth was estimated individually by calculating the relative growth rate ( ) between 196 and 296 dph.
2.3 Sampling
Sampling of immature juveniles was performed at 296 dph, after fish had been left undisturbed and unfed for 24 h. From each of the two groups HJ and CJ, 32 juveniles (including eight fish from each of the larval groups 15/20°C HL and 15/20°C CL) were randomly selected and euthanized with an excess of anaesthetic (Tricaine methane-sulfonate 500mg L-1). Tissue including liver and pancreas (pancreatic tissue is diffuse and cannot be separated from the liver) was dissected and weighed to determine the hepatosomatic index (HSI) and immediately frozen in liquid nitrogen.
The present work was performed within IFREMER facilities in accordance with French and European policies and the guidelines of the French Animal Care Committee (Agreement number: APAFIS#5173).
2.4 Hepatosomatic index and metabolite levels
Hepatosomatic index (HSI) was defined by the equation . Livers were pooled in duplicate to get enough biological material for determination of metabolite levels. Pools were ground to an ultra-fine powder using a ball mill (Retsch MM400). Liver tissue was homogenized in the following solutions: 0.1M tri-Sodium citrate and 0.1M citric acid (for glucose and glycogen measures); 8% PCA and 3M K2CO3 (for lactate measure) and dichloromethane/methanol (2/1) (for
ACCEPTED MANUSCRIPT
and lactate concentrations in liver were assessed using commercial kits (RTU reference no. 61269 from bioMérieux, Marcy l'Etoile, France and LC reference no. 2389 from Randox Laboratories, Crumlin, UK, respectively), while the levels of hepatic glycogen were determined according to the method of Carr and Neff (1984). Extraction of total lipids was done by the Folch method (Folch, 1957).
2.5 Enzymatic activity
Glycogen phosphorylase (EC 2.4.1.1.; GP) was measured from liver tissue pooled in duplicate. Fifty mg of powdered and frozen tissue was homogenized with 10 vol. of ice-cold stopping-buffer containing 50 mM imidazole (pH 7.5), 1 mM mercaptoethanol, 50 mM NaF, 4 mM EDTA, 0.5 mM PMSF and 250 mM sucrose. Buffer reagents were supplied by Sigma Aldrich® Inc., St. Louis, MO, USA. The homogenate was centrifuged at 10 000 g, for 30 min at 4°C, and the supernatant recovered for enzyme assay. Total GP activity was determined using the microplate reader of a Thermo Scientific Multiskan GO spectrophotometer (ThermoFisher Scientific). Reaction rates of enzymes were determined by the increase or decrease in nicotinamide adenine dinucleotide phosphate (NADPH) absorbance at 340 nm. The reactions proceed at 37°C. Total GP (a+b) activity was measured in the presence of 2.5 mM adenosine monophosphate. The specific conditions used for GP activity were similar to those previously described in Laiz-carrión et al. (2003) and Polakof et al. (2006).
Lipase (EC 3.1.1.3) was assayed in the liver according to a method slightly modified from Iijima et al. (1998), using p-nitrophenyl myristate as substrate (Sigma Aldrich® Inc., St. Louis, MO, USA) dissolved in dimethyl sulfoxide (DMSO, Merck-Schuchardt, Darmstadt, Germany), as this was found to aid substrate solubilisation. Powdered liver tissue (50 mg) was homogenized into 4 vol. (v/w) of 0.01 M Phosphate Buffered Saline (PBS, Sigma Aldrich® Inc., St. Louis, MO, USA). The homogenate was centrifuged at 10 000 g for 5 min at 4°C and the supernatant recovered for enzyme assay. The single path absorption spectra were measured at 30°C by Evolution 201 UV-Visible spectrometer (Thermo Scientific).
Enzyme activities were expressed as specific activities, i.e., U/mg protein. Protein was determined by the Bradford procedure (Bradford, 1976).
2.6 RNA extraction and cDNA synthesis
Total RNA for analysis of gene expression was extracted from the liver tissue (pooled in duplicate) using Extract-all reagent (Eurobio; Courtaboeuf, Essonne, France) combined with the Zymo Direct-zol™ RNA MiniPrep Kit, following recommendations from the supplier. Genomic DNA was
ACCEPTED MANUSCRIPT
removed using the DNA-free Kit (MoBio Laboratories Inc.; Carlsbad, CA, USA). The quantity, purity and quality of RNA were assessed using a ND-1000 NanoDrop® spectrophotometer (Thermo Scientific Inc.; Waltham, MA, USA) and by electrophoresis using an Agilent Bioanalyser 2100 (Agilent Technologies Inc.; Santa Clara, CA, USA). All samples had an RNA integrity number (RIN) higher than seven and could thus be used for real-time quantitative PCR (qPCR) analysis. RNA samples were stored at –80°C until use.
Synthesis of cDNA was carried out using 500 ng of DNase-treated total RNA with an iScript™ cDNA Synthesis kit (Bio-Rad Laboratories Inc.; Hercules, CA, USA). The total reaction was carried out in a final volume of 20 μL containing 5 μL (500 ng) of sample, 4 μL 5x iScript™ Reaction Mix containing oligo (dT), random primers and RNaseA inhibitor, 1 μL iScript™ Reverse transcriptase and 10 μL RNase/DNase free water. The cDNA synthesis reaction was incubated for 5 min at 25°C followed by 30 min at 42°C and terminated by incubation for 5 min at 85°C to inactivate the enzyme. Reverse transcription (RT) was performed using a Thermo-cycler TC-152 (Techne Barloworld Scientific; Stone, Staffordshire, UK). cDNA was stored at –20°C until use. RT negative controls were performed on each sample (same reaction mix except for the reverse transcriptase).
2.7 Quantitative real-time RT-PCR analysis
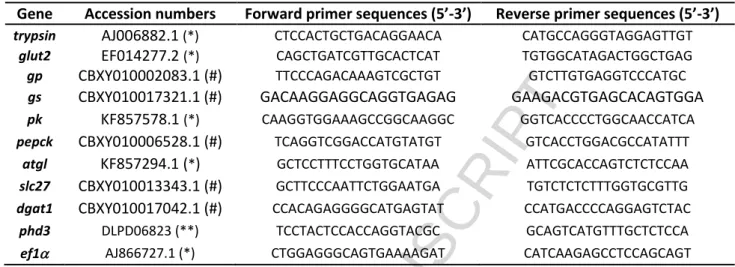
The analysis of gene expression in liver tissue of European sea bass was carried out by qPCR using the primers listed in table 1. Primers were designed using Primer3plus (http://primer3plus.com/), based on cDNA sequences (trypsin, glut2, pk, atgl, phd3 and ef1) available from the NCBI (https://www.ncbi.nlm.nih.gov/) and the Sigenae website (http://www.sigenae.org/). For gp, gs, pepck, slc27 and dgat1 genes, the cDNA sequences were predicted from the D. labrax genome using Genscan software (http://genes.mit.edu/GENSCAN.html).
Gene expression was quantified using an iCycler MyiQ™ Single Color Real-Time PCR Detection System (Bio-Rad Laboratories Inc.). Standard curves were estimated for each primer pair using serial dilutions (from 1/10 to 1/270) of a pool of cDNA. qPCR efficiencies of primer pair ranged from 95 to 100%, with R2 > 0.99. Each sample was run in triplicate in a final well volume of 15 μL, containing 5 μL cDNA (1/30 dilution) and 10 μL of reaction mix, composed of 0.5 μL of each primer (10 mM), 1.5 μL RNase/DNase free water, 7.5 μL iQ™ SYBR® Green Supermix (Bio-Rad Laboratories Inc.) containing antibody-mediated hot-started iTaq DNA polymerase, dNTPs, MgCl2, SYBR® Green I dye, enhancers,
stabilizers and fluorescein. Negative controls (non-template control) were systematically included in each plate. RT negative controls were also used as template in order to ensure the absence of residual DNA contamination. The qPCR profiles contained an initial activation step at 95°C for 2 min,
ACCEPTED MANUSCRIPT
followed by 39 cycles: 5 s at 95°C and 20 s at 60°C. After the amplification phase, a melting curve was performed to confirm the amplification of a single product in each reaction.
For each sample, the corresponding Cq (Quantification cycle) value was determined automatically using the “Gene Expression Module” of CFX Manager software (Bio-Rad Laboratories Inc.). Cq is the number of cycles required to yield a detectable fluorescence signal. The relative quantity of messenger was normalized with the ΔΔCt method, also using CFX Manager software. Several reference genes were tested to correct for loading differences or other sampling variations present in each sample. The elongation factor 1-alpha (ef1) gene was used as reference gene in the liver tissue of juvenile fish since it did not show any significant variation of expression between samples (relative standard deviation <5% among samples).
2.8 Statistical analyses
Statistical analyses were performed using STATISTICA software version 10 (http://statsoft.fr/). All data were log-transformed to fit a normal distribution. For all analyses, variables were checked for normality (Shapiro test) and equality of variances (Levene test). Three-way ANOVAs were used to determine the effects of larval treatments (oxygen and temperature) on growth, metabolites, enzymatic activities and gene expression in tested juveniles. Tukey’s test (p < 0.05) was performed for post-hoc comparisons of metabolite data. All figures were drawn using GraphPad Prism®(v.5.0b) software.
3. Results
3.1 Weight and growth rate
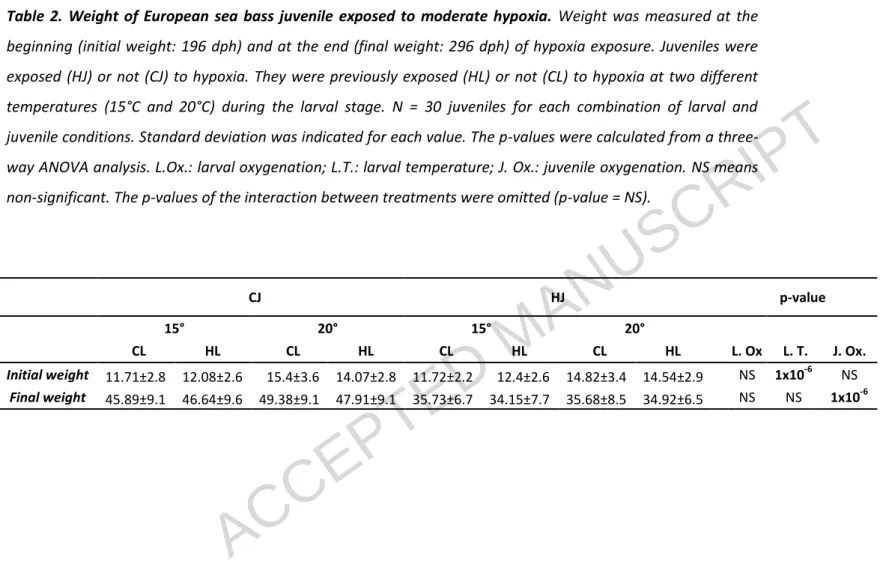
Weight of European sea bass juveniles measured at the beginning (196 dph) and at the end (296 dph) of the hypoxia exposure are shown in table 2. The weights of juveniles at 196 dph were significantly higher (1.3 times) in fish previously reared at 20°C during larval stage. At the end of hypoxia exposure (296 dph), the weights of juveniles exposed to moderate hypoxia were significantly lower (1.3 times) and there was no interaction with larval conditions.
The effects of larval and juvenile conditions on relative growth of juveniles are shown in Fig.2A-B. Statistical analysis (table 3) revealed a significant effect of juvenile stage oxygen conditions on relative growth rate (p < 1x10⁻⁶). This effect of juvenile oxygenation on growth depended upon larval oxygenation (p < 0.02). The decrease in growth of juveniles under hypoxia is even marked when fish have been exposed to hypoxia at larval stage (Fig.2A). Our data also revealed a significant effect of larval temperature conditions on juvenile growth (p < 1x10⁻⁶). Overall, juveniles reared at
ACCEPTED MANUSCRIPT
15°C during larval development exhibited higher (1.3 times) relative growth rates than those reared at 20°C (Fig.2B). There was also a significant interaction between temperature and oxygen conditions at the larval stage on relative growth rate of juveniles (p < 5x10⁻³) (table 3). Whether larval oxygenation affected the growth of juvenile bass depended, in part, on larval temperature: only when the temperature of larval development was 15°C did larval hypoxia result in a slight reduction in juvenile growth (Fig.2B).
3.2 Hepatosomatic index and hepatic metabolites
The hepatosomatic index (HSI) decreased in juveniles exposed to hypoxia (p < 2x10⁻⁶) but was not significantly impacted by early life conditions (Fig.3A; table 3). Similarly, juveniles exposed to moderate hypoxia displayed a significant decrease in hepatic glycogen content compared to the normoxic group (p < 2x10⁻⁶) (Fig.3B; table 3). In addition, glycogen levels were significantly higher in the liver of juveniles that had experienced hypoxia during their larval period (p < 2x10⁻⁶). No significant difference in the hepatic glucose content was observed between the experimental groups (Fig.3C; table 3). The levels of hepatic lactate were higher in juveniles exposed to hypoxia (p < 2x10⁻⁶) (Fig.3D; table 3), but this hypoxia-induced increase in hepatic lactate content was not influenced by early life treatments (p > 0.45). Finally, lipid content only decreased under hypoxia in the liver of juveniles that had experienced 15°C at larval stage (Fig.3E; table 3).
3.3 Enzymatic activities
Hypoxia exposure at the juvenile stage led to significantly higher specific activities of GP (p < 2x10⁻⁶) (table 4). Larval conditions did not significantly influence this effect (p > 0.26). Pancreatic lipase enzyme activity was not significantly regulated by either juvenile or larval treatments (p > 0.21; table 4).
3.4 Gene expression
Real-time PCR analysis (table 4) showed a significant decrease in trypsin expression in juveniles exposed to hypoxia (p = 7x10⁻⁶). Furthermore, higher trypsin expression was found in the liver of juveniles previously exposed to 15°C during their larval stage compared to those exposed to 20°C. Concerning genes involved in glucose metabolism, significant increases in gs and pepck gene expression were noted in the liver of juveniles exposed to hypoxia, while glut2, gp and pk mRNA levels remained unchanged. In addition, conditions experienced at the larval stage did not influence subsequent expression of the genes involved in glucose metabolism at the juvenile stage (p > 0.06). Transcripts related to genes implicated in triglyceride metabolism (atgl, slc27, dgat1) did not exhibit
ACCEPTED MANUSCRIPT
any significantly different levels among the experimental groups, although there was a tendency for higher slc27 mRNA levels (p = 0.06) in hypoxia-exposed juveniles. Finally, hypoxia induced a stimulation of phd3 gene expression (p = 2x10⁻³) in hypoxia-exposed juveniles while larval conditions had no significant effect.
4. Discussion
Exposure to environmental hypoxia lowers metabolic activity in fish, which have to cope with limited aerobic ATP production while maintaining vital physiological functions. This effect requires a fine-tuned regulation of the metabolic pathways especially in the liver, which has a pivotal role in energy metabolism. As hypoxia can often be associated with warming episodes, we postulate that oxygen and temperature conditions at early life stages may influence metabolic programming, which could have a long-term influence on hypoxia-induced metabolic responses.
Our data revealed that exposure of juvenile European sea bass to moderate but chronic hypoxia induced significantly higher levels of hepatic phd3 gene expression. This result indicates a stimulation of the HIF pathway and then hypoxia sensitivity after almost three months of exposure to 40% dissolved oxygen. Since it is acknowledged that the HIF pathway underlies cellular/tissular hypoxia response, its activation in the liver likely results in the regulation of different biological processes, including energy metabolism, and possibly impacts fish fitness components (Richards et al., 2009).
In European sea bass it has been shown that hypoxia induces a decrease in feed intake concurrent to a metabolic depression (Pichavant et al., 2001; Thetmeyer et al., 1999). It was therefore not surprising to observe a marked decrease in growth of juveniles exposed to hypoxia in the present study. Accordingly, in the pancreatic tissue of fish under hypoxia, we observed a significantly lower expression of trypsin, which is an indicator of food consumption and digestion (Rungruangsak-Torrissen et al., 2006). In addition, the lower hepatosomatic index (HSI) observed in juveniles exposed to chronic hypoxia, regardless of the larval conditions they experienced, confirmed the diminution of feed intake together with the mobilization and loss of energetic reserves, as reported in other teleosts, e.g., hybrid striped bass (Green et al., 2015) or common carp (Moyson et al., 2015).
The present data showed that a hypoxia event experienced during early-life history did not confer any benefit to sea bass in terms of growth when they were subsequently exposed to chronic hypoxia. On the contrary, juveniles that had experienced early hypoxia exposure showed a significantly lower relative growth rate under hypoxia conditions at the juvenile stage. Previous data
ACCEPTED MANUSCRIPT
obtained in European sea bass already indicated a negative impact of mild hypoxia exposure during the larval period on subsequent juvenile growth (Vanderplancke et al., 2015). Although we cannot rule out a potential effect of early hypoxia exposure on other components of fish fitness, our data does not support the idea that early exposure to low oxygen conditions improves the subsequent ability of European sea bass to cope with hypoxia, as observed in zebrafish (Robertson et al., 2014). Interestingly, we observed the highest growth rates in juveniles that had been reared at 15°C as larvae compared to those reared at 20°C. These higher growth rates likely resulted from compensatory growth that occurred after the reduced food consumption observed in larvae reared at low temperature. Such compensatory growth is suggested by the higher trypsin expression found in juveniles previously exposed to 15°C during their larval stage; trypsin is a recognized indicator of feed ingestion (Pedersen et al., 1990) and it is accepted that hyperphagia is the most common mechanism of growth compensation in fish (Ali et al., 2003).
Hepatic glycogen is an important energy resource during hypoxia episodes, able to provide sufficient glucose substrate for a heightened ATP demand under anaerobic metabolism. Accordingly, our data revealed lower glycogen stores in the livers of juveniles exposed to chronic hypoxia. Because the level of glycogen stores in a tissue depends on the balance between the rates of glycogenogenesis and glycogenolysis, our data suggest a higher rate of glycogen breakdown in the liver of fish exposed to chronic hypoxia. Both actors involved in hepatic glycogenogenesis (GS gene expression) and glycogenolysis (GP activity) appeared stimulated in juveniles under hypoxia. This result is in agreement with previous data obtained by Martínez et al. (2006) in the liver of Gulf killifish (Fundulus grandis) exposed to hypoxia. These authors attributed the stimulation of both anabolic and catabolic glycogen pathways in the liver to the existence of distinct hepatic cell populations that differ from one another in their glycolytic and gluconeogenic capacities (Mommsen et al., 1991). In D. labrax exposed to mild chronic hypoxia, higher GP activity revealed the stimulation of glycogenolysis in the liver, which could be explained by the enhanced glucose needs of glycolysis during anaerobic metabolism (Chippari-Gomes et al., 2005; Lewis et al., 2007; Richards et al., 2009). The necessity for fish to produce glucose as anaerobic fuel was also confirmed by the stimulation of the pepck gene, which is a key actor involved in gluconeogenesis. However, this stimulation of glycogenolysis and gluconeogenesis did not result in a higher hepatic glucose accumulation, likely due to an immediate utilization through glycolysis or outflow. Even though we could not detect any stimulation in the expression of genes involved in glycolysis (e.g., pk), higher concentrations of hepatic lactate observed in juveniles under hypoxia suggested a stimulation of the anaerobic glycolytic pathway in the liver. Previous studies on D. labrax revealed that mild chronic hypoxia induced a stimulation of glucose transporter glut2 gene expression in liver and suggested that
ACCEPTED MANUSCRIPT
glucose produced from glycogen could leave the liver to serve as fuel in other tissues (Terova et al., 2009). In the present study we could not find any regulation of glut2 gene expression in juveniles exposed to hypoxia, which does not rule out a potential regulation of glucose transport at the post-transcriptional level. Although we found higher glycogen stores in the livers of juvenile fish that had been exposed to hypoxia during their larval stage, we did not find any changes in several molecular indicators of glycogen catabolic and anabolic pathways that could help unravel the potential mechanisms involved. Particularly, while GP activity increased during hypoxic exposure of juvenile bass, GP transcript levels did not, which suggest post-transcriptional (e.g. phosphorylation) regulation of this enzyme. Considering that liver glycogen content is positively associated with chronic hypoxia tolerance in vertebrates, including fish (Bickler and Buck, 2007; Yang et al., 2015), we cannot rule out such a possible tolerance in the European sea bass juveniles that had experienced an early-life hypoxic event in the present study. Since early exposure to hypoxia did not enhance juvenile growth potential (as mentioned above), the potential advantage in terms of hypoxia tolerance will require further and additional investigation of physiological parameters such as those related to metabolic rates and key functions (e.g., reproduction).
In most vertebrates, including fish, glycogen is considered the primary source of stored energy for organisms exposed to environmental hypoxia. However, recent findings in burrow-dwelling goby, Gillichthys mirabilis and common carp Cyprinus carpio revealed triglyceride mobilization and lipid peroxidation in the liver during exposure to prolonged environmental hypoxia (Gracey et al., 2011; Mustafa et al., 2015). Accordingly, our data revealed a significant decrease of lipid content under hypoxia in the liver of juveniles that had experienced 15°C at the larval stage; this difference in lipid content could be the consequence of a higher energy demand due to the higher growth observed in these fish. Measures of metabolic rates under mild chronic hypoxia would have made it possible to test this hypothesis. While Gracey et al. (2011) showed in goby that triglyceride mobilization under hypoxia involved the stimulation of key genes related to triglyceride hydrolysis (e.g., atgl) and fatty acid transport (slc27), as well as the downregulation of genes associated with triglyceride synthesis (dgat1), our data only revealed a tendency for higher slc27 expression in juveniles exposed to hypoxia. In addition, we did not observe any regulation in the activity of pancreatic lipase, which plays a role during periods of lipid mobilization (van den Thillart et al., 2002). Further investigation will be necessary to elucidate the different mechanisms involved in the control of lipid storage (e.g., lipid peroxidation) as well as the functional significance of lipid depletion under hypoxic conditions in European sea bass.
ACCEPTED MANUSCRIPT
In conclusion, the present study reveals that oxygen and temperature conditions experienced by European sea bass at early life stages have long term effects on features that could affect the metabolic response to hypoxia at the juvenile stage. These effects are reflected through long lasting regulation of glycogen and lipid stores by early oxygen and temperature condition, respectively. These effects can be attributed to developmental plasticity, although the specific underlying mechanisms remain to be determined. Further investigations are now required to clarify whether early-life exposure to hypoxia conditions (low oxygen and warm temperature) actually results in a higher tolerance to moderate O2 deprivation episodes during the juvenile period.
Acknowledgments. The first author was supported by a joint Ifremer–Région Bretagne doctoral grant and by the "Laboratoire d'Excellence" LabexMER (ANR-10-LABX-19). The authors are very grateful to the BTU (Bureau de Traduction de l'Universite) at Université de Bretagne Occidentale for their help with the correction-revision of the English in this article.
References
Ali, M., Nicieza, A., Wootton, R.J., 2003. Compensatory growth in fishes: A response to growth depression. Fish and Fisheries 4, 147–190. doi:10.1046/j.1467-2979.2003.00120.x
Anttila, K., Lewis, M., Prokkola, J.M., Kanerva, M., Seppänen, E., Kolari, I., Nikinmaa, M., 2015. Warm acclimation and oxygen depletion induce species-specific responses in salmonids. The Journal of experimental biology 218, 1471–1477. doi:10.1242/jeb.119115
Bateson, P., Gluckman, P., Hanson, M., 2014. The biology of developmental plasticity and the Predictive Adaptive Response hypothesis. The Journal of physiology 592, 2357–2368. doi:10.1113/jphysiol.2014.271460
Bickler, P.E., Buck, L.T., 2007. Hypoxia tolerance in reptiles, amphibians, and fishes: life with variable
oxygen availability. Annu Rev Physiol 69, 145–170.
doi:10.1146/annurev.physiol.69.031905.162529
Bradford, M.M., 1976. A rapid and sensitive method for the quantitation of microgram quantities of protein utilizing the principle of protein-dye binding. Analytical Biochemistry 72, 248–254. doi:10.1016/0003-2697(76)90527-3
Carr, R.S., Neff, J.M., 1984. Quantitative semi-automated enzymatic assay for tissue glycogen. Comparative Biochemistry and Physiology - Part B: Biochemistry and 77, 447–449. doi:10.1016/0305-0491(84)90258-X
ACCEPTED MANUSCRIPT
Chippari-Gomes, A.R., Gomes, L.C., Lopes, N.P., Val, A.L., Almeida-Val, V.M.F., 2005. Metabolic adjustments in two Amazonian cichlids exposed to hypoxia and anoxia. Comparative Biochemistry and Physiology - B Biochemistry and Molecular Biology 141, 347–355. doi:10.1016/j.cbpc.2005.04.006
Diaz, R.J., 2001. Overview of Hypoxia around the World. Journal of Environment Quality 30, 275–281. doi:10.2134/jeq2001.302275x
Diaz, R.J., Rosenberg, R., 2008. Spreading Dead Zones and Consequences for Marine Ecosystems. Science 321, 926–929. doi:10.1126/science.1156401
Díaz, R.J., Rosenberg, R., 2011. Introduction to Environmental and Economic Consequences of Hypoxia. International Journal of Water Resources Development 27, 71–82. doi:10.1080/07900627.2010.531379
Dufour, V., Cantou, M., Lecomte, F., 2009. Identification of sea bass (Dicentrarchus labrax) nursery areas in the north-western Mediterranean Sea. Journal of the Marine Biological Association of the United Kingdom 89, 1367–1374. doi:10.1017/S0025315409000368
Fernandez-Twinn, D.S., Ozanne, S.E., 2010. Early life nutrition and metabolic programming. Annals of the New York Academy of Sciences 1212, 78–96. doi:10.1111/j.1749-6632.2010.05798.x
Ficke, A.D., Myrick, C.A., Hansen, L.J., 2007. Potential impacts of global climate change on freshwater fisheries, Reviews in Fish Biology and Fisheries 17, 581–613. doi:10.1007/s11160-007-9059-5
Folch, J., Lees, M., Sloane-Stanley, G.H., 1957. A simple method for the isolation and purification of total lipids from animal tissues. Journal of Biological Chemistry 226, 497–509.
Fuiman, L.A., Perez, K.O., 2015. Metabolic programming mediated by an essential fatty acid alters body composition and survival skills of a marine fish. Proceedings of the Royal Society B: Biological Sciences 282. doi:10.1098/rspb.2015.1414
Geurden, I., Aramendi, M., Zambonino-Infante, J., Panserat, S., 2007. Early feeding of carnivorous rainbow trout (Oncorhynchus mykiss) with a hyperglucidic diet during a short period: effect on dietary glucose utilization in juveniles. AJP: Regulatory, Integrative and Comparative Physiology 292, 2275–2283. doi:10.1152/ajpregu.00444.2006
Gillanders, B.M., Elsdon, T.S., Halliday, I.A., Jenkins, G.P., Robins, J.B., Valesini, F.J., 2011. Potential effects of climate change on Australian estuaries and fish utilising estuaries: A review. Marine
ACCEPTED MANUSCRIPT
and Freshwater Research 62, 1115–1131. doi:10.1071/MF11047
Gracey, A.Y., Troll, J. V, Somero, G.N., 2001. Hypoxia-induced gene expression profiling in the euryoxic fish Gillichthys mirabilis. Proceedings of the National Academy of Sciences 98, 1993– 1998. doi:10.1073/pnas.98.4.1993
Gracey, A.Y., Lee, T.-H., Higashi, R.M., Fan, T., 2011. Hypoxia-induced mobilization of stored triglycerides in the euryoxic goby Gillichthys mirabilis. The Journal of experimental biology 214, 3005–3012. doi:10.1242/jeb.059907
Green, B.W., Rawles, S.D., Fuller, S.A., Beck, B.H., Mcentire, M.E., 2015. Hypoxia affects performance traits and body composition of juvenile hybrid striped bass (Morone chrysops x M. saxatilis). Aquaculture Research 47, 2266–2275. doi:10.1111/are.12678
Hanley, B., Dijane, J., Fewtrell, M., Grynberg, A., Hummel, S., Junien, C., Koletzko, B., Lewis, S., Renz, H., Symonds, M., Gros, M., Harthoorn, L., Mace, K., Samuels, F., van Der Beek, E., 2010. A review of metabolic programming, imprinting and epigenetics. British Journal of Nutrition 104, S1-25. doi:10.1017/S0007114510003338
Iijima, N., Tanaka, S., Ota, Y., 1998. Purification and characterization of bile salt-activated lipase from the hepatopancreas of red sea bream, Pagrus major. Fish Physiology and Biochemistry 18, 59– 69. doi:doi 10.1023/A:1007725513389
Terblanche, J. S., Chown, S. L., 2006. The relative contributions of developmental plasticity and adult acclimation to physiological variation in the tsetse fly, Glossina pallidipes (Diptera, Glossinidae). Journal of Experimental Biology 209, 1064–1073. doi:10.1242/jeb.02129
Jennings, S., Pawson, M.G., 1992. The origin and recruitment of bass, Dicentrarchus labrax, larvae to nursery areas. Journal of the Marine Biological Association of the United Kingdom 72, 199–212. doi:10.1017/S0025315400048888
Laiz-carrión, R., Martín Del Río, M.P., Miguez, J.M., Mancera, J.M., Soengas, J.L., 2003. Influence of cortisol on osmoregulation and energy metabolism in gilthead seabream Sparus aurata. Journal of Experimental Zoology Part A: Comparative Experimental Biology 298A, 105–118. doi:10.1002/jez.a.10256
Levin, L. a., Ekau, W., Gooday, a. J., Jorissen, F., Middelburg, J.J., Naqvi, S.W. a., Neira, C., Rabalais, N.N., Zhang, J., 2009. Effects of natural and human-induced hypoxia on coastal benthos.
ACCEPTED MANUSCRIPT
Biogeosciences 6, 2063–2098. doi:10.5194/bg-6-2063-2009
Lewis, J.M., Costa, I., Val, A.L., Almeida-Val, V.M.F., Gamperl, A.K., Driedzic, W.R., 2007. Responses to hypoxia and recovery: repayment of oxygen debt is not associated with compensatory protein synthesis in the Amazonian cichlid, Astronotus ocellatus. Journal of Experimental Biology 210, 1935–1943. doi:10.1242/jeb.005371
Liu, J., Plagnes-Juan, E., Geurden, I., Panserat, S., Marandel, L., 2017. Exposure to an acute hypoxic stimulus during early life affects the expression of glucose metabolism-related genes at first-feeding in trout. Scientific Reports 7, 363. doi:10.1038/s41598-017-00458-4
Mandic, M., Speers-Roesch, B., Richards, J.G., 2013. Hypoxia Tolerance in Sculpins Is Associated with High Anaerobic Enzyme Activity in Brain but Not in Liver or Muscle. Physiological and Biochemical Zoology 86, 92–105. doi:10.1086/667938
Martínez, M.L., Landry, C., Boehm, R., Manning, S., Cheek, A.O., Rees, B.B., 2006. Effects of long-term hypoxia on enzymes of carbohydrate metabolism in the Gulf killifish, Fundulus grandis. The Journal of experimental biology 209, 3851–61. doi:10.1242/jeb.02437
McBryan, T.L., Anttila, K., Healy, T.M., Schulte, P.M., 2013. Responses to temperature and hypoxia as interacting stressors in fish: implications for adaptation to environmental change. Integrative and comparative biology 53, 648–59. doi:10.1093/icb/ict066
McBryan, T.L., Healy, T.M., Haakons, K.L., Schulte, P.M., 2016. Warm acclimation improves hypoxia tolerance in Fundulus heteroclitus. Journal of Experimental Biology 219, 474–484. doi:10.1242/jeb.133413
Mommsen, T.P., Danulat, E., Gavioli, M.E., Foster, G.D., Moon, T.W., 1991. Separation of Enzymatically Distinct Populations of Trout Hepatocytes. Canadian Journal of Zoology-Journal Canadien de Zoologie 69, 420–426. doi: 10.1139/z91-066
Moyson, S., Jung, H., Diricx, M., Kumar, A., Blust, R., Boeck, G. De, 2015. The combined effect of hypoxia and nutritional status on metabolic and ionoregulatory responses of common carp ( Cyprinus carpio ). Comparative Biochemistry and Physiology Part A: Molecular & Integrative Physiology 179, 133–143. doi:10.1016/j.cbpa.2014.09.017
Mustafa, S.A., Karieb, S.S., Davies, S.J., Jha, A.N., 2015. Assessment of oxidative damage to DNA, transcriptional expression of key genes, lipid peroxidation and histopathological changes in carp
ACCEPTED MANUSCRIPT
Cyprinus carpio L. following exposure to chronic hypoxic and subsequent recovery in normoxic conditions. Mutagenesis 30, 107–116. doi:10.1093/mutage/geu048
Nagelkerken, I., Munday, P.L., 2016. Animal behaviour shapes the ecological effects of ocean acidification and warming: Moving from individual to community-level responses. Global Change Biology 22, 974–989. doi:10.1111/gcb.13167
Patel, M.S., Srinivasan, M., 2010. Metabolic Programming Due to Alterations in Nutrition in the Immediate Postnatal Period. Journal of Nutrition 140, 658–661. doi:10.3945/jn.109.110155
Pedersen, B.H., Ugelstad, I., Hjelmeland, K., 1990. Effects of a transitory, low food supply in the early life of larval herring (Clupea harengus) on mortality, growth and digestive capacity. Marine Biology. 107, 61–66. doi:10.1007/BF01313242
Pichavant, K., Bayon, N. Le, Severe, A., Roux, A. Le, Boeuf, G., 2001. Comparative effects of hypoxia on growth and metabolism of turbot and European sea bass. Journal of Fish Biology 59, 875– 883. doi: 10.1111/j.1095-8649.2001.tb00158.x
Polakof, S., Arjona, F.J., Sangiao-Alvarellos, S., Martin Del Rio, M.P., Mancera, J.M., Soengas, J.L., 2006. Food deprivation alters osmoregulatory and metabolic responses to salinity acclimation in gilthead sea bream Sparus auratus. Journal of Comparative Physiology B: Biochemical, Systemic, and Environmental Physiology 176, 441–452. doi:10.1007/s00360-006-0065-z
Portner, H.O., Farrell, A.P., 2008. ECOLOGY: Physiology and Climate Change. Science 322, 690–692. doi:10.1126/science.1163156
Richards, J.G., 2011. Physiological, behavioral and biochemical adaptations of intertidal fishes to hypoxia. The Journal of experimental biology 214, 191–199. doi:10.1242/jeb.047951
Richards, J.G., 2009. Chapter 10 Metabolic and molecular responses of fish to hypoxia. In Jeffrey G, Richards APF, Colin JB eds, Fish Physiology, Vol 27. Academic Press, 443–485.
Robertson, C.E., Wright, P.A., Köblitz, L., Bernier, N.J., B, P.R.S., Ko, L., 2014. Hypoxia-inducible factor-1 mediates adaptive developmental plasticity of hypoxia tolerance in zebrafish, Danio rerio. Proceedings of the Royal Society B: Biological Sciences 281,(1786):20140637. doi:10.1098/rspb.2014.0637.
Rungruangsak-Torrissen, K., Moss, R., Andresen, L.H., Berg, A., Waagbø, R., 2006. Different expressions of trypsin and chymotrypsin in relation to growth in Atlantic salmon (Salmo salar
ACCEPTED MANUSCRIPT
L.). Fish Physiology and Biochemistry 32, 7–23. doi:10.1007/s10695-005-0630-5Schaefer, J., Ryan, A., 2006. Developmental plasticity in the thermal tolerance of zebrafish Danio
rerio. Journal of Fish Biology 69, 722–734. doi:10.1111/j.1095-8649.2006.01145.x
Scott, G.R., Johnston, I.A., 2012. Temperature during embryonic development has persistent effects on thermal acclimation capacity in zebrafish. Proceedings of the National Academy of Sciences 109, 14247–14252. doi:10.1073/pnas.1205012109
Seibel, B.A., 2011. Critical oxygen levels and metabolic suppression in oceanic oxygen minimum zones. Journal of Experimental Biology 214, 326–336. doi:10.1242/jeb.049171
Terova, G., Rimoldi, S., Brambilla, F., Gornati, R., Bernardini, G., Saroglia, M., 2009. In vivo regulation of GLUT2 mRNA in sea bass (Dicentrarchus labrax) in response to acute and chronic hypoxia. Comparative biochemistry and physiology. Part B, Biochemistry & molecular biology 152, 306– 16. doi:10.1016/j.cbpb.2008.12.011
Thetmeyer, H., Waller, U., Black, K.D., 1999. Growth of European sea bass (Dicentrarchus labrax L.) under hypoxic and oscillating oxygen conditions. Aquaculture 174, 355–367. doi:10.1016/S0044-8486(99)00028-9
van den Thillart, G., Vianen, G., Zaagsma, J., 2002. Adrenergic regulation of lipid mobilization in fishes; a possible role in hypoxia survival. Fish Physiology and Biochemistry 27, 189–204. doi:10.1023/B:FISH.0000032754.42056.cb
Vanderplancke, G., Claireaux, G., Quazuguel, P., Madec, L., Ferraresso, S., Sévère, A., Luis, J., Infante, Z., Mazurais, D., 2015. Hypoxic episode during the larval period has long‑term effects on European sea bass juveniles (Dicentrarchus labrax) 162, 367–376. doi:10.1007/s00227-014-2601-9
Wu, R.S.., 2002. Hypoxia: from molecular responses to ecosystem responses. Marine Pollution Bulletin 45, 35–45. doi:10.1016/S0025-326X(02)00061-9
Yang, Y., Cao, Z.D., Fu, S.J., 2015. Variations in temperature acclimation effects on glycogen storage, hypoxia tolerance and swimming performance with seasonal acclimatization in juvenile Chinese crucian carp. Comparative Biochemistry and Physiology -Part A : Molecular and Integrative Physiology 185, 16–23. doi:10.1016/j.cbpa.2015.03.009
ACCEPTED MANUSCRIPT
labrax) larvae fed different Artemia rations : growth , pancreas enzymatic response and
development of digestive functions. Aquaculture 139, 129–138. doi: 10.1016/0044-8486(95)01149-8.
Legends
Fig.1. Schema of the experimental protocol. Sea bass larvae were exposed to each combination of
oxygenation level [40% air saturation: hypoxia larval group (HL); and 100% saturation: control larval group (CL)] and temperature (15°C and 20°C) from 28 to 43dph (20°C) or 50 dph (15°C). Following the larval exposure, fish experienced a five months period of common garden (15-17°C, 100% air saturation). From 196 to 296 dph, fish were divided into two tanks, including 30 juveniles from each larval group. Water temperature was 20°C and water oxygenation in one of the tanks was reduced to 40% air saturation (hypoxia juvenile group, HJ), while it was maintained at 100% saturation in the other (control juvenile group, CJ).
Fig. 2 A-B. Impact of juvenile and larval conditions on juvenile relative growth rates. A. Graph
representing significant interaction (see table 3) between hypoxia exposures at juvenile and larval stages on juvenile relative growth rates. Juveniles reared under moderate hypoxia (HJ, n=120) or normoxia (CJ, n=120) include fish previously exposed (HL, n=120) or not (CL, n=120) to moderate hypoxia (combining 15°C and 20°C) at larval stage. B. Graph representing significant interaction (see table 3) between oxygen (HL, n=120 and CL, n=120) and thermic conditions (15°C, n=120 and 20°C, n=120) at larval stage on juvenile relative growth rates (combining HJ and CJ groups). The Y-axis represents the relative growth rate (body gain/initial weight). Error bars indicate standard deviation.
Fig. 3. Hepatosomatic index (HSI) (A) and hepatic metabolites: glycogen (B), glucose (C), lactate (D) and lipids (E) in European sea bass juveniles. Juveniles were either exposed (HJ) or not (CJ) to hypoxia
and were previously exposed (HL) or not (CL) to hypoxia at 15°C or 20°C during the larval stage (n = 4 pools of 2 juveniles for each combination of larval and juvenile conditions). Error bars indicate standard deviation. Significant differences between groups are identified with different letters (three-way ANOVA followed by Tukey’s test).
ACCEPTED MANUSCRIPT
Table 1. Forward and Reverse Primer sequences used for quantitative PCR. Ef1 was used as housekeeping gene. Accession numbers of cDNA sequences (trypsin, glut2, pk, atgl, phd3 and ef1) available from NCBI (*) and the Sigenae (**) websites. For gp, gs, pepck, slc27 and dgat1 genes, the cDNA sequences were predicted from the D. labrax genome. Accession numbers of the D. labrax contigs available from the NCBI (#).
Gene Accession numbers Forward primer sequences (5’-3’) Reverse primer sequences (5’-3’)
trypsin AJ006882.1 (*) CTCCACTGCTGACAGGAACA CATGCCAGGGTAGGAGTTGT
glut2 EF014277.2 (*) CAGCTGATCGTTGCACTCAT TGTGGCATAGACTGGCTGAG
gp CBXY010002083.1 (#) TTCCCAGACAAAGTCGCTGT GTCTTGTGAGGTCCCATGC
gs CBXY010017321.1 (#) GACAAGGAGGCAGGTGAGAG GAAGACGTGAGCACAGTGGA
pk KF857578.1 (*) CAAGGTGGAAAGCCGGCAAGGC GGTCACCCCTGGCAACCATCA
pepck CBXY010006528.1 (#) TCAGGTCGGACCATGTATGT GTCACCTGGACGCCATATTT
atgl KF857294.1 (*) GCTCCTTTCCTGGTGCATAA ATTCGCACCAGTCTCTCCAA
slc27 CBXY010013343.1 (#) GCTTCCCAATTCTGGAATGA TGTCTCTCTTTGGTGCGTTG
dgat1 CBXY010017042.1 (#) CCACAGAGGGGCATGAGTAT CCATGACCCCAGGAGTCTAC
phd3 DLPD06823 (**) TCCTACTCCACCAGGTACGC GCAGTCATGTTTGCTCTCCA
ACCEPTED MANUSCRIPT
Table 2. Weight of European sea bass juvenile exposed to moderate hypoxia. Weight was measured at thebeginning (initial weight: 196 dph) and at the end (final weight: 296 dph) of hypoxia exposure. Juveniles were exposed (HJ) or not (CJ) to hypoxia. They were previously exposed (HL) or not (CL) to hypoxia at two different temperatures (15°C and 20°C) during the larval stage. N = 30 juveniles for each combination of larval and juvenile conditions. Standard deviation was indicated for each value. The p-values were calculated from a three-way ANOVA analysis. L.Ox.: larval oxygenation; L.T.: larval temperature; J. Ox.: juvenile oxygenation. NS means non-significant. The p-values of the interaction between treatments were omitted (p-value = NS).
CJ HJ p-value
15° 20° 15° 20°
CL HL CL HL CL HL CL HL L. Ox L. T. J. Ox.
Initial weight 11.71±2.8 12.08±2.6 15.4±3.6 14.07±2.8 11.72±2.2 12.4±2.6 14.82±3.4 14.54±2.9 NS 1x10⁻⁶ NS
ACCEPTED MANUSCRIPT
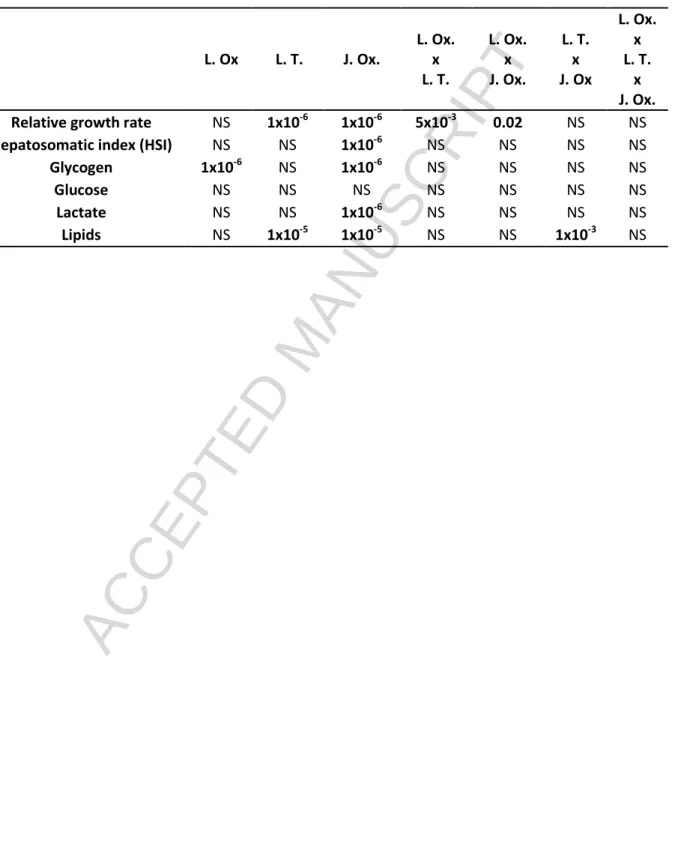
Table 3. Statistical analysis of relative growth rate, hepatosomatic index (HSI) and hepatic metabolites (glycogen, glucose, lactate and lipids) in European sea bass exposed to different thermic and oxygen conditions at larval and juvenile stages. The p-values were calculated from a three-way ANOVA analysis. L.Ox.: larval oxygenation; L.T.: larval temperature; J. Ox.: juvenile oxygenation. NS means non-significant.
L. Ox L. T. J. Ox. L. Ox. x L. T. L. Ox. x J. Ox. L. T. x J. Ox L. Ox. x L. T. x J. Ox.
Relative growth rate NS 1x10⁻⁶ 1x10⁻⁶ 5x10⁻³ 0.02 NS NS
Hepatosomatic index (HSI) NS NS 1x10⁻⁶ NS NS NS NS
Glycogen 1x10⁻⁶ NS 1x10⁻⁶ NS NS NS NS
Glucose NS NS NS NS NS NS NS
Lactate NS NS 1x10⁻⁶ NS NS NS NS