HAL Id: hal-01942605
https://hal.umontpellier.fr/hal-01942605
Submitted on 27 May 2020
HAL is a multi-disciplinary open access
archive for the deposit and dissemination of
sci-entific research documents, whether they are
pub-lished or not. The documents may come from
teaching and research institutions in France or
abroad, or from public or private research centers.
L’archive ouverte pluridisciplinaire HAL, est
destinée au dépôt et à la diffusion de documents
scientifiques de niveau recherche, publiés ou non,
émanant des établissements d’enseignement et de
recherche français ou étrangers, des laboratoires
publics ou privés.
SylvX: a viewer for phylogenetic tree reconciliations
François Chevenet, Jean-Philippe Doyon, Celine Scornavacca, Edwin Jacox,
Emmanuelle Jousselin, Vincent Berry
To cite this version:
François Chevenet, Jean-Philippe Doyon, Celine Scornavacca, Edwin Jacox, Emmanuelle Jousselin,
et al.. SylvX: a viewer for phylogenetic tree reconciliations. Bioinformatics, Oxford University Press
(OUP), 2016, 32 (4), pp.608-610. �10.1093/bioinformatics/btv625�. �hal-01942605�
1
Phylogenetics
SylvX: a viewer for phylogenetic tree reconciliations
François Chevenet
1,2,*, Jean-Philippe Doyon
2, Celine Scornavacca
3, Edwin Jacox
3,
Emma-nuelle Jousselin
4and Vincent Berry
21
MIVEGEC, CNRS 5290, IRD 224, Université de Montpellier, France
2
Institut de Biologie Computationnelle, LIRMM, UMR 5506 CNRS, Université de Montpellier, France
3
ISEM-UMR 5554 CNRS IRD, Université de Montpellier, France
4
INRA-UMR 1062 CBGP, Centre de Biologie pour la Gestion de Populations, Montferrier-sur-Lez, France
Associate Editor: Prof. Alfonso Valencia
© The Author (2015). Published by Oxford University Press. All rights reserved. For Permissions, please email: [email protected]
Bioinformatics Advance Access published October 29, 2015
at INRA Institut National de la Recherche Agronomique on November 4, 2015
http://bioinformatics.oxfordjournals.org/
2 ABSTRACT
Motivation: Reconciliation methods aim at recovering the evolu-tionary processes that shaped the history of a given gene family including events such as duplications, transfers and losses by com-paring the discrepancies between the topologies of the associated gene and species trees. These methods are also used in the frame-work of host/parasite studies to recover co-diversification scenarios including co-speciation events, host-switches and extinctions. These evolutionary processes can be graphically represented as nested trees. These interconnected graphs can be visually messy and hard to interpret, and despite the fact that reconciliations are increasingly used, there is a shortage of tools dedicated to their graphical man-agement. Here we present SylvX, a reconciliation viewer which im-plements classical phylogenetic graphic operators (swapping, high-lighting, etc.) and new methods to ease interpretation and compari-son of reconciliations (multiple maps, moving, shrinking sub-reconciliations). SylvX is an open source, cross-platform, standalone editor available for Windows and Unix-like systems including OSX. It is publicly available at www.sylvx.org.
Contact: [email protected]
1. INTRODUCTION
Reconciliation methods compare gene trees and species trees to recover the history of gene families. Such a history is composed of speciation events, duplications, losses, transfers and other tionary events affecting particular genes at specific times in evolu-tion (Page et al., 1998). Reconciliaevolu-tion methods are also used in co-diversification studies where the phylogeny of parasite species is compared to that of host species infected by these parasites. Here a different set of evolutionary events is considered including co-speciation events, duplications, extinctions and host switches. Few tools are currently available to visualize reconciliations: Tar-zan/CoRe-PA (Merkle et al., 2005), Jane (Conow et al., 2010) and PrIMETV (Sennblad et al., 2007) packages use a two dimensional Euclidean slanted layout for the representation of reconciliations; the 3DPE editor (Kim et al., 2007) uses a 2.5D representation of a slanted layout, crossing species (X) vs. evolutionary distance (Y) vs. paralogs (Z). In spite of these powerful tools for illustrating how a “guest” tree (e.g. a gene history) evolves inside a host tree (e.g. a species tree), these interconnected graphs can be visually hard to interpret when the number of evolutionary events depicted is high. Another issue is that the available viewers lack the ability to compare reconciliations obtained under different settings (e.g. different event costs) or to compare reconciliations for different genes families (or parasite taxa) on the same species tree. The goal of SylvX is the graphical management of such drawings and the generation of publication-ready illustrations.
2. METHODS
SylvX is written in Tcl/Tk. The required input is a species tree (Newick format) and one or several reconciliations in the format outputted by Mowgli (Doyon et al., 2010). Mowgli is included and dynamically linked to SylvX. TERA (Scornavacca et al., 2014) and NOTUNG (Vernot et al. 2007) output can be imported. SylvX output format is PostScript or SVG (easily editable with many drawing package and keeping a high quality graphics). The reconciliation graphs are based on a species tree (host) using a rectangular layout with a variable thickness line, and a gene history (para-site tree), embedded in the species tree, which is composed of horizontal segments linked by vertical versatile connectors. The algorithm displaying reconciliations is based on vertical translation of segments following evolu-tionary events. For instance, both segments of a duplication are shifted, one upwards and the other downwards. This offset is then inherited by all the subsequent nodes and is cumulative with posterior events.
3. RESULTS
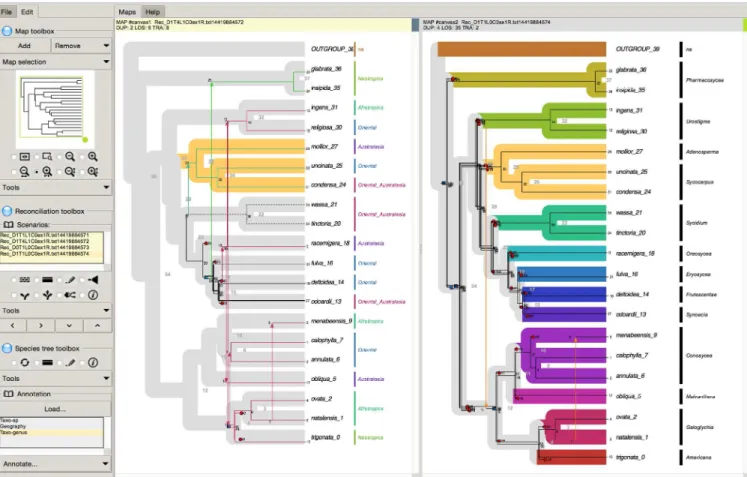
SylvX’s consists of three toolboxes (Fig.1). The first one is related to maps. A map is a resizable and scrollable display space showing a species tree with one superimposed gene reconciliation. The user can add/remove maps and choose which reconciliation to display on a given map from the reconciliation toolbox (see below). Both the species tree and its gene reconciliation are updated by applying a tool (e.g. zoom) from this map toolbox. The second toolbox is specific to reconciliations. In order to display a reconciliation, first, the user needs to target one or several map(s) from the map toolbox, and secondly, select a reconciliation from the list of avail-able ones. The reconciliation toolbox offers graphical operators such as highlighting (line thickness, dash line, foreground color), shrinking, translation or annotation that can be applied to internal nodes of a reconciliation. These operations take into account evo-lutionary events, including horizontal transfers. For instance, set-ting a new color to an internal node of a reconciliation also updates the color of all the subsequent horizontal transfers and their de-scendants. Reconciliations can be synchronized, meaning that a graphical modification on a reconciliation from a given map can be automatically conducted on a selection of maps displaying the same reconciliation. The third toolbox is dedicated to the species tree. A species subtree can be swapped, hidden, highlighted, col-ored and annotated. Like reconciliations, species trees from several maps can be synchronized.
4. DISCUSSION
The main feature of SylvX is the ability to manage multiple inter-active maps of reconciliations. Synchronous highlighting opera-tions between juxtaposed maps ease their comparison. Zooming, annotating (color, text), shrinking sub-parts of the trees help in the interpretation of chains of events. The SylvX method for display-ing reconciliations is based on upward and downward translations of segments linked by versatile connectors. Displaying reconcilia-tions having a high number of evolutive events, such as a set of successive duplications, within one (short) species tree segment is still a challenge (superimpositions of a high number of graphical items in a small drawing area). More elaborated methods available in the field of information visualization will be useful, such as the production of symbolic views (e.g. replacing a set of duplications by one « hot spot » in the tree) or tree navigation tools based on Focus+Context distortion such as the accordion zoom (Munzer et
al., 2003). Another challenge is a global view of multiple genes
histories on a single map/species tree. In this context, flattening or smoothing reconciliation graphs and its evolutionary events will be required to avoid messy visualizations and graphical operators acting locally, manually or automatically must be developed. In the short term, one priority is the ability to import reconciliations from other packages such as PrIMETV (Sennblad et al., 2007).
at INRA Institut National de la Recherche Agronomique on November 4, 2015
http://bioinformatics.oxfordjournals.org/
3
ACKNOWLEDGEMENTS
We thank Astrid Cruaud & coll. for sharing the fig/fig-wasp da-taset. Funding: ANR Phylospace.
REFERENCES
Conow,C. et al. (2010) Jane: a new tool for the cophylogeny reconstruction problem.
Algorithms for Molecular Biology, 5, 16, 1-10
Cruaud,A. et al. (2012) An extreme case of plant-insect codiversification: figs and fig-pollinating wasps. Systematic Biology, 61, 6, 1029-1047
Doyon,J.P. et al. (2010) An efficient algorithm for gene/species trees parsimonious reconciliation with losses, duplications and transfers. In: Proceedings of the 2010
International Conference on Comparative Genomics, RECOMB-CG’10,
Spring-er-Verlag, Berlin, Heidelberg, 93-108
Merkle,D. and Middendorf,M. (2005) Reconstruction of the cophylogenetic history of related phylogenetic trees with divergence timing information. Theory Biosci. 123, 4, 277-99
Munzner,T. et al. (2003) TreeJuxtaposer: Scalable Tree Comparison using Fo-cus+Context with Guaranteed Visibility Proc. SIGGRAPH 2003, published as ACM Transactions on Graphics 22, 3, 453-462
Kim,N. and Lee,C. (2007) Three-Dimensional Phylogeny Explorer: Distinguishing paralogs, lateral transfer, and violation of "molecular clock" assumption with 3D visualization. BMC Bioinformatics, 8, 213
Page,R.D.M. and Charleston,M.A. (1998) Trees within trees: phylogeny and histori-cal associations. Tree 13, 9, 356-359
Scornavacca,C. et al. (2014) Joint amalgamation of most parsimonious reconciled gene trees. Bioinformatics
Sennblad,B. et al. (2007) PrIMETV: a viewer for reconciled trees. BMC
Bioinformat-ics,8,148
Vernot,B. et al. (2007) Reconciliation with Non-Binary Species Trees. Computational Systems Bioinformatics: CSB2007, Imperial College Press: 441-452
Figure 1. Screenshot of a SylvX session. The left side of the interface gathersthe Map toolbox, the Reconciliation(s) toolbox and the Species tree toolbox. The right sidestacks maps. Duplications are represented by blue squares, losses by red crosses and transfers by arrows (variable colors). The "host-parasite" dataset used in the figure consists of the Ficus/fig wasp dataset by Cruaud et al. (2012). Two maps are in use: the one on the left displays a species tree with a superimposed reconciliation having a color coding based on transfers. The second map displays a reconciliation for the same gene but with a different costs for evolutionary events.
at INRA Institut National de la Recherche Agronomique on November 4, 2015
http://bioinformatics.oxfordjournals.org/