HAL Id: hal-02433209
https://hal.univ-lorraine.fr/hal-02433209
Submitted on 2 Dec 2020HAL is a multi-disciplinary open access archive for the deposit and dissemination of sci-entific research documents, whether they are pub-lished or not. The documents may come from teaching and research institutions in France or abroad, or from public or private research centers.
L’archive ouverte pluridisciplinaire HAL, est destinée au dépôt et à la diffusion de documents scientifiques de niveau recherche, publiés ou non, émanant des établissements d’enseignement et de recherche français ou étrangers, des laboratoires publics ou privés.
Liquid-liquid Extraction of Metformin
Maizatul Najwa Jajuli, M. Hazwan Hussin, Afidah Abdul Rahim, Bahruddin
Saad, Marc Hébrant, Grégoire Herzog
To cite this version:
Maizatul Najwa Jajuli, M. Hazwan Hussin, Afidah Abdul Rahim, Bahruddin Saad, Marc Hébrant, et al.. Preliminary Assays on Electrochemically Modulated Liquid-liquid Extraction of Met-formin. Journal of Physical Science, Universiti Sains Malaysia, 2019, 30 (Supp.2), pp.153-166. �10.21315/jps2019.30.s2.13�. �hal-02433209�
© Penerbit Universiti Sains Malaysia, 2019. This work is licensed under the terms of the Creative Commons Attribution (CC BY) (http://creativecommons.org/licenses/by/4.0/).
Preliminary Assays on Electrochemically Modulated Liquid-liquid
Extraction of Metformin
Maizatul Najwa Jajuli,1,2 M. Hazwan Hussin,1* Afidah Abdul Rahim,1 Bahruddin Saad,3 Marc Hébrant2** and Grégoire Herzog2***
1Analytical Chemistry Section, School of Chemical Sciences,
Universiti Sains Malaysia, 11800 USM Pulau Pinang, Malaysia
2Laboratoire de Chimie Physique et Microbiologie pour les
Matériaux et l’Environnement (LCPME), UMR 7564, CNRS – Université de Lorraine, 405 rue de Vandoeuvre, Villers-lès-Nancy, 54600, France
3Fundamental and Applied Sciences Department, Universiti Teknologi Petronas,
32610 Seri Iskandar, Perak, Malaysia
Corresponding authors: mhh@usm.my*; marc.hebrant@univ-lorraine.fr**;
gregoire.herzog@univ-lorraine.fr*** Published online: 25 December 2019
To cite this article: Jajuli, M. N. et al. (2019). Preliminary assays on electrochemically modulated liquid-liquid extraction of metformin. J. Phys. Sci., 30(Supp. 2), 153–166, https://doi.org/10.21315/jps2019.30.s2.13
To link to this article: https://doi.org/10.21315/jps2019.30.s2.13
ABSTRACT: Liquid-liquid extraction is one of the analytical methods that is commonly
used for separation of various analytes. Nevertheless, the method is not capable to operate with hydrophobic medical drugs, particularly metformin where the drug is essentially used as an antidiabetic (Type II diabetes). Preliminary studies on extractions of metformin, phenyl biguanide and propranolol were accomplished using electrochemically modulated liquid-liquid extraction (EMLLE) method as a sample preparation method. The principle is based on application of electrically driving force to transfer the desired ions across the interface between two immiscible electrolyte solutions (ITIES). The extraction of three cationic drugs from artificial urine to 1, 2-dichoroethane, is controlled by external polarisation. By using ITIES cells, all of the drugs are found to transfer within the available potential window. The application of different galvani potential differences enables the selective extraction of drugs. Potential window of artificial urine shorter than lithium chloride as aqueous phase. Nevertheless, for both cases, the first drug to be extracted is propranolol which is the most hydrophobic drug and hence a lower potential is needed to transfer this cationic molecule across the interface as followed by phenylbiguanide and metformin.
Keywords: Electrochemically modulated liquid-liquid extraction, interface between two
1. INTRODUCTION
Diabetes is a group of metabolic disease. It is characterised by abnormalities at multiple organ sites which include defects in insulin secretion, insulin action, or both. Type II (non-insulin dependent diabetes) is due to a combination of resistance to insulin and an inadequate compensatory insulin secretory response. Type II diabetes is also known as diabetes mellitus.1 Metformin (1,
1-dimethyl-biguanide) are first-line therapy used in the treatment of diabetes mellitus. It has an oral bioavailability of 60% under fasting conditions. It is mainly absorbed in the small intestine and 90% excreted unchanged in urine.2,3
Sample preparation is one of the most vital parts in chemical analysis, especially for the determination of medical drugs in biological samples. Liquid-liquid extraction (LLE) method is most suitable for hydrophobic analytes as they will transfer easily to the organic phase unlike hydrophilic ones that will remain in the aqueous sample. The analysis of biguanide compounds is complicated owing to their hydrophilicity properties particularly for metformin.4,5 One of the ways to
reduce its hydrophilicity is by derivatisation. Derivatisation of polar anti-diabetic drugs using desyl chloride, benzoin or anthraquinone-2-sulfonyl chloride have been reported.6 Despite the enhancement of detection, there are some disadvantages of
this method; it demands multi-extraction steps and produces unstable derivatives along with side products.7–9
Another approach to overcome main drawback of LLE method, is using an electric field as a driving force for the transfer of ionised analytes from the aqueous to the organic phase. Electrochemically modulated liquid-liquid extraction is based on the extraction of ions by applying the potential difference at interface between two immiscible electrolyte solution (ITIES) and was introduced by Berduque et al.10
ITIES is formed when two bulk solvents are brought together, each containing an electrolyte, and both solvents have low mutual miscibility.
An experimental set-up based on electrochemistry at ITIES was used for the extraction of ions.10–12 In their set-up, the analytes transfer potentials were
determined by voltammetry. Then, the potentiostatic extraction process was performed to monitor current obtained over specific time. In these studies, the application of an interfacial potential between an aqueous solution containing the ions of interest flowing over a static hydrophobic phase, has caused the extraction of ions. Protonated drugs molecules (propranolol and timolol) were demonstrated to be successfully extracted from artificial urine by applying appropriate positive potential.12 In addition, selective ion-transfer (one from mixtures or co-extract ions
We demonstrated here the ion transfer that having wide range polarity across liquid-liquid interface. The transfer of metformin, phenyl biguanide and propranolol (hereinafter represented by MET, PHEBI and PROP, respectively) ions from artificial urine to organic phase was assessed. Investigation on metformin extraction performance based on potentiostatic method in hydrodynamic cell was done.
2. EXPERIMENTAL 2.1 Chemicals and Reagents
Lithium chloride (LiCl, 97%) as an aqueous phase, metformin hydrochloride (97%), phenyl biguanide hydrochloride (98%) and propranolol hydrochloride (99%), all aqueous phase solutions, were prepared in ultrapure water (18.2 MΩ.cm Elga Water). pH adjustment of aqueous solution was done by using sodium hydroxide (97%) from BDH Prolabo and hydrochloric acid (37%) from Merck. Artificial urine was composed of calcium chloride dihydrate (1.103 g l–1, Fisher
Scientific) , sodium chloride (2.295 g l–1, Sigma Aldrich) , sodium sulfate (2.25 g
l–1, Sigma Aldrich) , potassium phosphate (1.40 g l–1, Sigma Aldrich), potassium
chloride (1.60 g l–1, Sigma Aldrich), ammonium chloride (1.00 g l–1, ProLabo),
urea (25 g l–1, Merck), creatinine (1.10 g l–1, Sigma Aldrich). All aqueous phase
solutions were prepared in ultrapure water (Elga Water). 1,2-dichloroethane (1,2-DCE) as an organic phase, bis(triphenylphosphoranylidene) ammonium chloride (BTPPA+Cl-, 97%) and potassium tetrakis(4-chlorophenylborate) (K+TPBCl-,
98%) were purchased from Sigma Aldrich. For organic phase, BTPPA+TPBCl
-was prepared by methathesis.13 High performance liquid chromatography (HPLC)
grade acetonitrile was from Sigma Aldrich. Buffer (pH 6.2) containing 20 mM of sodium phosphate monobasic monohydrate (Sigma Aldrich), and trimethylamine (Sigma Aldrich) was prepared in ultrapure water (Elga Water). Ortho-phosphoric acid to adjust pH of buffer was purchased from BDH Prolabo.
2.2 Instrumentation 2.2.1 Voltammetry
Cyclic voltammetry was performed to investigate electrochemical properties of targeted analytes. Voltammetry experiments were performed with an EmStat3
potentiostat supplied by Palm Sens (Netherlands) which was operated in four electrodes mode. The software used was PSTrace 4.6. The experimental set up is shown in Figure 1. The surface area of the interface was 1.10 cm2. Each
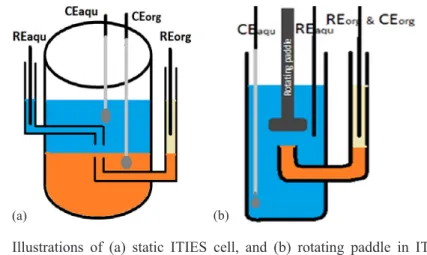
electrode was used in the aqueous phase. The reference electrode for organic phase was formed by placing an Ag/AgCl reference electrode in 10 mM of bis(triphenylphosphoranylidene) ammonium chloride in 10 mM of lithium chloride. Two types of cells were investigated: (1) static ITIES cell; and (2) rotating paddle in static ITIES cell, as shown below. All cell has same scheme which is the following:
Ag | AgCl | 10 mM BTPPA+Cl− in 10 mM LiCl | 10 mM BTPPA+
TPBCl− in DCE ǁ 10 mM LiCl | AgCl | Ag (1)
(a) (b)
Figure 1: Illustrations of (a) static ITIES cell, and (b) rotating paddle in ITIES cell. REorg is Reference electrode for the organic phase; REaqu is reference electrode for the aqueous phase; CEaqu is counter electrode for the aqueous phase; CEorg is counter electrode for the organic phase; blue colour represents aqueous phase; orange represents organic phase; and pale yellow represents organic reference solution.
2.2.2 HPLC-UV
A Shimadzu LC-20AD pump equipped with Shimadzu SPD-20 A UV-Vis detector was used. The detector wavelength was set at λ = 230 nm. Separation was carried out using a column Agilent Zorbax TMS (C1) (80 Å, 4.6 × 250 mm, 5 µm) and protected by a guard column of Agilent Zorbax Reliance Cartridge Guard Column, 4.6 mm ID × 12.5 mm PPS Polymer Tubes. Data acquisition was obtained using LabSolutions software. The mobile phase composition was 20 mM sodium phosphate monobasic buffer (pH 6.2):acetonitrile:trimethylamine (50:50:0.2). It was filtered using Nylon membrane filter (0.22 µm) from Agilent Technologies (Waldbronn, Germany) and degassed for 15 min before use. Injection volume was 20 µl. The flow rate was 1.3 ml min–1 at 37°C. Temperature remains constant with
2.3 Sample Preparation by Applying Potential Using Potentiostat
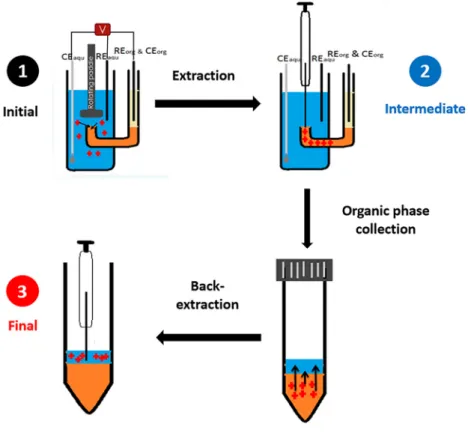
A rotating paddle in static ITIES cell was used. The preparation of the biphasic system is as mentioned in Section 2.2.1. The extraction was carried out using chronoamperometry technique. At Stage 1, potential of +0.80 V was applied to the system for 900 s. After that, the electrode was removed, and the organic phase was taken out. It was transferred to centrifuge tube. Deionised (DI) water was placed into the centrifuge tube for the purpose of back-extraction (Stage 2). The solution was vortexed and centrifuged for 90 s and 60 s, respectively. Finally, the aliquot of final aqueous phase was injected into HPLC (Stage 3). The following diagram summarises the procedure.
Figure 2: Extraction procedure of the electrochemically modulated liquid-liquid extraction. In Stage 1, targeted analytes are extracted from the aqueous sample to organic phase. In Stage 2, the organic phase transferred to centrifuge tube and the analytes are back-extracted to a final aqueous phase (Stage 3).
The aqueous phases at all stages are analysed by HPLC. REaqu represents Ag/
AgCl reference electrode; CEaqu represents platinum mesh counter electrode; and REorg and CEorg are Ag/AgCl reference electrodes.
3. RESULTS AND DISCUSSION 3.1 Cyclic Voltammetry Study 3.1.1 LiCl-1,2-DCE as biphasic system
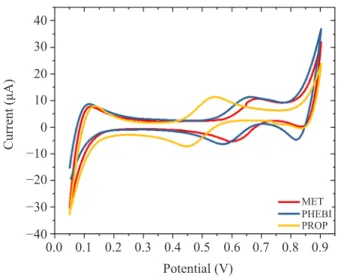
Figure 3 shows the cyclic voltammograms resulting from the transfer of MET, PHEBI and PROP across the interface. The addition of positively charged MET to the lithium chloride aqueous phase led to a positive peak current at ~0.655 V. This peak result of MET transfer from aqueous phase to organic phase. Meanwhile, the negative peak on the reverse sweep represents the back transfer of MET from organic to aqueous phase. The same trend was also observed for PHEBI and PROP. The ion-transfer is a reversible reaction. The peak transfer of targeted analytes is the mid-peak potential, and can be calculated as shown in Equation 1:
E E E 2 1 Forward Reverse 1 2 = ^ + h (1)
where Eforward is the peak transfer potential during forward scan, and Ereverse is the
peak transfer potential during reverse scan.
The trend of the ion transfer was found to be PROP< PHEBI < MET at the interface of LiCl-DCE. The transfer potential is followed their polarity.14 In the Table 1,
we report the log Po and the transfer potential.
0.9 0.0 −40 −30 −20 −10 0 10 40 30 20 0.1 0.2 0.5 0.8 Potential (V) Current (μA) MET PHEBI PROP 0.6 0.7 0.3 0.4
Figure 3: Cyclic voltammograms of 170 µM of targeted analytes in ITIES cell. Scan rate = 5 mV s–1. 10 mM BTPPA+ TPBCl– in DCE
(org). 10 mM LiCl(aq). REaqu is Ag/AgCl reference electrode; CEaqu is platinum mesh counter electrode; REorg is Ag/AgCl reference electrode; and CEorg is platinum mesh counter electrode.
Table 1: Values of log Po and transfer potential.
Analytes LiClTransfer potential, V log Po pKa (aq) Artificial urine(aq)
PROP +0.492 +0.476 2.80* 9.41
PHEBI +0.612 +0.614 1.08 10.8
MET +0.646 +0.700 –2.60 11.5
Creatinine – +0.700 –0.80 6.85
Notes: *Calculated using (ACD/Labs) software
3.1.2 Artificial urine-1,2-DCE as biphasic system
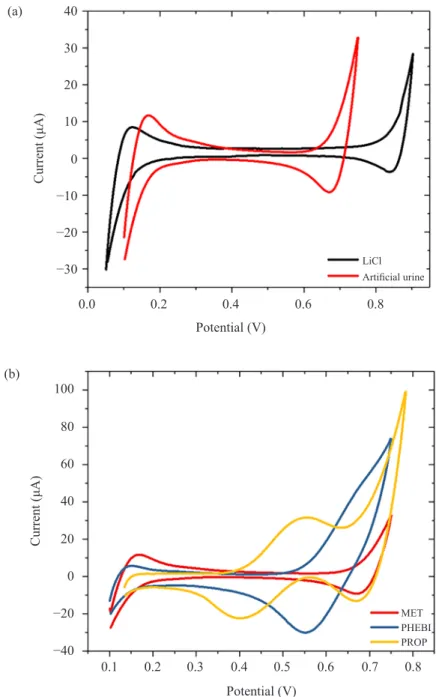
Investigation on ion-transfer in artificial urine as aqueous phase was done. As can be seen in Figure 4(a), the available potential window of artificial urine (0.10– 0.75 V) was decreased compared to the one of lithium chloride (0.05–0.90 V) as the aqueous phase. According to Collins et al., the additions of KH2PO4, NH4Cl,
creatinine, Na2SO4, KCl, NaCl all resulted in shortening the available potential
window at the ITIES.12 The species present in the urine that contribute to the
shortening of the potential window are known to transfer across the ITIES, namely, K+, NH
4+, Na+ and creatinine. Since it is the least hydrophilic ion, creatinine is the
main contributor to ion-transfer behaviour of artificial urine at the ITIES.
In artificial urine (Figure 4B), there is no well-defined transfer peak for MET. However, at the positive end of the potential window, an increase in current was observed. Thus, MET transferred occurs at the end of the available potential window at the artificial urine-DCE interface and overlapping with the transfer of urine components. This is due to the high hydrophilicity properties of MET. Considering PHEBI in artificial urine, it was found that the transfer peak is not well separated from the potential limit, but it can be defined as being +0.61 V. It gives an increase in current at the end of the potential window. The peak has a greater contribution from background processes at the higher potentials. The addition of PROP in artificial urine produced a positive peak at ~0.549 V during the forward sweep, due to PROP being transferred from the aqueous phase into the organic phase. The back transfer of PROP from organic to aqueous phase give a negative peak in the reverse sweep. The peak transfer of PROP is well defined in artificial urine as can be seen in Figure 4(b). PROP contains a naphthalene group, which makes it more hydrophobic than MET and lower potential needed to transfer from aqueous to organic phase.
0.0 −30 −20 −10 0 10 40 (a) 30 20 0.2 0.8 Potential (V) Current (μA) Artificial urine LiCl 0.6 0.4 −40 −20 0 100 (b) 40 60 80 20 Potential (V) Current (μA) 0.1 0.2 0.5 0.8 MET PHEBI PROP 0.6 0.7 0.3 0.4
Figure 4: Cyclic voltammograms of (a) blank solution, and (b) 90.9 µM of targeted analytes in artificial urine, in ITIES cell. Scan rate = 5 mV s−1. 10 mM BTPPA+
TPBCl- in DCE
(org). REaqu is Ag/AgCl reference electrode; CEaqu is platinum mesh counter electrode; REorg is Ag/AgCl reference electrode; and CEorg is platinum mesh counter electrode.
3.2 Potentiostatic Extraction
From previous section, each of the ions can be transferred to organic phase at different potential. Thus, the ions can be extracted selectively to organic phase when specific potential is applied to the cell. In this section, a constant extraction potential was applied using chronoamperometry techniques. A rotating paddle was installed in the aqueous phase to enhance the flux of the molecules transferred as shown in Figure 1(b). In this hydrodynamic cell, voltammetric studies were operated with three electrodes. The aqueous phase contained one reference and one counter electrode. Meanwhile, the organic phase only had one electrode that acted as reference and counter electrode. Potential applied must be higher than any transfer potential of targeted drugs to ensure the analytes are fully transferred across interface. Thus, +0.80 V was selected using chronoamperometry set up as potential was applied for 15 min to transfer drugs from aqueous to organic phase.
3.3 Investigation on MET Extraction Performance
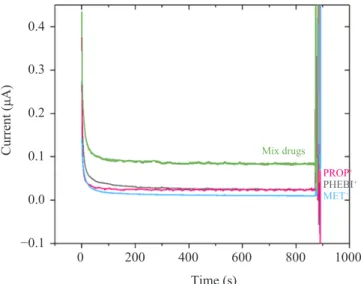
Extraction for each drug individually and in mixture simultaneously were performed at constant potential (+0.80 V) for 900 s. Chronoamperometry of both cases are shown below (Figure 5). By integrating current versus time curve, we can calculate the total charge that was transferred up to 900 s at different potential applied. −0.1 1000 800 600 400 200 0 0.0 0.1 0.2 0.4 0.3 Time (s) Mix drugs Current (μA) MET+ PHEBI+ PROP+
Figure 5: Chronoamperometry for potential driven extraction of analytes. 10 mM LiCl(aq), 100 µl of 10 mM of BTPPA+ TPBCl- in 1,2-DCE
(org). [Target analytes] = 0.164 mM; scan rate = 5 mV s–1; time extraction = 900 s; and rotation speed = 150 rpm.
Next, extraction of MET was examined. There are two steps of preconcentration procedure as illustrated in Figure 2, which consisted of: (1) extraction of analyte from aqueous phase to intermediate organic phase; and (2) back-extraction of analyte from intermediate organic phase to final aqueous phase. Number of total charges, Q was obtained during chronoamperometry. Thus, number of moles extracted to organic phase at Stage 2 can be calculated according to Faraday’s Law constant:
Q = zNF (2)
where z is the charge transfer of analyte, N is the number of moles, and F is Faraday constant with 96 485 C mol–1.
Meanwhile, HPLC analysis at Stage 3 gave information on how many moles of drugs were extracted. The extraction efficiency can be calculated by comparing the initial number of moles with final number of moles.
By using this formula, the comparison between number of moles extracted during chronoamperometry and moles injected into HPLC can be done (Collins et al.).12
Based on HPLC, the number of moles detected is only 2.10 × 10⁻¹⁰ moles whereas
the number of moles transferred was 1.33 × 10⁻⁹ moles as depicted in Figure 6.
0.08 0.06 0.04 0.02 0.00 0.16 0.14 0.12 0.10 Determination method Electrochemistry HPLC Moles (nmoles)
Figure 6: Comparison of faradaic and real extraction yield. 10 mM LiCl(aq), 100 µL of 10 mM of BTPPA+TPBCl- in 1,2-DCE
(org). [MET] = 0.164 mM; time of extraction = 900 s; potential applied = + 0.8 V; and rotation speed = 150 rpm.
These results show a large discrepancy between the number of moles extracted during electrochemistry extraction (Stage 1, Figure 2) and the number of moles actually detected by HPLC (Stage 3, Figure 2). Indeed, 84.2% of the moles of MET extracted are lost during the rest of the sample pre-treatment. There might be several reasons for this loss. The first reason could be that the MET is not fully back-extracted. Back-extraction using same organic phase containing drugs extracted was performed twice. The main purpose of this step is to confirm that all drugs extracted are not trapped inside the organic phase. As shown below in Figure 7, only 2.63% moles of MET extracted was found during second back-extraction step. It proved that the back-back-extraction step did not contribute to the decrease of metformin extraction yield.
1
0.01 0.1
No. of back extraction
2nd extraction 1st extraction
No. of moles extracted (nmoles)
Figure 7: Graph of moles extracted against back-extraction step. 100 µl of H2O(aq), 100 µl of 10 mM of BTPPA+ TPBCl- in 1,2-DCE
(org). [MET] = 0.164 mM; vortex time = 90 s; and centrifuge time = 3 min.
The second possibility is that MET was back transferred spontaneously after the extraction potential was switched off and the electrochemical cell was left at open-circuit potential. In order to investigate this possibility, we varied the waiting time between the moment at which the extraction potential was switched off, and the organic phase collection was controlled. Figure 8 shows the number of moles detected by HPLC as a function of the waiting time. When the organic phase was collected as soon as the potential was switched off, 0.02 nmol were collected.
If the waiting time (Stage 2, Figure 2) was 60 s or 300 s, the number of moles detected dropped to 0, demonstrating that the extracted MET transferred back spontaneously to the aqueous phase. Such results indicate the organic phase should be collected when the interfacial potential difference remained applied.
150 100 50 200 250 300 0 Waiting time (s) Moles (nmoles) 0.025 0.020 0.015 0.010 0.005 0.000
Figure 8: Graph of moles detected by HPLC against waiting time after extraction. Experimental conditions: mM LiCl(aq), 10 mM of BTPPA+ TPBCl- in 1,2-DCE(org). [MET] = 0.164 mM; time extraction = 900 s; potential applied = + 0.8 V; and rotation speed = 150 rpm.
4. CONCLUSION
Targeted analytes transfer potential was successfully determined by cyclic voltammetry. The transfer potential increased as the hydrophobicity decreased. This technique must be improved to achieve good extraction efficiency and good enrichment factor. As it is proven that the loss of analyte is not because of back-extraction step, different cell design must be investigated in the future. A few important factors have to be noted in order to design different cell such as: (1) the biphasic system must be connected to potentiostat during sampling of organic phase; and (2) the rotation should not disturb interface surface stability.
5. ACKNOWLEDGEMENTS
Financial support for this work by Universiti Sains Malaysia has been provided by the Short Term Grant (303/PKIMIA/6313303). Maizatul Najwa Jajuli thanked the French Embassy in Malaysia for financial aid through Campus France programme. This research was partly funded by the Agence Nationale de la Recherche for the funding of the HYPERION project (grant number: ANR-14-CE14-0002-01).
6. REFERENCES
1. American Diabetes Association. (2010). Diagnosis and classification of
diabetes mellitus. Diab. Care, 33(Supp. 1), S62–S69, https://doi.org/10.2337/ dc10-S062.
2. Montoya-Eguía, S. L. et al. (2015). Comparative pharmacokinetic study among 3
metformin formulations in healthy mexican volunteers: A single-dose, randomized, open-label, 3-period crossover study. Curr. Ther. Res., 77, 18–23, https://doi. org/10.1016/j.curtheres.2014.09.003.
3. Gholivand, M. B. et al. (2014). Synthesis of Fe-Cu/TiO2 nanostructure and its use
in construction of a sensitive and selective sensor for metformin determination.
Mater. Sci. Eng., C, 42, 791–798, https://doi.org/10.1016/j.msec.2014.05.077.
4. Berduque, A. et al. (2005). Electrochemically modulated liquid-liquid extraction
of ions. Anal. Chem., 77, 7310–7318, https://doi.org/10.1021/ac051029u.
5. Georgita, C. et al. (2010). Comparison of a LC/MS method with a LC/UV method
for the determination of metformin in plasma samples. Farm., 58, 158–169.
6. Ben-Hander, G. M. et al. (2013). Hollow fiber liquid phase microextraction
with in situ derivatization for the determination of trace amounts of metformin hydrochloride (anti-diabetic drug) in biological fluids. J. Chromatogr. B Anal.
Technol. Biomed. Life Sci., https://doi.org/10.1016/j.jchromb.2013.10.007.
7. Juan, J. J. et al. (2006). Study on a new precolumn derivatization method in the
determination of metformin hydrochloride. J. Chromatogr. Sci., 44, 193–199, https://doi.org/10.1093/chromsci/44.4.193.
8. Ohta, M. et al. (1993). Determintion of a biguanide, metformin, by
high-performance liquid chromatography with precolumn fluoresence detector.
Anal. Sci., 9, 217–220, https://doi.org/10.2116/analsci.9.217.
9. Ross, M. S. F. (1977). Determination of metformin in biological fluids
by derivatization followed by high-performance liquid chromatography.
J. Chromatogr., 133, 408–411, https://doi.org/10.1016/s0021-9673(00)83506-2.
10. Berduque, A. et al. (2005). Electrochemically modulated liquid-liquid extraction of
ions. Anal. Chem., 77(22), 7310–7318, https://doi.org/10.1021/ac051029u. 11. Berduque, A. & Arrigan, D. W. M. (2006). Selectivity in the coextraction of cation
and anion by electrochemically modulated liquid-liquid extraction. Anal. Chem., 78(8), 2717–2725, https://doi.org/10.1021/ac0521192.
12. Collins, C. J., Berduque, A. & Arrigan, D. M. W. (2008). Electrochemically modulated liquid-liquid extraction of ionized drugs under physiological conditions.
Anal. Chem., 80(21), 8102–8108, https://doi.org/10.1021/ac800646b.
13. Lee, H. J. et al. (1997). Amperometric ion sensors based on laser-patterned composite polymer membranes. J. Electroanal. Chem., 440(1–2), 73–82, https://doi.org/10.1016/s0022-0728(97)80042-3.
14. Jajuli, M. N. et al. (2019). Electrochemically modulated liquid-liquid extraction
for sample enrichment. Anal. Chem., 91, 7466–7473, https://doi.org/10.1021/acs. analchem.9b01674.