HAL Id: hal-01240948
https://hal.archives-ouvertes.fr/hal-01240948
Submitted on 5 Mar 2018
HAL is a multi-disciplinary open access
archive for the deposit and dissemination of
sci-entific research documents, whether they are
pub-lished or not. The documents may come from
teaching and research institutions in France or
abroad, or from public or private research centers.
L’archive ouverte pluridisciplinaire HAL, est
destinée au dépôt et à la diffusion de documents
scientifiques de niveau recherche, publiés ou non,
émanant des établissements d’enseignement et de
recherche français ou étrangers, des laboratoires
publics ou privés.
Epitaxial growth and ferrimagnetic behavior of
MnFe2O4(111) ultrathin layers for room-temperature
spin filtering
S. Matzen, J. -B. Moussy, R. Mattana, K. Bouzehouane, C. Deranlot, F.
Petroff, J. C. Cezar, M. -A. Arrio, Ph. Sainctavit, Christophe Gatel, et al.
To cite this version:
S. Matzen, J. -B. Moussy, R. Mattana, K. Bouzehouane, C. Deranlot, et al.. Epitaxial growth and
ferrimagnetic behavior of MnFe2O4(111) ultrathin layers for room-temperature spin filtering. Physical
Review B: Condensed Matter and Materials Physics (1998-2015), American Physical Society, 2011, 83
(18), pp.184402. �10.1103/PhysRevB.83.184402�. �hal-01240948�
PHYSICAL REVIEW B 83, 184402 (2011)
Epitaxial growth and ferrimagnetic behavior of MnFe
2O
4(111) ultrathin layers
for room-temperature spin filtering
S. Matzen,1J.-B. Moussy,1R. Mattana,2K. Bouzehouane,2C. Deranlot,2F. Petroff,2J. C. Cezar,3M.-A. Arrio,4 Ph. Sainctavit,4C. Gatel,5B. Warot-Fonrose,5and Y. Zheng6
1CEA-Saclay, IRAMIS, SPCSI, F-91191 Gif-Sur-Yvette, France
2Unit´e Mixte de Physique CNRS/Thales, F-91767 Palaiseau, France, and University of Paris-Sud 11, F-91405 Orsay, France 3ESRF, F-38043 Grenoble, France
4IMPMC, F-75015 Paris, France 5CEMES-CNRS, F-31055 Toulouse, France 6INSP, CNRS UMR7588, F-75015 Paris, France
(Received 22 December 2010; published 9 May 2011)
We report on the epitaxial growth and physical properties of spinel MnFe2O4(111) thin films with thicknesses
down to 2 nm. The thin films, grown on α-Al2O3(0001) single crystals or Pt(111) buffer layers by oxygen-assisted
molecular beam epitaxy, exhibit high structural order with sharp interfaces and low roughness. The electrical and magnetic properties are carefully investigated and it is shown that MnFe2O4(111) ultrathin films keep an insulating
and ferrimagnetic behavior at room temperature. Special attention is given to the iron/manganese valence state and the cationic ordering. X-ray absorption spectroscopy and magnetic circular dichroism measurements reveal that thin films contain mainly Fe3+and Mn2+cations, distributed predominantly in a normal spinel structure. This study proves the high potential of MnFe2O4to be used as a magnetic tunnel barrier for spin filtering applications
at room temperature.
DOI:10.1103/PhysRevB.83.184402 PACS number(s): 75.70.−i, 75.25.−j, 85.75.−d, 75.47.Lx
I. INTRODUCTION
The generation of highly spin-polarized currents is one of the critical technologies for developing high performance spintronics devices such as magnetic random access memories and spin metal-oxide-semiconductor field-effect transistors. In the last few years, spin filters, constituted by a ferro-magnetic or ferriferro-magnetic tunnel barrier, have emerged as a promising alternative to create artificial spin-polarized current sources. Ferromagnetic spin filters rely on the spin-dependent transmittance of ferromagnetic tunnel barriers due to the existence of an exchange-split band gap. Spin filtering at room temperature could potentially impact future generations of spin-based device technologies,1not only because spin filters may function with 100% efficiency2but also because they can be combined with any nonmagnetic metallic electrode, thus providing a versatile alternative to half-metals or MgO-based classic tunnel junctions.
Following the pioneering work of Moodera et al.,3 who showed spin filtering at low temperature using EuS fer-romagnetic tunnel barriers with a Curie temperature (Tc)
around 16 K, spin filtering has been demonstrated using oxide barriers, such as EuO (Ref.4) (Tc= 69 K), perovskite
oxides5 (BiMnO3, Tc= 105 K), and, more recently, spinel
oxides or ferrites barriers: NiFe2O4(Ref.6) (Tc= 850 K) and
CoFe2O4(Refs.7–10) (Tc= 793 K). As the Curie temperature
of ferrites is well above room temperature, efficient room-temperature spin-polarized sources could be obtained using these oxides. However, room-temperature spin filtering has only been reported in CoFe2O4-based tunnel junctions8,10due to the difficulty of fabricating room-temperature ferrimagnetic barriers.
Manganese ferrite oxide (MnFe2O4) is another exciting and promising candidate for room-temperature spin-filter
applications. Until now, MnFe2O4 films have essentially been grown by pulsed laser deposition at thicknesses above 100 nm for microwave applications. Toward this goal, the ability to enhance magnetic anisotropy in MnFe2O4films has been investigated by using alternating-target laser ablation deposition technique in order to tune the cation distribution and tailor the magnetic properties of manganese ferrites.11,12 The Mn substitution to Fe3O4has also been studied for controlling properties such as carrier concentration and magnetism in highly conductive thin films, and Ishikawa et al.13 have successfully prepared low-resistance and spin-polarized Mn-doped Fe3O4 thin films at room temperature. MnFe2O4 is considered to be predominantly of the normal spinel structure, as about 80% of tetrahedral sites are populated by Mn2+ ions.14 It exhibits insulating properties with a small gap15 and has a low magnetocrystalline anisotropy constant (K1) at room temperature (K1= −33.103erg/cm3) corresponding to an anisotropic field (Ha) of 175 Oe.16Thanks to its insulating
properties and high Curie temperature (Tc= 573 K), MnFe2O4
could act also as a spin filter at room temperature if the film still exhibits the required physical properties when its thickness is reduced to a tunnel barrier thickness (e.g., a few nanometers). As its predicted spin decomposed exchange splitting of the conduction bands15 is higher (3.85 eV) than for the inverse NiFe2O4 (1.21 eV) and CoFe2O4 (1.28 eV) spinel oxides, MnFe2O4could lead to better spin-filtering efficiencies.
In this paper, we study the potential of MnFe2O4 to be used as a magnetic tunnel barrier in spin-filter-based magnetic tunnel junctions. We report on the epitaxial growth of MnFe2O4(111) ultrathin films, using oxygen-assisted molecular beam epitaxy (MBE). A number of in situ and
ex situ characterization techniques have been used to optimize
the growth in order to obtain epitaxial ultrathin films with excellent structural and chemical properties. Then, a careful 184402-1
study of the electrical and magnetic properties has been made with special attention given to the iron/manganese cationic ordering showing that MnFe2O4(111) ultrathin films have a huge potential to be used as room-temperature magnetic tunnel barriers for spin-filtering applications.
II. EXPERIMENT
The MnFe2O4(111) thin films have been grown by oxygen-assisted MBE following a procedure inspired by the previously optimized growth of Fe3O4(111) (Ref.17) and CoFe2O4(111) (Ref. 18) on α-Al2O3(0001) substrates with or without a Pt(111) underlayer. Manganese ferrites were deposited at 450◦C with a radio frequency oxygen plasma source operated during the metal (Fe and Mn) evaporation in an ultrahigh vacuum (UHV) chamber with an oxygen partial pressure of 10−8 mbar during deposition. The system allowed for the real-time observation of the structural evolution by in situ reflection high-energy electron diffraction (RHEED), as well as postdeposition verification of the iron and manganese oxi-dation states in the ferrite films by in situ x-ray photoemission spectroscopy (XPS).
The bulk structure of thin films was characterized ex situ by x-ray diffraction (XRD) using the Cu Kα1radiation in the 2θ range from 5◦to 85◦. X-ray reflectivity (XRR) and atomic force microscopy (AFM) have also been used to measure the films thicknesses and root-mean-square (rms) roughnesses. A study by transmission electron microscopy (TEM) has also been performed, allowing us to describe the structure of the films in both conventional and high-resolution [high-resolution transmission electron microscopy (HRTEM)] modes using a Tecnai F20 fitted with a spherical aberration corrector (point resolution= 0.12 nm). The cross-sectional specimens for TEM studies were cut along the (112) spinel planes before thinning by tripod grinding and ion milling to achieve the electron transparency.
The electrical properties of the MnFe2O4(111) layers grown on a Pt(111) underlayer (20 nm thick) were probed with a conductive tip atomic force microscope (CT-AFM).19 Resis-tance mappings of 20 μm× 20 μm regions were collected, by applying a bias voltage of 1 V, at room temperature with a 10−12–10−4 A current range and Si3N4 tips coated with B-doped diamond.
The magnetic behavior of thin films has been investigated using a vibrating sample magnetometer (VSM) at room temperature with a magnetic field applied up to 2 T or using a VSM-PPMS (physical properties measurement system) setup from room temperature down to liquid helium with a magnetic field up to 7 T. The majority of the measurements were performed with the magnetic field aligned parallel to the film surface. However, perpendicular geometry measurements were also taken to check the anisotropy in the films.
In order to access the cationic sites’ distribution, the valence, and the specific magnetic properties of 3d elements (Fe and Mn) in our MnFe2O4 ultrathin films, we performed x-ray absorption spectroscopy (XAS) and x-ray magnetic circular dichroism (XMCD) experiments at the Mn and Fe L2,3 edges at room temperature at the ID08 beamline of the European Synchrotron Radiation Facility (ESRF). Samples were exposed to a magnetic field of 5 T applied perpendicular
to the sample surface and parallel to the wave vector of incoming photons. XAS and XMCD spectra were recorded at 300 K by using the circularly polarized light with the degree of circular polarization almost 100% in the total electron yield (TEY) mode. The XMCD spectra were taken switching both the circular polarization helicity of the x-rays and the orientation of the magnetic field in order to minimize any systematic drift. The base pressure of the system was around 5× 10⁻¹⁰ Torr. The total resolution for XAS was less than 100 meV, while that for XMCD was about 120 meV at the Mn L2,3and Fe L2,3edges.
III. RESULTS AND DISCUSSION A. Structural and chemical characterizations
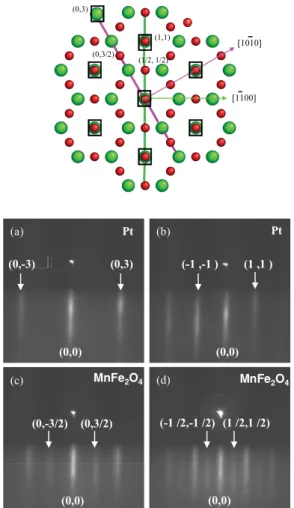
The magnetism in ferrite thin films has been shown to be very sensitive to effects such as strain20 and stoichiometry,13 while the structure and chemistry at the interfaces in spin-filter-based tunnel junctions are also known to play a crucial role in the spin-filtering efficiency. Our structural study therefore began with in situ RHEED analyses performed in real time throughout the deposition process. The RHEED patterns were studied along the [1010] and [1100] directions based in the hexagonal real space of the α-Al2O3(0001) substrate. Figure1shows the RHEED patterns along both observation directions of a MnFe2O4(5 nm) ultrathin layer grown on top of a buffer layer of Pt (20 nm). Immediately after placing the buffer layer into the flow of metal (Fe, Mn) and oxygen, smooth streaks corresponding to the (0,1)- and (1,1)-type planes of the face-centered-cubic (fcc) sublattice are observed, indicating that the film growth is two dimensional as of its initial stages. Intermediate (0, 3/2) and (1/2, 1/2) streaks next appear after about 10 min, corresponding to a film thickness of about 1 nm and revealing the characteristic RHEED patterns of the spinel structure. These intermediate streaks persist and intensify throughout the entire duration of the deposition, indicating that the desired spinel phase is maintained and that the growth mode remains two dimensional. We have controlled the MnFe2O4 growth mode until thicknesses up to 50 nm. A study of the spacing between the streaks in the RHEED patterns of MnFe2O4films show that our films are fully relaxed from 1.2 nm thick (i.e., under no mechanical strain due to the
α-Al2O3or Pt interface).
The control of the composition of our MnFe2O4(111) ultrathin films was performed using in situ XPS, with an Al
Kα source. We have focused our attention on the Fe 2p and
Mn 2p peaks in the XPS spectra, as is shown in Fig.2 for a MnFe2O4(5 nm) layer. In the case of the Fe 2p spectrum of MnFe2O4, the presence of Fe3+cations yields a well-defined structure 8 eV after the Fe 2p3/2 peak (711 eV), whereas in Fe3O4this peak is smeared out due to the presence of both Fe2+ and Fe3+in almost equal proportion.21The shape of the Mn 2p also signals the presence of Mn2+rather than another oxidation state. Figure 2 shows the Mn 2p electron binding-energy spectrum which consists of spin-orbit-split 2p3/2 and 2p1/2 peaks. These two peaks are very close to those of the 2p3/2and 2p1/2states of MnO (2p3/2∼ 640.6 and 2p1/2∼ 652.2 eV).22 Furthermore, we observe the formation of shake-up satellites, which are offset from the main peaks of the Mn 2p doublet
EPITAXIAL GROWTH AND FERRIMAGNETIC BEHAVIOR . . . PHYSICAL REVIEW B 83, 184402 (2011) (0,0) (0,0000))) (0,0) (0,-3) (0,3) (a) (0,0) (-1 ,-1 ) (1 ,1 ) (b) (0,0) (0,-3/2) (0,3/2) (c) (0,0) (-1 /2,-1 /2) (1 /2,1 /2) (d) Pt MnFe2O4 Pt MnFe2O4 (0,3/2) (1,1) (1/2, 1/2) (0,3) [1010] [1100]
FIG. 1. (Color online) Top: Schemating reciprocal lattices of α-Al2O3(0001) (large green circle), Pt(111) (square), and
MnFe2O4(111) (small red circle). Bottom: RHEED patterns of the
Pt(111) underlayer (a,b) and a 5-nm MnFe2O4(111) thin film (c,d)
observed along the [1010] (left column) and [1100] (right column) directions.
by approximately 5 eV toward higher binding energies. This behavior is typical for Mn2+ systems.23,24 In summary, the development of the Mn 2p doublet provides clear evidence for the presence of Mn2+ions.
However, from the Mn 2p signal, we cannot exclude any presence of Mn3+. Indeed, it is seen that the 2p3/2peak is split by two lines with the energy difference of 1 eV. This could verify the multivalence character of Mn ions, due to Mn2+ (∼ 640 eV) and Mn3+ (∼ 641 eV) ions,25 often observed in manganite thin films. As many groups24 have questioned the suitability of the Mn 2p signal for investigations of the Mn valence, we performed XAS and XMCD experiments to access more precisely the valence and the cationic sites’ distribution in our MnFe2O4ultrathin films (see Sec. III C). By comparing the Fe 2p and Mn 2p peak intensities, we were also able to quantify the Mn/Fe ratio in our films. In all cases, we obtained the correct stoichiometry within the accuracy limit of the XPS method, which is within 10% of the expected 1/2 ratio.
Ex situ characterization of the MnFe2O4 (15 nm) thin
layers has been done by XRD [Fig.3(a)]. At first, only 111-type reflections were observed, confirming the unidirectional growth by MBE and excluding the possible existence of
735 730 725 720 715 710 705 2p1/2 2p 3/2 Fe3+ 665 660 655 650 645 640 635 2p1/2 2p3/2 M n2+ Intensity (arb . units)
Binding Energy (eV)
Binding Energy (eV)
Intensity (arb
. units)
FIG. 2. Fe 2p and Mn 2p XPS spectra of an α-Al2O3/MnFe2O4
(5 nm) thin film.
parasitic phases. The rocking curves obtained on the (222) peaks have a full-width at half-maximum (FWHM) of 0.05◦for films of 15 nm, showing the high texture of the layers. The out-of-plane cell parameter c is 0.8513 nm, comparable to the bulk cell parameter. X-ray reflectivity measurements [Fig. 3(b)] additionally allowed us to check the film thicknesses predicted from the calibration of the atomic fluxes. We successfully fitted the periodicity of the reflectivity oscillations to find thicknesses that agree with the expected values. These measurements gave also another indication of the very low films roughness, as had already been seen on the RHEED patterns. A typical x-ray reflectivity curve is shown in Fig.3(b), with the parameters of the fit (SLD is the scattering length density obtained). A low rms surface roughness of 0.2 nm was also determined using an AFM in tapping mode for a MnFe2O4(5 nm) layer [Fig.3(c)]. This remarkably low value lends itself very well to the growth of more complex epitaxial heterostructures, such as future magnetic tunnel junctions.
The microstructure of MnFe2O4ultrathin films was studied by high- and low-resolution TEM over a significant portion of each of the films along the [112] zone axis. Figure4(a)shows a low-magnification micrograph of a 5-nm-thick MnFe2O4 film on its α-Al2O3(0001) substrate. This image demonstrates the homogeneity and the smoothness of the layer across a large portion of substrate surface. Figure 4(b) shows the typical HRTEM micrograph of a 5-nm-thick MnFe2O4 film. 184402-3
0 3 nm 0.2 0.4 0.6 0.8 1.0 1.2 1.4 10 10 10 10 10 10 Re fl e c tiv it y ( a rb. unit s ) θ (deg.) Measurement Fit (b) 18.20 18.25 18.30 18.35 18.40 18.45 (222) FWHM= 0.05 deg.
Intensity (arb. units)
Δω (deg.) 20 30 40 50 60 70 80 90 (111) (222) (333) (444) MnFe O α-Al O (00012) α-Al O (0003) α-Al O (0006) I (ar b. units) 2θ (deg.) (a) rms roughness=0.2 nm (c) Layer Thickness (nm) Roughness (nm) SLD (10 Å ) MnFe O 16.2 0.7 37.4
FIG. 3. (Color online) (a) Rocking curve of the (222) peak for a 15-nm-thick MnFe2O4(111) film grown on α-Al2O3. The typical XRD
pattern is shown in the inset. (b) X-ray reflectivity of an α-Al2O3/MnFe2O4thin film with the associated fit table. (c) AFM image (3 μm× 3 μm)
of an α-Al2O3/MnFe2O4(5 nm) thin film.
In this image, we clearly identify the (111) planes of Mn and Fe cations oriented parallel to the substrate surface. The homogeneity and high structural quality of the oxide layer is evident with an α-Al2O3(0001)/MnFe2O4(111) interface which is perfectly flat and abrupt. There is no trace of parasitic phases resulting from the formation of unwanted (Fe, Mn) oxides during the early stages of film growth. These observations are in good agreement with the real-time RHEED diffraction patterns in which a single-phase and two-dimensional growth mode is observed as soon as the oxide begins to form.
Figure5(a)shows the strain map along the growth direction. This image has been calculated from the HRTEM micrograph using the geometric phase analysis (GPA) method.26 The deformation value on the MnFe2O4 layer compared to the substrate is equal to 14%, very close to the expected theoretical value (13.5%) in considering the (111) plane for MnFe2O4 and the (0006) plane for Al2O3. This result confirms the fully relaxed state of the ferrite layer. The stress relaxation
FIG. 4. Cross-sectional TEM images of a MnFe2O4(5 nm) film
viewed along the [112] zone axis. (a) Low magnification image. (b) High magnification image. The presence of a tilted APB has been labeled by white dashed lines.
is due to the network of misfit dislocations clearly visible on the amplitude image obtained by GPA [Fig.5(b)]: these dislocations coming from the large misfit between the ferrite layer and the substrate are regularly-spaced and confirm the relaxed state, in good agreement with our previous RHEED and XRD characterizations. No epitaxial strain will therefore modify the magnetic properties of the films.
Finally, Fig. 4(b) evidences the presence of one of the most common defects known to appear in epitaxial ferrite thin films: the antiphase boundaries (APBs). These APBs have been observed on all HRTEM micrographs recorded on this sample indicating a huge density of these defects.
FIG. 5. (Color online) (a) Strain map along the growth direc-tion calculated from the HRTEM image using the GPA method. (b) Amplitude image with regularly spaced constrasts (some of them are indicated by arrows) corresponding to the misfit dislocations.
EPITAXIAL GROWTH AND FERRIMAGNETIC BEHAVIOR . . . PHYSICAL REVIEW B 83, 184402 (2011) APBs are stacking defects of the atomic planes in the
spinel lattice corresponding to a half-lattice translation of the cationic sublattice, whereas the oxygen sublattice remains unchanged. In the case of Fe3O4, these APBs have been widely studied due to their important effect on the magnetic17,27and magnetotransport28–30 properties of this material. In the case of MnFe2O4, much less is known. Nevertheless, it is clear that APBs are an important factor to keep in mind when interpreting future magnetic (Sec. III C) and spin-polarized transport measurements.
B. Electrical properties
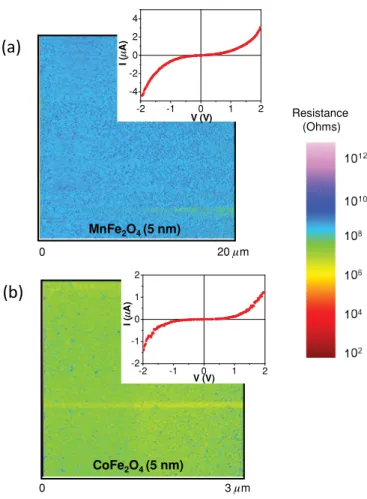
To be used as tunnel barriers, our MnFe2O4 ultrathin films have to exhibit insulating properties. Thus, we have measured their electrical properties using a CT-AFM. As CoFe2O4tunnel barriers have shown spin-filtering capabilities at room temperature, we have used a CoFe2O4(5 nm) film as a reference to compare with our MnFe2O4 ultrathin films. Figure 6 shows a typical resistance mapping of a 3 μm × 3 μm region on an α-Al2O3/Pt(20 nm)/CoFe2O4 (5 nm) reference, with an average resistance (Ravg) of log Ravg= 7.2± 0.2. MnFe2O4 films have been characterized and a typical resistance mapping of a 20 μm × 20 μm region
3 µm 0 0 20 µm -2 -1 0 1 2 -4 -2 0 2 4 I ( µ A) V (V) -2 -1 0 1 2 -2 -1 0 1 2 I ( µ A) V (V) Resistance (Ohms) MnFe2O4 (5 nm) CoFe2O4 (5 nm)
FIG. 6. (Color online) (a) Resistance surface map (20 μm × 20 μm) for an α-Al2O3/Pt (20 nm)/MnFe2O4(5 nm) layer, showing
its highly insulating and homogeneous properties. (b) Resistance sur-face map (3 μm× 3 μm) for an α-Al2O3/Pt (20 nm)/CoFe2O4(5 nm)
reference layer. (Insets) I-V curves measured for both layers.
on an α-Al2O3/Pt (20 nm)/MnFe2O4 (5 nm) reference is shown in Fig. 6. Our MnFe2O4 ultrathin films are highly homogeneous, without hot spots or pin holes on 20× 20 μm2 surfaces. They are insulating with an average resis-tance (Ravg) 4 orders of magnitude higher than that for the Pt buffer [log Ravg= 8.2 ± 0.2 for the MnFe2O4 (5 nm) film]. So the resistivity of MnFe2O4 ultrathin films is even higher than that for CoFe2O4 tunnel barriers (Fig.6). Furthermore, I-V curves have been measured (insets of Fig.6) and present a nonlinear shape, which is characteristic of the expected tunneling behavior. Consequently, MnFe2O4 ultrathin films show adequate properties to be used as tunnel barriers and to allow electrons tunneling through micrometer-scale magnetic tunnel junctions.
C. Magnetic properties and cationic distribution The magnetism in MnFe2O4 thin films for thicknesses varying from 50 nm to thicknesses appropriate for tunnel barriers (2–5 nm) was studied by VSM. In all magnetic hysteresis loops presented here, the diamagnetic contribution from the substrate was subtracted. Both in-plane and out-of-plane measurements were performed confirming a magnetic easy axis in the plane of the films, as expected due to shape anisotropy. Within the in-plane measurements, we also checked for any planar angular anisotropy, which proved to be insignificant (not shown here). This agrees with the lack of angular dependence found in Fe3O4 epitaxial films with a (111) orientation.17
The in-plane magnetic hysteresis loops of typical 50-, 15-, and 5-nm MnFe2O4 layers obtained at room temperature are shown in Fig.7(a). The 50-nm film hysteresis loop exhibits a net magnetization of 280 kA/m or a magnetic moment (μ) of 2.3 μBper formula unit (f.u.) at high field, a coercive field
(Hc) of 145 Oe, and a remanent magnetization of 76%. When
decreasing the thickness from 50 to 5 nm, one observes a decrease of both magnetization at high field and remanence which is typical of ferrite thin films. The 5 nm ultrathin films still clearly show an open hysteresis loop with a net magnetization of 200 kA/m (μ= 1.7 μB/f.u.) at high field and
10% of remanence. The coercivity Hc= 60 Oe is also smaller
than the one observed in the thick layers. This observation is consistent with the natural increased presence of antiphase boundaries in the thinner films (which have been observed in our MnFe2O4 films by TEM), as these structural defects are known to be in part responsible for the decreased coercivity in ferrite thin films.17,18 MnFe
2O4 ultrathin films were also grown on top of an epitaxial Pt(111) buffer layer deposited on the sapphire substrate. In this case [shown in Fig.7(b)], the 5-nm-thick films have typically a coercivity around 170 Oe with a magnetization of 350 kA/m (μ= 3 μB/f.u.) and a
remanence of 25%, much greater than that of equivalent films grown without a Pt buffer layer. We note that all of the samples that we compared were aligned identically with respect to the applied magnetic field in order to exclude deceiving geometry effects on the measured magnetic signal. The effect of the Pt buffer has been observed repeatedly and is likely tied to the quicker spinel phase formation and higher intensity RHEED patterns observed during the growth of these films. The reduction of certain defects such as misfit dislocations 184402-5
-4500 -3000 -1500 0 1500 3000 4500 -1,0 -0,5 0,0 0,5 1,0 T= 300 K M/ M( 2 T e s la ) μμμμ0H (Oe) t = 50 nm t = 15 nm t = 5 nm (a) -4500 -3000 -1500 0 1500 3000 4500 -400 -200 0 200 400 t= 5 nm with Pt buffer without Pt buffer M( k A /m ) µ0H (Oe) T = 300K (b) -4500 -3000 -1500 0 1500 3000 4500 -400 -200 0 200 400 -4000 -2000 0 2000 4000 -400 -200 0 200 400 t = 5 nm M( k A /m ) μμμμ0H (Oe) T = 300 K T = 10 K T = 300 K T = 10 K t = 2 nm (c)
FIG. 7. (Color online) (a) In-plane magnetic hysteresis loops for α-Al2O3/MnFe2O4(111) thin films (50, 15, and 5 nm) at
T= 300 K. (b) In-plane magnetic hysteresis loops for an α-Al2O3/MnFe2O4(111) (5 nm) thin film and an α-Al2O3/Pt(20
nm)/MnF2O4(111) (5 nm) thin film at T= 300 K. (c) In-plane
magnetic hysteresis loops for an α-Al2O3/Pt(20 nm)/MnFe2O4(111)
(5 nm) (2 nm, in inset) thin film at T= 300 K and 10 K.
and APBs in the Pt-based layers may very well improve the magnetic order in the MnFe2O4films, leading to the improved coercivity and magnetic moment. By using the Pt buffer, the thickness of the films can be reduced until 2 nm, while keeping
an open hysteresis loop (Hc= 20 Oe at 300 K) [inset of
Fig.7(c)].
In-plane hysteresis loops of typical 5- and 2-nm-thick MnFe2O4(111) films grown on Pt(111) have also been studied at room and low temperatures [Fig. 7(c)]. One can verify that the low-temperature magnetization curves do not present any unpleasant surprises with respect to the room-temperature characterization. These magnetization loops indicate that the coercivity and remanence are somewhat affected by the drop in temperature, increasing to 550 Oe and 40%, respectively, in comparison to the 170 Oe and 25% values obtained at room temperature for a 5-nm-thick MnFe2O4(111) film. The increase in remanence is obviously beneficial for future tunneling experiments. The increase in coercivity is related to the anisotropy constant increase while decreasing temperature. In conclusion, these measurements clearly show that our MnFe2O4films still conserve a very good magnetic character at room temperature when the thickness is reduced to a tunnel barrier thickness.
The most important chemical information, missing from the
in situ XPS experiments, is the interstitial site distribution of
Mn and Fe cations. The site distribution is a particularly crucial point to consider in the case of future MnFe2O4 spin-filter tunnel barriers because electronic band structure calculations predict that the band gap and the exchange splitting in the conduction band change significantly when passing from the inverse to the normal spinel structure,15 that is, when the Mn2+ cations go from octahedral to tetrahedral sites. Each of these parameters is a determinant factor for the spin-filter characteristics of this material.
In order to access the cationic sites’ distribution in our MnFe2O4 ultrathin films, we performed XAS and XMCD experiments at the ESRF synchrotron light source. XAS31,32 and XMCD33,34 are indeed powerful experimental tools for studying the valence and magnetic moment per atom of transition metal ions in solids and their distribution between octahedral and tetrahedral sites.
XMCD studies have been previously reported for polycrys-talline MnFe2O4 powders35 and nanocrystalline thick films of MnxFe3−xO4(150-nm sputtered films36 and 100-nm films
obtained by pulsed laser deposition24). Our experiments are thus the first ones on epitaxial MnFe2O4 ultrathin films. We present here an analysis of the Fe L2,3 and Mn L2,3spectra, allowing us to identify the valence states of Mn and Fe ions and their interstitial site placement. These XAS and XMCD experiments have been performed on five ultrathin layers and have shown similar spectra.
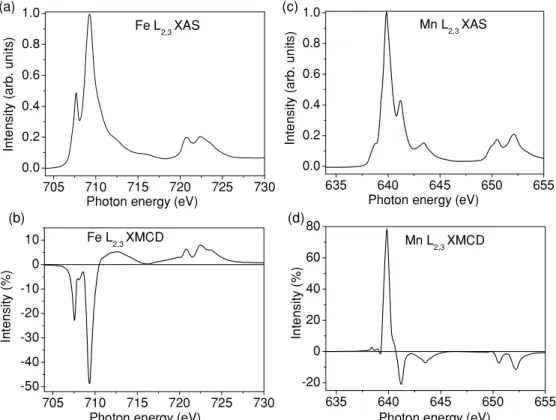
Figure8shows the Fe and Mn L2,3edges’ XAS and XMCD spectra obtained for a MnFe2O4 (5 nm) film deposited on
α-Al2O3with a Pt(111) buffer layer. The spectra were recorded in the total electron yield mode, which has a probing depth of around 5 nm, allowing us to probe the main part of the MnFe2O4 layer. These spectra show the multiplet structure, typical of the ionic nature of iron and manganese. Fe and Mn XMCD spectra [Figs.8(b)and8(d)] are mostly of opposite sign, suggesting that the magnetic moments of Fe and Mn have an antiparallel orientation. In the spinel structure, there is a ferrimagnetic order with an antiparallel alignment between magnetic moments in tetrahedral (Td) and octahedral (Oh)
EPITAXIAL GROWTH AND FERRIMAGNETIC BEHAVIOR . . . PHYSICAL REVIEW B 83, 184402 (2011) 705 710 715 720 725 730 0.0 0.2 0.4 0.6 0.8 1.0 Fe L2,3XAS
Photon energy (eV)
In tensit y (ar b. u n it s ) 705 710 715 720 725 730 -50 -40 -30 -20 -10 0 10 Fe L2,3XMCD In te nsi ty (% )
Photon energy (eV)
635 640 645 650 655 0.0 0.2 0.4 0.6 0.8 1.0
Photon energy (eV) Mn L2,3XAS Inte ns ity (a rb . un its ) 635 640 645 650 655 -20 0 20 40 60 80 In te ns it y (% )
Photon energy (eV)
Mn L2,3XMCD
(a) (c)
(b) (d)
FIG. 8. Fe and Mn L2,3edges’ XAS and XMCD spectra obtained for a MnFe2O4(5 nm) film deposited on α-Al2O3with a Pt(111) buffer
layer (T= 300 K, H = ±5 T).
with a ferrimagnetic order in our MnFe2O4films. It shows that the Mn (respectively Fe) atoms occupy mostly the tetrahedral (respectively octahedral) sites, which seems coherent with a normal-type spinel structure.
XAS and XMCD spectra of transition-metal oxides often show the multiplet structures, and their line shapes are strongly dependent on the occupied 3d electron configurations, the crystal field, the spin-orbit and electron-electron interactions within the transition metal atom, and the hybridization of 3d electrons to other valence electrons. Taking into account these facts, each specific contribution of Mn and Fe (for a given valence and site position) can be calculated using a crystal field atomic multiplets approach, and then the overall XAS and XMCD spectra can be obtained for a chosen cationic distribution of different species. Here the calculated spectra have been obtained by employing the ligand-field multiplet (LFM) model37by including the spin-orbit interaction between 3d electrons with the magnetic field along the (111) direction of the spinel structure.
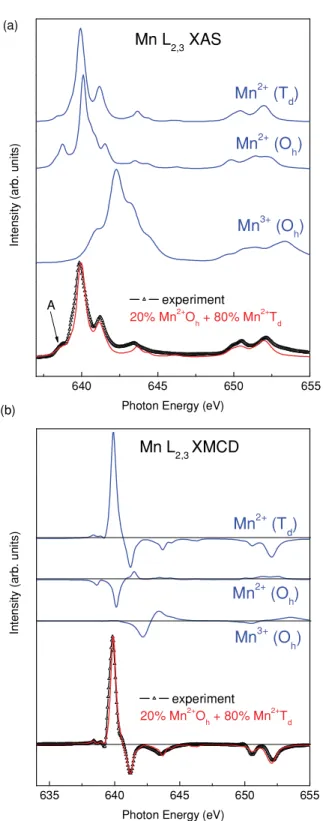
In Fig. 9(a), we have compared the measured Mn L2,3 edges’ XAS spectrum of MnFe2O4to the calculated Mn L2,3 edges’ XAS spectra, obtained from the LFM calculations using the following crystal field splitting parameter values (10 Dq). The three calculated XAS spectra (blue lines) represent those for Mn2+ (3d5) under O
hwith 10 Dq= 1.2 eV, Mn2+ (3d5)
under Td with 10 Dq = 0.5 eV, and Mn3+ (3d4) under Oh
with 10 Dq= 1.2 eV. This comparison reveals clearly that Mn ions in MnFe2O4 are nearly divalent and occupy essentially tetrahedral sites. The best fit is obtained (particularly for the “A” feature) for a weighted sum of [20% Mn2+(Oh)+ 80%
Mn2+(Td)] (red line). In Fig.9(b), we have also compared the
measured Mn L2,3edges’ XMCD spectra of MnFe2O4to the calculated ones. The Mn L2,3XMCD spectrum of MnFe2O4 is also qualitatively similar to that of Mn2+(Td), and we can
see a good correspondence between the measurement and the calculation (red line). The spinel structure of MnFe2O4 can be described by the formula [Mn1−yFey]Td[Fe2−yMny]OhO4,
where y is called the inversion parameter. The inversion parameter is known to vary from 0 to 0.2 for bulk MnFe2O4, among which 0.2 is the most usual, but the cation distribution was found to be sensitive to the processing oxygen pressure and the preparation technique,38and a higher inversion parameter can be obtained in thin films. Thus, concerning the Mn ions, our MnFe2O4 thin films contain mainly Mn2+ cations in tetrahedral sites, with an estimated inversion parameter (y= 0.2) corresponding to the reported bulk value. Furthermore we can notice that the XAS and XMCD spectra for Mn3+ are at higher energies compared with the ones for the 2+ valence. So we can exclude the presence of manganese 3+ in our films, which was questioned by our XPS measurements.
In Fig.10(a), we have compared the measured Fe L2,3 edges’ XAS spectrum of MnFe2O4to the calculated Fe L2,3 XAS spectra. The three calculated XAS spectra (blue lines) represent those for Fe3+(3d5) under O
hwith 10 Dq= 1.5 eV,
Fe3+(3d5) under Tdwith 10 Dq= 0.7 eV, and Fe2+(3d6) under
Oh with 10 Dq= 1.4 eV39. By comparing the experimental
XAS data with calculated spectra, we immediately see a close resemblance with the Fe3+ (Oh) XAS line shape, indicating
that the valence state of Fe ions in MnFe2O4 is mainly trivalent. In Fig.10(b), we have compared the measured Fe 184402-7
(a) 635 640 645 650 655 experiment
Mn
3+(O
h)
Mn L
2,3XMCD
20% Mn2+Oh+ 80% Mn2+TdMn
2+(O
h)
Mn
2+(T
d)
In te nsi ty (a rb . un its)Photon Energy (eV) (b) 640 645 650 655 experiment
Mn
3+(O
h)
20% Mn2+Oh+ 80% Mn2+TdMn
2+(O
h)
In ten s ity (ar b. u n it s)Photon Energy (eV)
Mn
2+(T
d)
A
Mn L
2,3XAS
FIG. 9. (Color online) Comparison of the Mn L2,3edges’ XAS
(a) and XMCD (b) of MnFe2O4 (5 nm) to the calculated Mn L2,3
edges’ XAS (a) and XMCD (b) for Mn2+(T
d), Mn2+(Oh), and Mn3+
(Oh) (blue lines) and their weighted sum (red line) (T= 300 K, H =
±5 T).
L2,3XMCD spectrum of MnFe2O4 to the calculated Fe L2,3 XMCD spectra. The Fe L2,3XMCD spectrum of MnFe2O4is also qualitatively similar to that of Fe3+(Oh), but the difference
in the feature “B” seems to indicate that Fe ions in MnFe2O4 occupy not only Oh sites but also Td sites. First, we have
compared the measured Fe XAS and XMCD spectra to the
705 710 715 720 725 730 experiment 21% Fe3+T d+ 72% Fe 3+ O h+ 7% Fe 2+ O h experiment 10% Fe3+Td+ 90% Fe3+Oh Fe2+(Oh) Fe3+(T d) Fe3+(Oh)
Photon energy (eV)
Fe L2,3XMCD In tens it y (ar b. un it s ) A B C (b) 705 710 715 720 725 730 experiment 21% Fe3+Td+ 72% Fe3+Oh+ 7% Fe2+Oh experiment 10% Fe3+Td+ 90% Fe3+Oh Fe2+(Oh) Fe3+(Td) In te n s it y (ar b. un it s )
Photon energy (eV)
Fe3+(Oh)
Fe L
2,3XAS
(a)
FIG. 10. (Color online) Comparison of the Fe L2,3edges’ XAS
(a) and XMCD (b) of MnFe2O4(5 nm) to the calculated Fe L2,3edges’
XAS (a) and XMCD (b) for Fe3+(Oh), Fe3+(Td), and Fe2+(Oh) (blue
lines) and their weighted sum (red and orange lines) (T= 300 K, H= ±5 T).
calculated spectra obtained for a weighted sum of [10% Fe3+ (Td)+ 90% Fe3+(Oh)] (red lines), giving an inversion
param-eter of 0.2 for Fe ions. A reasonably good agreement is found between experiment and calculation, and is comparable to previous results for MnFe2O4 powders35 and nanocrystalline thick films.36 We can further improve the agreement with the experimental data by introducing more tetrahedral Fe3+and a
EPITAXIAL GROWTH AND FERRIMAGNETIC BEHAVIOR . . . PHYSICAL REVIEW B 83, 184402 (2011) small fraction of divalent Fe ions to get the right ratio between
peaks A, B, and C. The orange curve in Fig.10(b)represents the weighted sum of 21% Fe3+(Td)+ 72% Fe3+(Oh)+ 7%
Fe2+ (Oh), describing the best fit with the measured Fe L2,3 XMCD spectrum. The XAS spectrum is also calculated for this weighted sum and compared to the Fe L2,3XAS spectrum in Fig. 10(a) (orange line). At this point, we can say that our MnFe2O4thin films contain mainly Fe3+cations, with an inversion parameter probably higher than 0.2 (y= 0.42) for the Fe ions’ distribution. Concerning the Mn ions’ distribution, we have also noticed that the calculated spectra do not change significantly for an inversion parameter of 0.4. Consequently, from the quality of fitting, our MnFe2O4ultrathin films can be described by mainly Fe3+cations, with an inversion parameter probably higher than 0.2, and by Mn2+ cations distributed either with the same inversion parameter or with the 0.2 bulk value (suggesting that some octahedral sites should be unoccupied). Thus, our MnFe2O4 ultrathin films have a slightly higher inversion than usual reported spinel structures of MnFe2O4powders (inversion of 20%).35This could be due to the high density of APBs which modify the cationic stacking and thus the cationic environment in ultrathin films.
To conclude, these XAS and XMCD measurements have revealed the rather normal spinel structure of our MnFe2O4 ultrathin films. This structure will be further very beneficial for spin-filtering efficiency since the normal structure is predicted to show a higher spin decomposed exchange splitting of the conduction bands (3.85 eV) than for the inverse structure (1.31 eV).15 This important determination of the cationic site distribution will be extremely valuable for future interpretation of the spin-filter characteristics of our MnFe2O4 tunnel barriers.
IV. CONCLUSION
In this paper, we have reported on the epitaxial growth of ultrathin manganese ferrite films (2–5 nm in thickness), using oxygen-assisted MBE. A two-dimensional and single phase growth mode has been successfully optimized to get the desired spinel structure of MnFe2O4(111) without any parasitic phase and with a very low surface roughness. Our RHEED, XRD, and HRTEM measurements have clearly revealed the excellent structural quality of our manganese ferrite ultrathin films, and their composition has been controlled by in situ XPS to get the correct stoichiometry and oxidation states. The films have then been characterized electrically and show adequate properties (highly insulating behavior without pin holes on large surfaces) to be used as tunnel barriers. Finally, thanks to an in-depth magnetic study, we have proved that MnFe2O4 films keep a ferrimagnetic behavior until tunnel barrier thicknesses at room temperature. XAS and XMCD experiments have also allowed us to access the cationic sites’ distribution in manganese ferrite ultrathin films, which contain mainly Fe3+and Mn2+cations, distributed predominantly as in a normal spinel structure. This structure is predicted to exhibit good spin-filter characteristics and thus the epitaxial MnFe2O4 ultrathin films are very promising to be used as ferrimagnetic tunnel barriers operating at room temperature. We are presently integrating these spinel oxides in MnFe2O4-based spin-filter tunnel junctions in order to conduct spin-polarized transport measurements.
ACKNOWLEDGMENTS
This work has been supported by the C’nano IdF and the RTRA-Triangle de la Physique under grants FILASPIN and MicMMaC, respectively.
1J. S Moodera, T. S Santos, and T. Nagahama,J. Phys. Condens.
Matter 19, 165202 (2007).
2J. S Moodera, R. Meservey, and X. Hao,Phys. Rev. Lett. 70, 853
(1993).
3J. S Moodera, X. Hao, G. A Gibson, and R. Meservey,Phys. Rev.
Lett. 61, 637 (1988).
4T. S Santos and J. S Moodera,Phys. Rev. B 69, 241203 (2004). 5M. Gajek, M. Bibes, A. Barth´el´emy, K. Bouzehouane, S. Fusil,
M. Varela, J. Fontcuberta, and A. Fert,Phys. Rev. B 72, 020406 (2005).
6U. Luders, M. Bibes, K. Bouzehouane, E. Jacquet, J.-P. Contour, S.
Fusil, J. Fontcuberta, A. Barth´el´emy, and A. Fert,Appl. Phys. Lett. 88, 082505 (2006).
7M. G. Chapline and S. X. Wang,Phys. Rev. B 74, 014418 (2006). 8A. V. Ramos, M.-J. Guittet, J.-B. Moussy, R. Mattana, C. Deranlot,
F. Petroff, and C. Gatel,Appl. Phys. Lett. 91, 122107 (2007).
9A. V. Ramos, T. S Santos, G. X. Miao, M.-J. Guittet, J.-B. Moussy,
and J. S Moodera,Phys. Rev. B. 78, 180402(R) (2008).
10Y. K. Takahashi, S. Kasai, T. Furubayashi, S. Mitani, K. Inomata,
and K. Hono,Appl. Phys. Lett. 96, 072512 (2010).
11X. Zuo, A. Yang, S. D. Yoon, J. A. Christodoulides, V. G. Harris,
and C. Vittoria,Appl. Phys. Lett. 87, 152505 (2005).
12A. Yang, Z. Chen, A. L. Geiler, X. Zuo, D. Haskel, E. Kravtsov,
C. Vittoria, and V. G. Harris,Appl. Phys. Lett. 93, 052504 (2008).
13M. Ishikawa, H. Tanaka, and T. Kawai,Appl. Phys. Lett. 86, 222504
(2005).
14J. M. Hastings and L. M Corliss,Phys. Rev. 104, 328 (1956). 15Z. Szotek, W. M. Temmerman, D. Kodderitzsch, A. Svane, L. Petit,
and H. Winter,Phys. Rev. B 74, 174431 (2006).
16J. Smith and H. P. J. Wijn, Ferrites (Wiley, New York, 1959),
Chap. VIII, p. 163.
17J.-B. Moussy, S. Gota, A., Bataille, M.-J. Guittet, M. Gautier-Soyer,
F. Delille, B. Dieny, F. Ott, T. D. Doan et al.,Phys. Rev. B 70, 174448 (2004).
18A. V. Ramos, J.-B. Moussy, M.-J. Guittet, M. Gautier-Soyer,
C. Gatel, P. Bayle-Guillemaud, B. Warot-Fonrose, and E. Snoeck, Phys. Rev. B 75, 224421 (2007).
19F. Houz´e, R. Meyer, O. Schneegans, and L. Boyer,Appl. Phys. Lett.
69, 1975 (1996).
20Y. Suzuki, R. B. van Dover, E. M. Gyorgy, J. M. Phillips,
V. Korenivski, D. J. Werder, C. H. Chen, R. J. Cava, J. J. Krajewski, W. F. Peck, and K. B. Do,Appl. Phys. Lett. 68, 714 (1996).
21S. Gota, E. Guiot, M. Henriot, and M. Gautier-Soyer,Phys. Rev. B
60, 14387 (1999).
22J. Gao, S. Y. Dai, and T. K. Li, Phys. Rev. B 67, 153403
(2003).
23E. Beyreuther, S. Grafstr¨om, L. M. Eng, C. Thiele, and K. D¨orr,
Phys. Rev. B 73, 155425 (2006).
24J. Takaobushi, M. Ishikawa, S. Ueda, E. Ikenaga, J. J. Kim,
M. Kobata, Y. Takeda, Y. Saitoh, M. Yabashi, Y. Nishino, D. Miwa, K. Tamasaku, T. Ishikawa, I. Satoh, H. Tanaka, K. Kobayashi, and T. Kawai,Phys. Rev. B 76, 205108 (2007).
25K. J. Kim, H. J. Lee, and J. Y. Park,J. Magn. Magn. Mater. 321,
3706 (2009).
26M. J. H¨ytch, E. Snoeck, and R. Kilaas,Ultramicroscopy 74, 131
(1998).
27D. T. Margulies, F. T. Parker, M. L. Rudee, F. E. Spada, J. N.
Chapman, P. R. Aitchison, and A. E. Berkowitz,Phys. Rev. Lett. 79, 5162 (1997).
28M. Ziese and H. J. Blythe,J. Phys. Condens. Matter 12, 13 (2000). 29W. Eerenstein, T. T. M. Palstra, S. S. Saxena, and T. Hibma,Phys.
Rev. Lett. 88, 247204 (2002).
30A. V. Ramos, J. B. Moussy, M. J. Guittet, A. M. Bataille, M.
Gautier-Soyer, M. Viret, C. Gatel, P. Bayle-Guillemaud, and E. Snoeck,J. Appl. Phys. 100, 103902 (2006).
31F. M. F. de Groot, J. C. Fuggle, B. T. Thole, and G. A. Sawatzky,
Phys. Rev. B 42, 5459 (1990).
32S. C. Wi, J.-S. Kang, J. H. Kim, S.-B. Cho, B. J. Kim, S. Yoon, B.
J. Suh, S. W. Han, K. H. Kim, K. J. Kim, B. S. Kim, H. J. Song,
H. J. Shin, J. H. Shim, and B. I. Min,Appl. Phys. Lett. 84, 4233 (2004).
33B. T. Thole, P. Carra, F. Sette, and G. van der Laan,Phys. Rev. Lett.
68, 1943 (1992).
34C. T. Chen, Y. U. Idzerda, H.-J. Lin, N. V. Smith, G. Meigs,
E. Chaban, G. H. Ho, E. Pellegrin, and F. Sette,Phys. Rev. Lett. 75, 152 (1995).
35J.-S. Kang, G. Kim, H. J. Lee, D. H. Kim, H. S. Kim, J. H. Shim,
S. Lee, H. G. Lee, J.-Y. Kim, B. H. Kim, and B. I. Min,Phys. Rev. B 77, 035121 (2008).
36L. Stichauer, A. Mirone, S. Turchini, T. Prosperi, S. Zennaro,
N. Zema, F. Lama, R. Pontin, Z. Simsa, Ph. Tailhades, and C. Bonningue,J. Appl. Phys. 90, 2511 (2001).
37B. T. Thole, G. van der Laan, J. C. Fuggle, G. A. Sawatzky,
R. C. Karnatak, and J. M. Esteva, Phys. Rev. B 32, 5107 (1985).
38A. Yang, X. Zuo, C. Vittoria, and V. H. Harris,IEEE Trans. Magn.
42, 2870 (2006).
39C. Carvallo, Ph. Sainctavit, M.-A. Arrio, N. Menguy, Y. Wang,
G. O.-Nguema, and S. Brice-Profeta, Am. Mineral. 93, 880885 (2008)
![FIG. 4. Cross-sectional TEM images of a MnFe 2 O 4 (5 nm) film viewed along the [112] zone axis](https://thumb-eu.123doks.com/thumbv2/123doknet/13706875.434038/5.911.507.798.625.1054/fig-cross-sectional-tem-images-mnfe-film-viewed.webp)