HAL Id: hal-01258296
https://hal.archives-ouvertes.fr/hal-01258296
Submitted on 18 Jan 2016
HAL is a multi-disciplinary open access
archive for the deposit and dissemination of
sci-entific research documents, whether they are
pub-lished or not. The documents may come from
teaching and research institutions in France or
abroad, or from public or private research centers.
L’archive ouverte pluridisciplinaire HAL, est
destinée au dépôt et à la diffusion de documents
scientifiques de niveau recherche, publiés ou non,
émanant des établissements d’enseignement et de
recherche français ou étrangers, des laboratoires
publics ou privés.
GEOTHERMAL EXPLORATION IN MARTINIQUE
BASED ON MAGNETO-TELLURIC AND
CONTROLLED-SOURCE EM SURVEY
Jean-François Girard, Nicolas Coppo, Pierre Wawrzyniak, François
Bretaudeau, Alain Gadalia
To cite this version:
Jean-François Girard, Nicolas Coppo, Pierre Wawrzyniak, François Bretaudeau, Alain Gadalia.
GEOTHERMAL EXPLORATION IN MARTINIQUE BASED ON MAGNETO-TELLURIC AND
CONTROLLED-SOURCE EM SURVEY. EGW 2015, European Geothermal Workshop in
Stras-bourg, Oct 2015, StrasStras-bourg, France. �hal-01258296�
GEOTHERMAL EXPLORATION IN MARTINIQUE BASED ON MAGNETO-TELLURIC AND CONTROLLED-SOURCE EM SURVEY
Jean-François Girard1, Nicolas Coppo2, Pierre Wawrzyniak2, François Bretaudeau2, Alain Gadalia2
1Institut de Physique de Globe de Strasbourg (UMR 7516 CNRS, Université de Strasbourg/EOST), Strasbourg, France. 2Bureau de Recherches Géologiques et Minières, 3 av. Claude Guillemin, BP 36009, 45060 Orléans Cedex 2, France., [email protected], [email protected], [email protected], [email protected]
Contact: [email protected] (formerly at brgm)
ABSTRACT
Resistivity imaging is a key input in many geothermal exploration programs, and particularly in volcanic environment. It is assumed that resistivity variations allow imaging the caprock, but also hydrothermal weathering and preferential geothermal fluid flow. The latter is generally a brine which drastically decreases the electrical resistivity and the temperature increase also lowers resistivity. Several authors have described resistivity signatures for some geothermal reservoirs context.
Magnetotelluric (MT) is generally used to image resistivity variations down to a relevant investigation depth of several kilometers. Within the framework of a global French program oriented towards the development of geothermal energy, Martinique Island (Lesser Antilles, France) has been extensively investigated (from 2012 to 2013) through an integrated multi-method approach, with the aim to define precisely the potential geothermal structures previously highlighted. Amongst the common investigation methods deployed, we carried out three magnetotelluric (MT) surveys located above three out of the most promising geothermal areas of Martinique, namely the Anses d’Arlet (focus of this presentation), the Montagne Pelée and the Pitons du Carbet prospects.
Based on natural source signal, the quality of broad band MT data depends on the source activity (lightning strikes and sun) during the survey but also on the local noise conditions. In many cases, because industrial activities have been developed close to the geothermal resource, the noise conditions make it difficult to obtain reliable MT tensors and therefore a good resistivity distribution. A common way to improve the data quality is to record longer time series and to apply robust processing with remote reference including noise filtering.
The noise issue in MT prospection is even more drastic in an Island context. Then, we investigated the substitution of controlled-source EM instead of MT measurements close to urbanized area. The distance constraints to respect the far-field conditions are so challenging that they are often logistically not possible. Indeed, when it is possible to measure the receiver stations far enough from the source, the distortion due to the controlled-source disappear. But when the conditions required for standard CSAMT processing are not fulfilled, it is necessary to consider the source effect to interpret properly the EM response.
We have studied and performed EM imaging in the near field, using a pair of pre-existing boreholes to inject high current into the ground through metallic casings. Based on numerical modeling, we proposed a methodology to obtain maps and section of apparent resistivity. This measuring protocol was applied to prospect the Lamentin area, close to Fort-de-France, the main city of Martinique, in the same exploration program in 2013. The results obtained were confronted to previous geophysical campaign results performed in the 1980’s and recent heli-borne prospection.
INTRODUCTION
The Lesser Antilles island arc, which results from the westward subduction of the Atlantic Plate under the Caribbean Plate, has been active since the Early Eocene (Nagle et al., 1976). Arc evolution has been described as occurring in three stages, representing the old, intermediate and recent arcs, corresponding to Late Oligocene-Early Miocene, Middle Miocene and Late Miocene to recent ages, respectively (Briden et al., 1979; Westercamp, 1979), and having erupted from east to west. Due to the geological evolution of this subduction zone, Martinique is the northernmost island where the products of the three stages crop out from east to west without superimposition.
The geothermal potential of Martinique Island (Lesser Antilles, France) has been extensively investigated for more than 50 years. The first exploration started in the 60’ in the Plaine du Lamentin (south of Fort-de-France) and has been extended in this area in the 80’s and orientated towards the southeastern flank of the Montagne Pelée. Then, the southwestern flank of the Montagne Pelée and the Anses d’Arlet) were identified of potential interest and explored in the 2000’s. Finally, three exploration wells were drilled in the Plaine du Lamentin in 2001 and confirmed the presence of a medium temperature geothermal resource (Sanjuan et al., 2002).
This project had as main objectives to first compile existing knowledge about the geothermal potential of Martinique Island, but also to proceed to adequate additional field exploration with the aim to complete and strengthen the existing geoscientific database and finally provide an up-to-date interpretation for the four selected areas (Anses d’Arlet, Montagne Pelée, Pitons du Carbet and Lamentin) with proposition of the most favorable zones for exploration wells. New geological (exploration of mineralogical clues related to magmatic and hydrothermal activity and structural context), hydrogeological (geochemistry
and recharge assessment), geochemical (soil and water gas analysis) and geophysical data were acquired on these four sectors.
Beyond crucial geological, geochemical and hydrogeological data, geothermal exploration requires additional images of the physical properties of subsurface to understand and interpret properly the reservoir structures and potentialities. This information can only be provided by adapted geophysical measurements above areas of interest. Because the amount of data collected during this two-years project is too important to be rigorously presented and described in a single communication, this presentation mainly focuses on the geophysical results (new magnetotelluric and CSEM data, collected over the Anses d’Arlet and the Lamentin areas).
MAGNETOTELLURIC METHOD
Different rocks, sediments, geological structures and fluids have a wide range of different electrical conductivities. Therefore, measuring electrical resistivity allows different materials and structures and fluids to be distinguished - sometimes identified - from one another and can improve knowledge about type of fluid content and its distribution, clay content, tectonic and geological structures.
The magnetotelluric method is a passive geophysical technique for imaging the electrical conductivity and structure of the Earth from the near surface down to several tens of kilometers (Vozoff, 1991). Its principle consists in simultaneous measurements and recordings of natural (internal) variations of electric and magnetic fields at the earth surface whose strength and geometry are governed by the sub-surface resistivity distribution. The primary external natural signal comes mainly from both the solar wind that induces pulsations in the magnetosphere and the lightning activity. They both cause natural variations in the Earth magnetic field, inducing electric currents flowing under the Earth surface. These naturally varying electromagnetic fields are measured over a wide range of magnetotelluric frequencies (from 10 kHz to 1000 s in our case). Low frequencies (< 1 Hz) are generated by the solar activity and highest (> 1 Hz) by worldwide thunderstorm activity. Combined, these natural phenomena create MT source signals over the entire frequency spectrum. Therefore, data quality is strongly dependent on external source activity and can be severely reduced - especially in the low frequency range – during phases of poor solar activity.
Magnetotelluric data comprises time series of the horizontal electric components (Ex and Ey measured in orthogonal directions) with their two associated magnetic components (Hx and Hy). When possible the vertical magnetic component (Hz) is also recorded. The ratio of the electric field to the magnetic field (E/H) at selected frequency, known as the “impedance tensor” embodies the full information about sub-surface conductivity structure. The ratio E/H is usually displayed as both apparent resistivity and phase as a function of frequency. Because of the “skin effect” phenomenon (explaining the attenuation of electromagnetic fields with depth), the depth of penetration of EM waves increases with lower frequency and higher resistivity. At most sites, collocated transient electromagnetic data were also acquired to correct the magnetotelluric data for the amplitude of galvanic distortion caused by small-scale, shallow conductors. A variety of techniques are available to assess the dimensionality of the causative structures from the impedance tensor, and, in the case of a two-dimensional (2D) Earth, determine the geoelectrical strike direction. In the present work, 3-D inversion has been directly applied to integrate tensors multi-dimensionality and sea-effect (Hautot et al., 2007).
CONTROLLED SOURCE ELECTROMAGNETISM
The Controlled Source Electro-Magnetism (CSEM) is a geophysical method based on the imagery of electrical resistivity. Unlike MT method, the signal source is not passive but generated by a transmitter. The first interest is that it is less sensitive to man-made electromagnetic noise due to powerlines, electrical plants, etc…which make EM passive methods such as MT difficult or almost impossible in noisy area. The duration for 6 to 8 frequencies, starting from 0.125 Hz to 1 kHz, is generally 1 hour. Depending on site conditions (current intensity, noise) these parameters should be adapted to obtain sufficient signal to noise ratio.
If the controlled source is far enough, several kilometers from the survey area for frequencies > 1 Hz, the far field approximation is fulfilled and the CSEM data can be processed as audio-MT data (controlled source audio-magnetotelluric) corresponding to the shallowest response of MT. Considering a targeted investigation depth of 2000 m or more, the far field assumption cannot be reached sometimes and especially in islands. Then, the controlled-source EM data should be processed with another protocol than in MT.
The depth of investigation is controlled both by the signal frequency and by geometry of the transmitter. Particularly, if instead of using surface current injection, metallic casing of boreholes are used to enhance the contact resistance but also inject current closer to the targeted depth. In this latter case, the geometry of the well and the length of the metallic casing should be considered to estimate the source effect and remove it. Using borehole metallic casing as a long electrode was already used, and for instance one could refer to Hatanaka et al. (2005) for a recent use for geothermal energy, but the advantages of this array was discussed by Bourgeois and Girard (2010) for monitoring CO2 injection in a limestone deep
aquifer.
Nowadays, we provide the results as apparent resistivity map and sections (corrected from frequency and geometrical factors, topic discussed in this paper). Note that, if it is possible to derive geometrical information from a single MT sounding (strike direction, dipping, etc…), a single CSEM station should be considered as a deep electrical sounding and does not provide geometrical information by it-self. When used along profiles or with a homogeneous density over a surface, the resistivity maps and sections provide geometrical information (Girard et al., 2015).
CSEM FIELD SURVEY IN THE LAMENTIN AREA
The Lamentin area is partly urbanized (including housing and shopping centers close to Fort-de-France) and is equipped with an international airport. The remaining zone is whether densely cultivated, whether in the mangrove swamp. Considering the high anthropic noise (powerlines and various installations) it was then proposed to investigate at depth using a Controlled-Source Electro-Magnetism approach (CSEM). The conditions for applying standard processing of CSAMT being not fulfilled, it was necessary to compute a specific normalization to correct the source effect. Indeed, when it is possible to measure the receiver stations far enough from the source, the distortion due to the controlled-source disappears. But the geography of the area of interest and the pre-existing exploration boreholes used to inject current at depth make it impossible in this case.
45 receiver stations were measured over a 10x10 km area during 6 days. 35 stations were measured on-shore, with electric dipoles and magnetic coils. 10 stations were measured off-shore, in shallow water (1 to 5 meters depth) in the Lamentin Bay. The frequency band was covered using 7 fundamental frequencies ranging from 0.125 up to 512 Hz with a factor 4 between two adjacent frequencies. The signal waveform was a square wave generating many harmonics allowing to double records. GPS positioning and time synchronization was used. Resistivity maps at single frequency were converted using the normalization described before. An estimation of the investigation depth is based on the skin depth ().
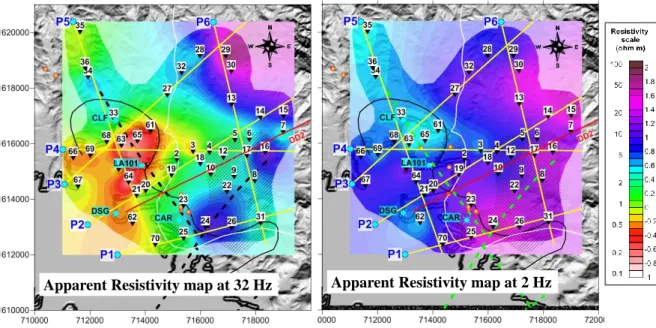
For frequencies higher than 4 Hz, the general pattern is quite similar (see Figure 1, left). It reveals a very conductive anomaly (< 3 Ohm.m in apparent resistivity) centered on the borehole LA101. This anomaly is clearly limited laterally and migrates in the NW direction with decreasing frequency. The general shape of this conductive zone is de-correlated from the coast line and the off-shore stations do not appear as outliers. The sea water intrusion being important in all the western part of the covered area, this continuity is in agreement with the known hydrogeological context.
A drastic change appears for frequencies equal or lower than 2 Hz (see Figure 1, right). Apparent resistivity appears then higher, contrasts are smoother and the boundary of the basement with less sea water intrusion is well correlated with existing boreholes and the few older geophysical surveys results. A less resistive trend appear going NNW but only 4 stations (33,34,35,36) along a straight profile was measured in this zone and it is not possible yet to speak about a channeling of deep brine coming from the northern topography associated to the volcanic system of the Carbets.
Apparent Resistivity map at 32 Hz
Apparent Resistivity map at 2 Hz
Apparent Resistivity map at 32 Hz
Apparent Resistivity map at 2 Hz
Figure 1: Left, apparent resistivity map (CSEM 2013), from the in-phase Electric field component, TX Frequency 32 Hz, (/2 = 141 m) and right TX frequency 2 Hz (/2 = 562 m), both normalization by MAMx2-400m, 5 .m, at corresponding frequency.
CONCLUSIONS
This paper deals with a part of the geophysical results collected during the last multi-disciplinary geothermal exploration phase of Martinique (2012-2013). We present a 3-D resistivity model obtained through 3-D MT inversion, including sea effect. We point out a potential geothermal resource characterized by local specific structures. Complementary geological and geochemical information is provided in references (Coppo et al., 2015, Gadalia et al., 2014). On the Anses d’Arlet sector, MT and gravity data reveal a massive dense and resistive body, running parallel to the Caribbean Sea and elongated in the NNW-SSE direction. It is interpreted as a deep intrusion related to volcanic activity that affected the area during the last Million years, and could act as heat source. A caprock structure is identified at shallow depth. Although many geological and geochemical elements seem to indicate that the geothermal system is currently becoming restricted, its southern boundary, which concentrates most of the surface hydrothermal manifestations is proposed to be the best place for further exploration wells.
Beside these interesting deep structures, we demonstrate, after analyzing the results of the recent heliborne TEM survey covering the whole Martinique, that surface resistivity distribution obtained from 3-D inversion reproduces faithfully the resistivity distribution observed by TEM. In spite of a very different sampling scale, this comparison illustrates the ability of 3-D MT inversion to take into account and reproduce static shift effects in the sub-surface resistivity distribution (Coppo et
al., 2014) .
A variant of on-shore CSEM method application using boreholes is presented. It proved to be logistically interesting and efficient to map resistivity in such anthropic area for geothermal exploration. Known limitation in the use of apparent resistivity is recalled and limits were calculated in the studied environment. Nevertheless, the way to overcome it is clear: 3D CSEM inversion. It is currently developed in our team and this case study will be especially interesting to apply it thanks to the a priori knowledge and local validation that exists from previous surveys and boreholes. Bridge between clay mineralogy (Mas et al., 2003) and electrical resistivity is also a subject of research currently under investigation.
ACKNOWLEDGEMENTS
The authors wish to thanks the FEDER and ADEME institutions, the Conseil Régional and the Syndicat Mixte d’Electricité de la Martinique (SMEM) for funding this project.
REFERENCES
Bourgeois B, Girard J-F. First modelling results of the EM response of a CO2 storage in the Paris basin. Oil & Gas Science and Technology - Rev. IFP 2010; 65(4): 597-614
Briden, J.C., Rex, D.C., Faller, A.M., Tomblin, J.-F.: K–Ar geochronology and palaeomagnetism of volcanic rocks in the Lesser Antilles island arc. Philosophical Transactions of the Royal Society of London. Series A, Mathematical and
Physical Sciences, 291, (1979), 485–528.
Coppo N., Hautot S and Tarits P. – Evidence of the magnetotelluric 3-D inversion ability to account for static shift effects: a comparison between MT and heliborne TEM. Extended abstract, 22nd EM Induction Workshop, Weimar, Germany,
August 24-30, 2014.
Coppo N., Baltassat J.-M., Bouchot V., Gadalia A. ., Girard J-F., Hautot S., Jacob T., Martelet, G., Mathieu F., Tarits P., Traineau H. and Wawrzyniak P. – 3-D Magnetotelluric Investigations in Martinique (Lesser Antilles). Characteristic Deep Resistivity Structures and Shallow Resistivity Distribution Matching Heliborne TEM results. – Proceedings World
Geothermal Congress 2015, Melbourne, Australia, 19-25 April 2015.
Gadalia, A., J.M. Baltassat, V. Bouchot, S. Caritg, N. Coppo, F. Gal, J.F. Girard, A. Gutierrez, T. Jacob, G. Martelet, S. Rad, A.L. Tailame, H. Traineau, B. Vittecoq, P. Wawrzyniak, C. Zammit : Compléments d’exploration géothermique en Martinique : conclusions et recommandations pour les zones de la Montagne Pelée, des Anses d’Arlet, des Pitons du Carbet et du Lamentin, 2014), http://infoterre.brgm.fr/rapports/RP-63019-FR.pdf.
Girard J-F., N. Coppo, P. Wawrzyniak, B. Bourgeois, J-M. Baltassat, A. Gadalia, 2015. Resistivity Imaging for Geothermal Exploration, using Controlled-Source EM where Magneto-Telluric is Not Applicable: Model and Field Study,
Proceedings World Geothermal Congress 2015 Melbourne, Australia, 19-25 April 2015.
Hatanaka H., Tetsuo A., Mizunaga H., Ushijima K. (2005) Threedimensional modelling and inversion of the Mise-à-la-Masse data using a steel-casing borehole, Proceedings of the World Geothermal Congress, Antalya, 24-29 April 2005. Hautot, S., R. Single, J. Watson, N. Harrop, D. A. Jerram, P. Tarits, and K. A. Whaler.: 3-D magnetotelluric inversion and
model validation with gravity data for the investigation of large igneous provinces, Geophysical Journal International,
170(3), (2007), 1418-1430.
Mas A., Patrier A., Beaufort D., Genter A., 2003, Clay-mineral signatures of fossil and active hydrothermal circultions in the geothermal system of the Lamentin Plain, Martinique, Journal of Volcanology and Geothermal Research, 124, pp. 195-218.
Nagle, F., Stipp, J.J., Fisher, D.E.: K–Ar geochronology of the Limestone Caribbees and Martinique, Lesser Antilles, West Indies, Earth and Planetary Science Letters, 29, (1976), 401–412.
Sanjuan B., Genter A., Correia H., Girard J.P., Roig J.Y., Brach M. (2002), Travaux scientifiques associés à la réalisation des trois puits d’exploration géothermique dans la plaine du Lamentin (Martinique).
http://infoterre.brgm.fr/rapports/RP-51671-FR.pdf .
Westercamp, D.: Diversité, contrôle structural et origines du volcanisme récent dans l'arc insulaire des Petites Antilles.
Bulletin du BRGM, deuxième série section IV (no 3/4), (1979), 211–226.
Vozoff, K. (1991). The magnetotelluric method, Electromagnetic Methods in Geophysics. M. N. Nabighian. Tulsa, Oklahoma,USA, Society of Exploration Geophysicists, 2, (1991), 641-711.