HAL Id: hal-00317990
https://hal.archives-ouvertes.fr/hal-00317990
Submitted on 22 Nov 2005
HAL is a multi-disciplinary open access
archive for the deposit and dissemination of
sci-entific research documents, whether they are
pub-lished or not. The documents may come from
teaching and research institutions in France or
abroad, or from public or private research centers.
L’archive ouverte pluridisciplinaire HAL, est
destinée au dépôt et à la diffusion de documents
scientifiques de niveau recherche, publiés ou non,
émanant des établissements d’enseignement et de
recherche français ou étrangers, des laboratoires
publics ou privés.
Fluxes and fluences of SEP events derived from
SOLPENCO
A. Aran, B. Sanahuja, D. Lario
To cite this version:
A. Aran, B. Sanahuja, D. Lario. Fluxes and fluences of SEP events derived from SOLPENCO. Annales
Geophysicae, European Geosciences Union, 2005, 23 (9), pp.3047-3053. �hal-00317990�
SRef-ID: 1432-0576/ag/2005-23-3047 © European Geosciences Union 2005
Annales
Geophysicae
Fluxes and fluences of SEP events derived from SOLPENCO
A. Aran1, B. Sanahuja1,2, and D. Lario31Departament d’Astronomia i Meteorologia, Universitat de Barcelona, Barcelona, Spain
2CER d’Astrof´ısica, F´ısica de Part´ıcules i Cosmologia, Unitat associada al CSIC, Barcelona, Spain 3Applied Physics Laboratory. The Johns Hopkins University, Maryland, USA
Received: 22 February 2005 – Revised: 17 June 2005 – Accepted: 18 July 2005 – Published: 22 November 2005 Part of Special Issue “1st European Space Weather Week (ESWW)”
Abstract. We have developed (Aran et al., 2004) a tool for
rapid predictions of proton flux and fluence profiles observed during gradual solar energetic particle (SEP) events and up-stream of the associated traveling interplanetary shocks. This code, named SOLPENCO (for SOLar Particle ENgineering COde), contains a data base with a large set of interplanetary scenarios under which SEP events develop. These scenarios are basically defined by the solar longitude of the parent so-lar activity, ranging from E75 to W90, and by the position of the observer, located at 0.4 AU or at 1.0 AU, from the Sun. We are now analyzing the performance and reliability of SOLPENCO. We address here two features of SEP events especially relevant to space weather purposes: the peak flux and the fluence. We analyze how the peak flux and the flu-ence of the synthetic profiles generated by SOLPENCO vary as a function of the strength of the CME-driven shock, the heliolongitude of the solar parent activity and the particle en-ergy considered. In particular, we comment on the depen-dence of the fluence on the radial distance of the observer (which does not follow an inverse square law), and we draw conclusions about the influence of the shock as a particle ac-celerator in terms of its evolving strength and the heliolongi-tude of the solar site where the SEP event originated.
Keywords. Interplanetary physics (Energetic particles;
In-terplanetary shocks)
1 Introduction
Predictions of solar energetic particle (SEP) events are still in their infancy (Turner, 2001). The underlying physics of these space weather phenomena is not completely understood yet. For example, the solar mechanisms that lead to the onset of SEP events and the processes that rule the injection and ac-celeration of particles are still a matter of intense research Correspondence to: A. Aran
(aaran@am.ub.es)
(Cliver and Cane, 2002). The present knowledge of the solar-interplanetary scenario where SEP events generate and de-velop (e.g., Reames, 1999; Cane et al., 2003; Lee, 2005, and references therein) however, allows us to perform a first at-tempt to predict proton flux profiles of SEP events associated with shocks driven by coronal mass ejecctions (CMEs). In this work we will assume that the main contribution to the particle intensities measured during a SEP event comes from the traveling CME-driven shocks that accelerate and inject energetic particles as they move away from the Sun and pro-pagate toward the observer.
We have developed SOLPENCO (SOLar Particle ENgi-neering COde), an operative code for the prediction of SEP flux and fluence that aims to be useful for space weather purposes. SOLPENCO is based on the combined shock-plus-particle transport simulation model built by Lario et al. (1998). This model assumes that the injection of shock-accelerated particles takes place at the cobpoint, that is the point on the front of the CME-driven shock that magneti-cally connects with the observer (see definition of cobpoint in Heras et al., 1995). The cobpoint changes its location along the shock front and its properties as the CME-driven shock expands in interplanetary space. The interactions be-tween the interplanetary magnetic field (IMF) and the shock-accelerated particles injected from the shock are modeled via a transport equation that takes into account the effects of streaming, convection and adiabatic deceleration (Lario et al., 1998). The propagation of the interplanetary shock from the Sun up to 1 AU is modeled by means of the MHD model of Wu et al. (1983). The resulting set of coupled par-ticle transport equations for different energies has two main parameters: the injection rate of shock-accelerated particles and their mean free path. These parameters are derived by comparing the output flux and first order anistropy profiles with the corresponding observational profiles, looking for the best possible simultaneous fit for all the considered en-ergies (see Lario et al., 1998 for more details). The core of SOLPENCO (Aran et al., 2004) is a database which contains
3048 A. Aran et al.: SEP events from SOLPENCO
a large number of precalculated particle flux profiles, as-suming a given injection rate of shock-accelerated particles (Lario et al., 1998) for different solar – interplanetary scenar-ios. This allows a rapid computation of particle fluxes and fluences by interpolation of other possible scenarios for gra-dual SEP events, under user’s demand (within a given range of possibilities, see next paragraph).
The present version of SOLPENCO (see Aran et al., 2004 in http://www.am.ub.es/∼blai for details, and Aran et al., 2005) provides the flux and cumulative fluence profiles of SEP events characterized by the following para-meters: [1] the heliocentric distance of the spacecraft (either 1 AU or 0.4 AU); [2] the initial speed of the shock, v, (any value between 750 and 1800 km s−1); [3] the heliolongitude of the solar parent activity, h, (any value between W90 and E75); [4] the proton mean free path, λ (either 0.2 AU or 0.8 AU for 0.5 MeV protons and scaled with the particle rigidity, P, as λ∝P1/2); [5] the presence of a foreshock region (Yes or No); and [6] the proton energy (0.125, 0.25, 0.5, 1, 2, 4, 8, 16, 32 or 64 MeV). All these parameters are input variables that the user can select through a friendly interface. The user can also provide different solar-interplanetary scenarios by changing both the initial shock speed v and the heliolongitude h. Therefore, the code provides at least, if only integer values of v and h are considered 697,864 possibilities for each proton energy and heliocentric distance.
The outputs provided by SOLPENCO depend on the av-eraged values used as input to describe the interplanetary scenario where SEP events develop. By “interplanetary sce-nario” here we mean both the conditions for injection and propagation of shock-accelerated particles (characterized by the input variables [4], [5], [6] and indirectly through the variable [2] and the relative position in space of the observer with respect to the Sun, i.e. the heliocentric radial distance of the observer, and the heliolongitude of the solar activity asso-ciated with the origin of the SEP event (respectively charac-terized by the input variables [1] and [3]. This heliolongitude also defines the direction of propagation of the shock in in-terplanetary space by assuming that the nose of the shock is centered in the heliolongitude h.
Here we focus on two of the outputs of the code relevant to space weather purposes: the peak intensity and the total fluence of the SEP events (i.e. Feynman and Gabriel, 2000). The values derived from SOLPENCO correspond only to the upstream part of the SEP events, that is, from the onset of the event up to the arrival of the CME-driven shock at the spacecraft. We expect to include the downstream region of the shock and the decay phase of the SEP events in the near future. The reliability and operativeness of this code will only be achieved after a comprehensive analysis of the de-pendence of the outputs on the averaged values of the in-put variables. For example, the parametric function used by SOLPENCO to relate the evolution of the injection rate of shock-accelerated particles to the speed of the shock all along its front (known as the Q-VR relation, see Aran et al., 2004) needs to be validated with the simulation of a large number
of SEP events. In addition, SOLPENCO will only be full op-erative when the input variable [2], i.e. the initial speed of the shock, can be replaced or derived from reliable and quantifi-able observational proxies that nowadays neither CMEs nor radio observations can provide yet.
2 The SEP peak intensity
The peak intensity of the differential flux profiles (here-after the “peak flux”) of SEP events usually appears either shortly after the onset of the event or around the shock ar-rival. Its location and value in each SEP event largely pend on the solar-interplanetary scenario where the event de-velops. It is well known that the time-intensity profiles of the SEP events depend on the relative geometric position of the observer with respect to the parent solar activity (Cane et al., 1988), but also on the considered particle energies, the characteristics of the interplanetary shock (i.e. its orien-tation and strength), and the conditions for particle propaga-tion. We characterize these particle propagation conditions by both the existence (or absence) of a foreshock region able to confine energetic particles and by the pitch-angle scat-tering processes (parametrized by a mean free path) under-gone by the particles as they propagate along the IMF lines. Other possible significant factors, like the presence of an energy-dependent seed particle population (Kahler, 2001) or the presence of preceding CMEs (Gopalswamy et al., 2004) have not yet been taken into account in SOLPENCO because a guide of how to quantify their influence does not exist yet (not even approximately).
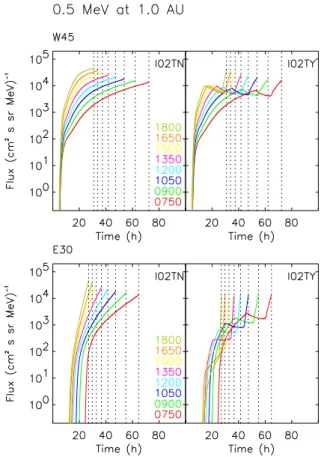
In the present discussion we will focus on the SEP peak fluxes derived from the flux profiles for the events contained in the data set of SOLPENCO at 1 AU. This data set consists of 4480 different scenarios 8 shock speeds x 14 spacecraft angular locations x 4 transport conditions x 10 energy chan-nels). The eight initial shock speeds, v, considered are 750, 900, 1050, 1200, 1350, 1500 , 1650, and 1800 km s−1. The fourteen angular locations, h, are W90, W75, W60, W45, W30, W22.5, W15, W00, E15, E22.5, E30, E45, E60, and E75, measured with respect to the site of the solar event. The four transport conditions refer to the two choices for the mean free path, λ (input variable [4] and to the pres-ence or abspres-ence of a foreshock region (input variable [5]). As an example, Fig. 1 shows the flux profile of 0.5 MeV pro-tons for two observers located at 1 AU, at W45 and E30 he-liolongitudes (top and bottom panels, respectively), for the eight shock speeds contained in the data base (color coded). All the flux profiles shown in Fig. 1 are calculated assum-ing λ=0.2 AU, and considerassum-ing the absence or existence of a 0.1 AU thick foreshock region (left and right panels, respec-tively). The flux and fluence profiles for the case λ=0.8 AU (not shown here) are only slightly different to those presented and they lead to the same conclusions. The highest values of the peak fluxes are, in general, obtained for the fastest shocks and for central meridian events. As can be seen in Fig. 1, the faster the shock the higher the fluxes. Thanks to
the parametric Q-VR relation, the speed of the shock trans-lates into an injection rate of shock-accelerated particles, in such a way that the faster the shock the more efficient in par-ticle acceleration (Aran et al., 2004).
The difference between the flux profiles corresponding to the same initial shock speeds in the top and bottom panels of Fig. 1 are a direct consequence of the different conditions in the regions scanned by the cobpoint, the point of the shock front that magnetically connects with the observer. As the shock moves away from the Sun, the cobpoint moves along the shock front and scans different regions of it depending on the longitude of the observer with respect to the parent solar activity site. Western events have rapid rises to a max-imum because, initially, the cobpoint is close to the nose of the shock near the Sun. As the shock expands, the cobpoint moves to the eastern flank of the shock and injects less par-ticles than at the onset of the event. For eastern events, the magnetic connection between the observer and the shock is established later in the event and hence the delayed onset. In addition, the cobpoint moves closer to the nose of the shock and hence the continuously increasing flux profiles shown in the bottom panels of Fig. 1. The presence of a foreshock re-gion allows the confinement of energetic particles in front of the traveling shock, and hence the lower fluxes observed in the prompt component of the events but the increase in the particle intensities just before the arrival of the shock (right panels of Fig. 1).
The majority of the computed SEP flux profiles in the data set of SOLPENCO peaks at the shock passage, like the events shown in Fig. 1 (97% of the 4480 flux profiles of the database, that increases to 99.9% for E<32 MeV). In the re-maining 134 cases, 94 show the peak flux from 1 to 25 min before the shock arrival, and in 40 cases, the peak flux ap-pears shortly after the onset of the event, and several hours before the arrival of the shock; all of them correspond to western events with heliolongitudes westward of W30 and for high energies (24 events at 64 MeV, 12 events at 32 MeV and 2 events at 8 MeV). This behavior is the same that can be found in the observed flux profiles of many western SEP events at similar energies (i.e. Cane et al., 1988). Figure 2 shows the intensity of the 1 MeV peak flux, at 1 AU, as a function of the 8 shock speeds and the 14 values of h, aver-aged for the four possible transport conditions given by the input variables [4] and [5]. From the values shown in Fig. 2, we conclude that the most intense peak fluxes correspond to the observers located at W00, W15 and W22.5. This is an ex-pected result because, for one observer located at 1 AU, the magnetic connection between the observer and the shock is established near the central part of the shock (i.e. its strongest part) as the shock reaches the observer. For a given angular position, h, the peak flux increases with the initial speed of the shock. The E75 events (far-eastern events) are excep-tions to this behavior. For these events, the observer estab-lishes magnetic connection with the shock a few hours be-fore the arrival of the shock and on the distant western flank of the shock front, a region less efficient in terms of particle acceleration because the shock is weaker than in its central
Fig. 1. SOLPENCO: Two examples of the flux profiles of the data base. Synthetic 0.5 MeV proton flux profiles for two observers located at 1 AU and at W45 and E30 of heliolongitude (two top and two bottom panels, respectively). The initial velocity of the eight simulated shocks is color coded (from top to bottom, v: 1800, 1650, 1500, 1350, 1200, 1050, 900, and 750 km s−1), as indicated in the inset of the left panel. The particle mean free path assumed is λ=0.2 AU. Vertical dashed lines mark the arrival time for each shock at the observer’s location. Left panels show the respective flux profiles without assuming the existence of a foreshock region ahead of the shock. Right panels show the same profiles, assuming the existence of such a foreshock.
part. In these cases, the duration of the injection of shock-accelerated particles is the relevant factor for the intensity of the peak flux, thus low-velocity (weaker) shocks show a higher peak flux than high-velocity (stronger) shocks simply because they can accelerate particles for a longer period be-fore reaching the observer’s position. The same behavior is also found for energies lower than those shown in Fig. 2 at which the shocks are more efficient accelerating particles. At higher energies (16 MeV<E<64 MeV), since the injection of shock-accelerated particles is less efficient, the effect of the duration of the shock particle injection becomes balanced by the effect of the strength of the shock, showing increasing peak fluxes with the initial shock speed. The peak fluxes de-rived from the flux profiles computed at 0.4 AU show similar behavior to those shown in Fig. 2, adding the case E15 to the group of central meridian observers with the most intense peak fluxes.
3050 A. Aran et al.: SEP events from SOLPENCO
Fig. 2. Variation of the 1 MeV proton peak flux as a function of the initial shock speed and the heliolongitude of the observers located at 1 AU. The 14 heliolongitudes are color coded from top (higher peak flux values) to bottom (lower values) as indicated. To make the plot clear, the lines have been binned in three traces: dashed lines for western events (from W90 to W45), solid lines for cen-tral meridian events (from W30 to E30) and dotted lines for eastern events (from E45 to E75). These values of the peak flux are the av-eraged value of the peak intensity of the flux profiles corresponding to the four transport conditions, decribed by variables [4] and [5], for each initial shock speed and heliolongitude.
Table 1. Values derived for the correlation coefficient between f and v, at 1 AU, for three energies of the particles, as a function of the heliolongitude of the observer’s location. Each row shows the values of α and the coefficient of correlation, r, of the fit, for western, central meridian and eastern SEP events. The fourth row shows the corresponding values derived from the fit of the whole set of heliolongitudes.
Heliolongitude 0.5 MeV 2 MeV 16 MeV W90−W30 0.92 (0.65) 1.02 (0.63) 1.11 (0.63)
W30−E30 1.36 (0.88) 1.60 (0.93) 1.93 (0.96) E30−E75 0.29 (0.21) 0.57 (0.41) 1.05 (0.68) W90−E75 0.93 (0.49) 1.13 (0.58) 1.42 (0.67)
The correlation of proton peak fluxes of SEP events and the speed of the associated CMEs as seen from coronagraph images was studied by Reames (2000). He derived a power-law dependence between the peak flux of the SEP events and the projected velocity of the CME that triggers the SEP event (with an average slope of 4.36 at ∼2 MeV and of 4.83 at
∼20 MeV). Although we are not dealing with CME veloc-ities, we have studied the possibility that the same type of functional dependence exists between the peak flux, f, and the initial shock speed given by SOLPENCO, v, for each
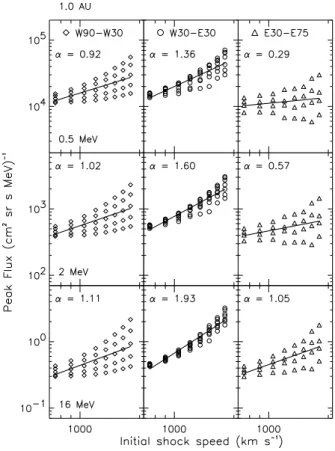
an-Fig. 3. The correlation between the computed peak flux (f) for 1 AU SEP events and the initial shock speed (v) for 0.5 MeV, 2 MeV and 16 MeV (top, middle and bottom panels, respectively). Each row displays three plots: western, central meridian and eastern events. The black line in each plot depicts the best linear fit to these points and the derived dependence, f ∝ vα, is shown in the upper corner. The values of the peak fluxes are average values calculated as in Fig. 2.
gular position of the observer at 1 AU. Therefore, assum-ing f ∝ vα, we can compute the linear fits for the different sets of interplanetary scenarios contained in the data base of SOLPENCO. Figure 3 shows the derived values of α for three energies (0.5 MeV, 2 MeV and 16 MeV from top to bot-tom, respectively). Each row displays three panels show-ing the peak flux grouped for “western events” (from W90 to W30, diamond symbols), “central meridian events” (from W30 to E30, open circles) and “eastern events” (from E30 to E75, open triangles). Table 1 displays the value of α derived for each set of values as well as the correlation coefficient; last line in Table 1 gives the results of the fitting applied to the overall set. The relation between the initial shock speed v and the speed of the leading edge of the CME is unknown, and therefore the values of α shown in Table 1 are not di-rectly comparable to those deduced by Reames (2000). Fac-tors such as coronagraph image projections and location of the shock in the CME white-light images used to compute the CME speed need to be considered.
The correlation coefficients shown in Table 1 increase with particle energy when the whole set of heliolongitudes
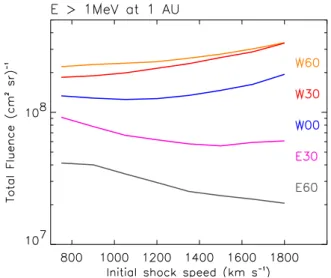
Fig. 4. Total fluence of protons above 1 MeV as a function of the initial shock speed and the heliolongitude, for observers located at 1 AU. For simplicity, the plot only shows 6 cases (color coded) among the 14 possible heliolongitudes. These values of the total fluence are the averaged values of the total fluence corresponding to the four possible transport conditions, variables [4] and [5], for each initial shock speed and heliolongitude.
are taken into account reproducing the same trend found by Reames (2000). This behavior is explained by the fact that the higher the energy of the particles, the less effect of the interplanetary transport processes on the final flux profiles. As it is shown in Table 1, the correlation coefficients also increase with the energy when only specific sets of either central meridian or eastern events are considered; while for western events the correlation coefficients do not improve with the energy. The reason is twofold: [1] western events have the largest transit times and [2] shock-accelerated par-ticles are mostly injected at the onset of the event when the cobpoint is still connected to the strongest part of the shock. Therefore, in western events the transport processes have a stronger effect on the high-energy particles considered in SOLPENCO than in central meridian and eastern cases. Note that only 40 western events show the peak flux at the onset of the event whereas for the rest of events the peak flux occurs close to the shock passage. Central meridian events display a much better correlation between the initial shock speed and the peak flux than western and eastern events. This is a con-sequence of the fact that for central meridian events the cob-point is connected to the strongest region of the shock front when the shock arrives at the spacecraft, and thus, transport effects are less relevant with respect to the efficiency of the shock injecting particles in the interplanetary medium. As shown in Fig. 2 the faster the shock the higher the peak flux. For eastern events the cobpoint scans only a small portion of the left wing of the shock front and the shock is not con-nected to the observer from the beginning of the event. These two facts explain the poor correlation obtained between the peak flux and the initial speed of the shock for these events.
Fig. 5. Total fluence, calculated as in Fig. 4, of protons above 1 MeV as a function of the initial shock speed and the heliolongitude, for observers located at 0.4 AU. For simplicity, the plot only shows 6 cases (color coded) among the 14 possible heliolongitudes.
3 Total upstream fluences and radial dependence
The total upstream fluence for each scenario of SOLPENCO’s data base is computed by integrating the flux from the onset of the event up to the shock arrival and above a given energy. Two main factors determine the total fluence: [1] the time duration of the injection of shock-accelerated particles, as the shock propagates from the Sun to the observer’s position, and [2] the efficiency of the shock as a particle accelerator, which in turn depends on the position and evolution of the cobpoint. Therefore, we have studied the dependence of the total fluence with the initial shock speed and the heliolongitude of the solar parent activity. Figures 4 and 5 show the values of the >1 MeV proton fluence for two observers, respectively located at 1 AU and 0.4 AU, for different heliolongitudes (color coded) and for different initial shock speeds (horizontal axis), averaged for the four possible transport conditions depicted by the input variables [4] and [5].
Figure 4 shows that for observers at 1 AU and for a given heliolongitude, the highest fluences are achieved for the fastest shocks (that according to our assumptions are the most efficient in particle acceleration). The exception are those events originated from the eastern hemisphere in which the duration of the event is the factor that determines the event fluence. For eastern events, the faster the shock, the shorter the delay between the time that the observer es-tablishes magnetic connection with the shock and the time that the shock moves past the observer, and consequently the shorter the duration of the particle injection, and thus the lower the fluence of the event. Figure 4 also shows that for a given initial shock speed, the highest fluences at 1 AU are achieved for those events in which the observer establishes magnetic connection with the shock from the onset of the
3052 A. Aran et al.: SEP events from SOLPENCO
Fig. 6. Radial index (for E>2 MeV, see text) plotted as a function of the initial shock speed. Each line represents one pair of SEP events at 0.4 AU and at 1.0 AU which, approximately, share the same IMF line.
event, when the shock is still strong and close to the Sun (i.e. western events), and among them, those that last longer (i.e. W60 events).
By contrast, the duration of the injection of particles at 0.4 AU (Fig. 5) is not as relevant as at 1 AU since the differ-ences in the duration of the events at 0.4 AU are smaller than those of the events at 1 AU. For instance, W00 events associ-ated with fast shocks have a fluence larger than the equivalent W30 events because of the higher strength of the shock at the cobpoint’s location in central meridian events that com-pensates and exceeds the effect of the longer duration of the W30 events (Fig. 5). For a given initial shock speed, the highest fluences are achieved for those observers that have a better connection with the shock throughout the event. For poor-connected events (i.e. eastward of E30 for observers at 0.4 AU), the duration of the event plays a bigger factor and the fluence decreases with the shock speed.
By comparing the fluences derived from SOLPENCO at 1 AU (Fig. 4) and at 0.4 AU (Fig. 5) we conclude that the contribution of particle-acceleration in interplanetary space between 0.4 AU and 1 AU and at the energies analyzed in this work (E<64 MeV) is very important: the fluences ob-served at 1 AU are noticeably higher than the corresponding fluences measured at 0.4 AU, a factor between three and ten times depending on the velocity and heliolongitude consid-ered. This conclusion is against the usually recommended, but not proved, inverse square law dependence with the helio-centric distance (e.g. Feynman et al., 1993). This dependence was based upon the superseded idea that particle acceleration is mainly confined at the flare site or nearby, neglecting the contribution due to the interplanetary shock. L. Rosenqvist and A. Hilgers (2003, private communication) reported that the data from Helios spacecraft do not support the inverse square law hypothesis. Nevertheless, in order to confirm any
radial dependence of fluences (or peak fluxes) more observa-tions in the inner interplanetary space are needed.
We have compared the total fluence of the events for sev-eral pairs of observers at 0.4 and 1 AU almost sitting on the same field line. Assuming a Parker spiral for the up-stream IMF topology with a background solar wind speed of 400 km s−1, those observers are ∼30◦apart in longitude. Since both observers are sitting on the same field line, they share the same cobpoint, and therefore the same particle in-jection history. The travel time of the shock is longer for the observer at 1 AU than for the observer at 0.4 AU, thus re-sulting in larger fluences at 1 AU than at 0.4 AU. Assuming that the total fluence, F, of particles above a certain energy, E, depends on the radial distance, d, as F ∝ dβ, we can cal-culate for each pair of observers at 0.4 and 1.0 AU the ratio of fluences F(0.4)/F(1.0) and deduce the radial index, β, as F(0.4)/F(1.0) = 0.4β. As an example, Fig. 6 shows the
ra-dial index for protons with E>2 MeV, and for serveral pair of observers. Since the total fluence of the event at 1 AU is larger than its pair at 0.4 AU, the obtained radial index is always positive. For magnetically well-connected events,
β decreases with the initial shock speed, suggesting that the faster the shock the shorter the duration of the event and thus, the less difference between the fluence of the SEP event at 1 AU and 0.4 AU. The values of β derived for higher en-ergy thresholds (<64 MeV) display the same pattern than in Fig. 6, but the values derived of β are slightly higher. These results should be revisited after including in the code the con-tribution of the downstream fluence of each event.
4 Conclusions
We have developed the first tool for prediction of proton flux and cumulative fluence profiles of SEP events associ-ated with CME-driven shocks. This is a first step toward a fully operational tool. Apart from the data set of 4480 events presented here, SOLPENCO offers the opportunity to obtain in less than 1 min predictions for an event selected by the user by interpolating among the closest events con-tained in the database. Here we have studied the dependence of the peak flux and total fluence of SEP events generated by SOLPENCO on the initial velocity of the shock and the helilongitude of the parent solar activity. The highest peak fluxes correspond to central meridian events associated with fast shocks. For these events, a good correlation between the peak flux and the initial shock speed is found. Two main factors account for the intensity of the total fluence: the duration of the injection of shock-accelerated particles and the strength of the shock as a particle accelerator. The highest fluences are achieved by the fastest well-connected events. The analysis of the fluences derived for observers at 0.4 AU and 1.0 AU does not support the hypothesis of the inverse square law dependence of the fluence with the helio-centric radial distance. All the synthetic profiles provided by SOLPENCO must be validated with observational data. We are currently undertaking this task.
Acknowledgements. We acknowledge the financial support of ESA/ESTEC Contract 14098/99/NL/MM and that of the Ministerio de Ciencia y Tecnolog´ıa (Spain), under the project AYA2001-3304 and AYA2004-03022. Partial computational support has been pro-vided by the Centre de Supercomputaci´o de Catalunya (CESCA). BS is member of COST 724 Action and acknowledges its support. DL was supported by NASA grant NAG5-10787. AA was partially supported by AGAUR grant BE2003BEAI200229.
Topical Editor R. J. Forsyth thanks S. Dalla and S. B. Gabriel for their help in evaluating this paper.
References
Aran, A., Sanahuja, B., and Lario, D.: An engineering model for solar energetic particles in interplanetary space, Final Report, ESA/ESTEC Contract 14098/99/NL/MM, 2004.
Aran, A., Sanahuja, B., and Lario, D.: SOLPENCO: A solar particle engineering code, accepted in Adv. Space Res., 2005.
Cane, H. V., Reames, D. V., and von Rosenvinge, T. T.: The Role of Interplanetary Shocks in the Longitude Distribution of Solar Energetic Particles, J. Geophys. Res., 93, 9555–9567, 1988. Cane, H. V., von Rosenvinge, T. T., Cohen, C. M. S., and Mewaldt,
R. A.: Two components in major solar particle events, Geophys. Res. Lett., 30, SEP 5–1, doi:10.1029/2002GL016580, 2003. Cliver, E. W. and Cane, H. V.: The last word, EOS Trans. AGU, 83,
61–68, 2002.
Feynman, J. and Gabriel, S. B.: On space weather consequences and predictions, J. Geophys. Res., 105, 10 543–10 564, 2000. Feynman, J., Spitale, G., and Wang, J., et al.: Interplanetary Proton
Fluence Model: JPL 1991, J. Geophys. Res., 98, 13 281–13 294, 1993.
Gopalswamy, N., Yashiro, S., and Krucker, S., et al.: Inten-sity variation of large solar energetic particle events associated with coronal mass ejections, J. Geophys. Res., 109(A12), 105, doi:10.1029/2004JA010602, 2004.
Heras, A. M., Sanahuja, B., and Lario, D., et al.: Three low energy particle events: Modeling the influence of the parent interplane-tary shock, Astrophys. J., 445, 497–508, 1995.
Kahler, S. W.: The correlation between solar energetic particle peak intensities and speeds of coronal mass ejections: Effects of ambi-ent particle intensities and energy spectra, J. Geophys. Res., 106, 20 947–20 955, 2001.
Lario, D., Sanahuja, B., and Heras, A. M.: Energetic particle events: efficiency of interplanetary shocks as 50 keV<E<100 MeV pro-ton accelerators, Astrophys. J., 509, 415–434, 1998.
Lee, M. A.: Coupled Hydromagnetic Wave Excitation and Ion Ac-celeration at an Evolving Coronal/Interplanetary Shock, Astro-phys. J. Suppl., 158, 38–67, 2005.
Reames, D. V.: Particle acceleration at the Sun and in the helio-sphere, Space Sci. Rev., 90, 413–491, 1999.
Reames, D. V.: Particle Acceleration by CME-Driven Shock Waves, AIP Conference Proceedings, 516, 289–300, 2000. Turner, R.: What we must know about solar particle events to
re-duce the risk of astronauts, in: Space Weather, (Eds.) Song, P., Singer, H. J., and Siscoe, G. L., Vol. 125 of AGU Geophysical Monograph, 39–44, 2001.
Wu, S. T., Dryer, M., and Han, S. M.: Non-planar MHD model for solar flare-generated disturbances in the heliospheric equatorial plane, Solar Phys., 84, 395–418, 1983.