HAL Id: hal-00318253
https://hal.archives-ouvertes.fr/hal-00318253
Submitted on 1 Feb 2007
HAL is a multi-disciplinary open access
archive for the deposit and dissemination of
sci-entific research documents, whether they are
pub-lished or not. The documents may come from
teaching and research institutions in France or
abroad, or from public or private research centers.
L’archive ouverte pluridisciplinaire HAL, est
destinée au dépôt et à la diffusion de documents
scientifiques de niveau recherche, publiés ou non,
émanant des établissements d’enseignement et de
recherche français ou étrangers, des laboratoires
publics ou privés.
Equatorial annual oscillation with QBO-driven 5-year
modulation in NCEP data
H. G. Mayr, J. G. Mengel, F. T. Huang, E. R. Nash
To cite this version:
H. G. Mayr, J. G. Mengel, F. T. Huang, E. R. Nash. Equatorial annual oscillation with QBO-driven
5-year modulation in NCEP data. Annales Geophysicae, European Geosciences Union, 2007, 25 (1),
pp.37-45. �hal-00318253�
www.ann-geophys.net/25/37/2007/ © European Geosciences Union 2007
Annales
Geophysicae
Equatorial annual oscillation with QBO-driven 5-year modulation
in NCEP data
H. G. Mayr1, J. G. Mengel2, F. T. Huang3, and E. R. Nash2
1NASA, Goddard Space Flight Center, Greenbelt, MD, 20771, USA 2Science Systems and Applications Inc., Lanham, MD, 20706, USA 3Creative Computing Solutions Inc., Rockville, MD, 20850, USA
Received: 8 December 2006 – Accepted: 15 January 2007 – Published: 1 February 2007
Abstract. An analysis is presented of the stratospheric zonal
wind and temperature variations supplied by the National Center for Environmental Prediction (NCEP). The derived zonal-mean variations are employed. Stimulated by mod-eling studies, the data are separated into the hemispheri-cally symmetric and anti-symmetric components, and spec-tral analysis is applied to study the 12-month annual oscilla-tion (AO) and the quasi-biennial oscillaoscilla-tion (QBO). For data samples that cover as much as 40 years, the zonal wind re-sults reveal a pronounced 5-year modulation of the symmet-ric AO in the lower stratosphere, which is confined to equato-rial latitudes. This modulation is also seen in the temperature variations but extends to high latitudes, qualitatively consis-tent with published model results. A comparison between different time intervals of the data indicates that the signa-ture of the 5-year oscillation is larger when the QBO of 30 months is more pronounced. Thus there is circumstantial ev-idence that this particular QBO period is involved in generat-ing the oscillation as was shown in a modelgenerat-ing study (Mayr et al., 2000). In agreement with the model, the spectral analysis also reveals a weak anti-symmetric 5-year oscillation in the zonal wind data, which could interact with the strong anti-symmetric AO to produce the modulation of the anti-symmetric AO. The 30-month QBO is well suited to be synchronized by, and phase-locked to, the equatorial semi-annual oscilla-tion (SAO), and this may explain why this QBO periodicity and its 5-year spin-off are observed to persist for many cy-cles.
Keywords. Meteorology and atmospheric dynamics
(Gen-eral circulation; Middle atmosphere dynamics; Waves and tides)
Correspondence to: H. G. Mayr
(hans.mayr@gsfc.nasa.gov)
1 Introduction and background
At equatorial latitudes in the stratosphere, the mean zonal circulation is dominated by the quasi-biennial oscillation (QBO) and semi-annual oscillation (SAO). Reviewed by Baldwin et al. (2001), the QBO has periods between 22 and 34 months and originates in the lower stratosphere (Reed, 1965); while the 6-month SAO is more important in the upper stratosphere (Hirota, 1980). It was demonstrated by Lindzen and Holton (1968), Holton and Lindzen (1972), and others (e.g. Plumb, 1977; Dunkerton, 1985) for the QBO, and by Dunkerton (1979) and Hamilton (1986) for the SAO, that these equatorial oscillations can be driven by the mo-mentum deposition from eastward propagating Kelvin waves and westward propagating Rossby gravity waves. Later mod-eling studies with observed planetary waves led to the con-clusion that small-scale gravity waves (GW) appear to be more important (e.g. Hitchman and Leovy, 1988). With a general circulation model (GCM) that resolves the planetary-scale waves, Hamilton et al. (1995) showed that the QBO in the stratosphere was an order of magnitude smaller than ob-served, thus providing further circumstantial evidence for the importance of GWs. Except for a few attempts at simulating the QBO with resolved GWs (e.g., Takahashi, 1999), these waves need to be parameterized for global-scale models (e.g., Giorgetta et al., 2002).
In the context of this paper, we wish to review the dy-namical properties that control the equatorial oscillations, which were discussed by Lindzen and Holton (1968) in their seminal theory for the QBO. At low latitudes, and at the equator precisely, the Coriolis force vanishes so that the wave momentum source is dissipated only by diffu-sion. At the equator, the meridional circulation does not come into play to redistribute the flow momentum. (To first order, the equatorial QBO can be described with a one-dimensional model, Lindzen and Holton referred to as “pro-totype model”.) Wave-mean-flow interactions are thus very
38 H. G. Mayr et al.: Equatorial annual oscillation with QBO-driven 5-year modulation
effective in generating and amplifying the equatorial zonal wind oscillations. This is evident from models with latitude-independent wave source, which produce a QBO that still peaks at the equator and is confined to low latitudes (e.g., Mengel et al., 1995).
For the wave forcing around the equator to be so effec-tive, it is essential that the generated oscillations are hemi-spherically symmetric, which applies to the QBO and SAO to first order. Waves propagating up around the equator then can generate flow oscillations that tend to be in phase across the region. Phenomena that are to first order hemispheri-cally anti-symmetric, in contrast – primarily the 12-month annual oscillation (AO) with opposite phase in the Northern and Southern Hemispheres – tend to vanish at the equator. The opposite wave forcing in the two hemispheres is then relatively ineffective in generating and amplifying coherent oscillations around the equator.
Our data analysis has been stimulated by a recent study (Mayr et al., 2005), which shows that, in addition to the clas-sical equatorial oscillations of the QBO and SAO, a symmet-ric 12-month AO is generated in the model. In the zonal winds, this oscillation is confined to low latitudes. Ob-served annual oscillations at tropical latitudes have been doc-umented for the temperatures (e.g., Reed and Vlcek, 1969; Pawson and Fiorino, 1998) and zonal winds (COSPAR Inter-national Reference Atmosphere, 1986). Our analysis is also guided by model predictions (Mayr et al., 2003), which show that the QBO – depending on its periodicity – can generate long-term internal oscillations through interaction with the seasonal cycles.
2 Data analysis
In our study, we employ data from two sources: (1) National Center for Environmental Prediction (NCEP)/National Cen-ter for Atmospheric Research R-1 reanalyses (Kalney et al., 1996) from 1958; and (2) NCEP Climate Prediction Cen-ter (CPC) stratospheric analyses (Gelman et al., 1994) from 1979. The R-1 data extend from the surface to 10 hPa (ap-proximately 31 km) and are spaced at 2.5 degrees in latitude. The CPC data extend to 0.4 hPa (approximately 55 km) and are spaced at 2.0 degrees in latitude. We use zonal-mean zonal winds from the R-1 analysis and temperatures from the CPC analysis.
Considering the above-discussed characteristics and im-portance of wave forcing, which controls the equatorial os-cillations, we shall delineate for diagnostic purposes the NCEP data in terms of their hemispherically symmetric and anti-symmetric components. For this purpose, the data (D) at the same latitude in the Northern (n) and South-ern (s) Hemispheres, Dn and Ds, respectively, are split up
into the symmetric (S) and anti-symmetric (A) elements by computing respectively DS=(Dn+Ds)/2 and DAn=(Dn–
Ds)/2, DAs=(Ds–Dn)/2. The original data in the two
hemi-spheres are then reproduced by the addition of the symmet-ric and anti-symmetsymmet-ric components, i.e., Dn=DS+DAn and
Ds=DS+DAs. As discussed above, DS would describe
pri-marily the QBO and SAO that characterize the nearly sym-metric atmospheric oscillations around the equator, while DAn=–DAs would represent to first order the dominant
12-month AO with opposite phase in the two hemispheres. Employing different data samples, the hemispherically symmetric and anti-symmetric components are spectrally an-alyzed to describe the AO, QBO and long-term variations. The important spectral features are then synthesized to re-veal, for comparison, the different oscillations embedded in the data. Our analysis is restricted to the stratosphere at alti-tudes above 10 km.
3 Analysis results
The more extensive R-1 reanalysis (R-1) data cover the years from 1958 to 2006, and for ease of reference we count the years by starting with 0 in 1958. With this notation, the time coverage goes from 0 to 48 years for the R-1 data and from 21 to 48 years for the CPC data.
3.1 R-1 zonal winds
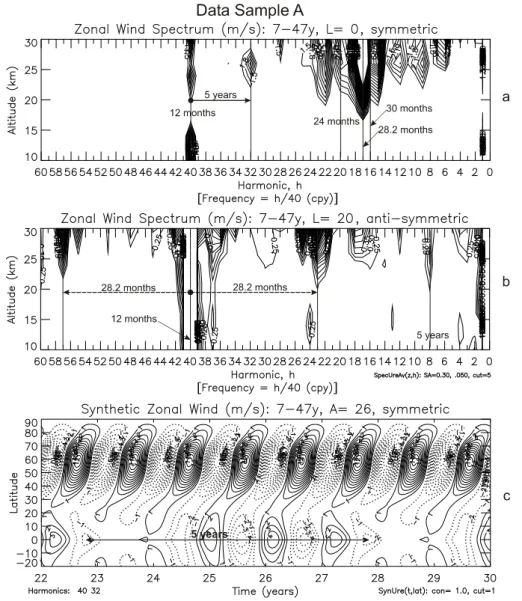
For reasons that will become clear subsequently, we present with Fig. 1 the analysis results for Sample A (defined in Fig. 2b) from the R-1 data set, which is restricted to the range between 7 and 47 years. Shown in Fig. 1a is the hemispher-ically symmetric component of the amplitude spectrum for the zonal winds at 0 degrees latitude (virtually identical at 5 degrees), which is plotted versus altitude from 10 to 30 km. The spectrum is obtained from a Fourier analysis of the 40-year time span, and we present it in terms of the discrete har-monics, h, in the range from 0 to 60. As indicated in the fig-ure, the frequencies (cycle per year) are determined by h/40, and the corresponding periods are given by 40/h (years). Pre-senting the spectrum in terms of harmonics instead of periods proves to be convenient because it allows us to interpret the spectral features more readily.
In the spectrum of Fig. 1a for the equator, as expected, large amplitude signatures are apparent that describe the QBO at altitudes above 15 km. The dominant period is about 28.2 months, and the periods of 24 and 30 months are also identified. Of special interest for the present analysis is the sharp spectral feature at h=40, which represents the 12-month annual oscillation (AO). Also apparent is a spectral line at h=32 that peaks at about 26 km altitude. Removed by 8 wave numbers from h=40, indicated with solid arrow, this is the signature of a 5-year modulation of the symmetric AO. Such a side lobe can be generated by non-linear processes that multiply in effect the dominant anti-symmetric AO with an anti-symmetric 5-year oscillation (O5). With simplified complex notation, the product between AO, Aexp[iωat], and
Fig. 1. Sample A (defined in Fig. 2b) of R-1 zonal wind data. Zonal-mean zonal winds are analyzed. The data were selected for a limited
time span of 40 years (i.e., 7 to 47 data years). (a) The amplitude spectrum is obtained from Fourier analysis and shows the hemispherically symmetric component at 0 degrees latitude (L=0), virtually identical at 5 degrees. Plotted versus Fourier harmonics, h, the corresponding frequencies for the 40-year time span analyzed are given by h/40 in cycles per year (cpy), and the periods by 40/h (years). [With contour intervals of 0.3 m/s, the lowest 4 levels are suppressed to eliminate clutter.] At h=40 is the signature of the 12-month annual oscillation (AO), h=20 and 16 represent the 24- and 30-month QBO signatures, and the dominant QBO period of about 28.2 month appears at h=17. Displaced by h=8 from h=40, at h=32, is the signature of the 5-year modulation of the AO, as indicated with solid arrow and discussed in the main text. (b) Spectrum of hemispherically anti-symmetric component at 20 degrees latitude (L=20) reveals the weak 5-year signature with small contour intervals of 0.05 m/s. (c) Synthesized winds at 26 km (A=26) employing the symmetric spectral features at h=40, 32. The synthesis represents the 40-year average; thus the patterns repeat exactly in 5-year intervals over the entire time span (7 to 47 years) of the analysis.
O5, Oexp[iωot], namely generates the side lobes with
fre-quencies ωa+ωo, ωa−ωo, and the longer one of the
corre-sponding two periods is apparent in the spectrum.
Evidence for the involved 5-year oscillation itself is shown in Fig. 1b, where we present the spectrum of the anti-symmetric component at 20 degrees latitude (this component vanishes at the equator). At wave number h=8 is the signature of the 5-year oscillation, and the dominant 12-month AO ap-pears at h=40. The 5-year feature is weak, less than 0.5 m/s,
but the anti-symmetric AO at 20 degrees latitude is relatively strong (about 12 m/s); the non-linear interaction between the two thus could produce the symmetric side lobe at h=32 in Fig. 1a. The dominant symmetric QBO at h=17 in Fig. 1a ac-counts for the anti-symmetric side lobes at h=23 (i.e., 40–17) and 57 (i.e., 40+17), identified with dashed arrows in Fig. 1b, which produce a modulation of the AO with the period of 28.2 months.
40 H. G. Mayr et al.: Equatorial annual oscillation with QBO-driven 5-year modulation
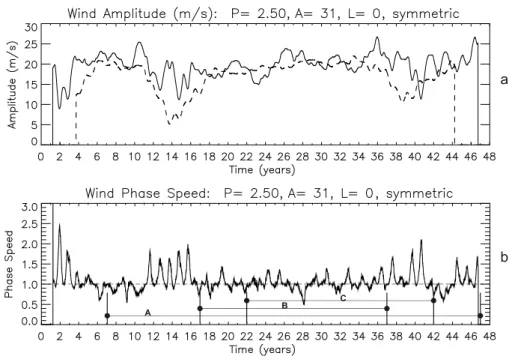
Fig. 2. (a) Amplitude of 30-month (2.5-year) symmetric QBO at 31 km and 0 degrees latitude, computed from a moving window displaced
by one day. Solid line for the first harmonic with 30-month window; dashed line for the third harmonic with 90-month window. As expected, the 3rd harmonic amplitudes tend to be smaller. (b) Effective “phase speed” for the moving 30-month window normalized to one as discussed in the text. Deviations from one are a measure of the variability for the oscillation period. It shows that the QBO is highly variable during the first 5 years, then again between 12 and 16 years, and again after 37 years. The most stable time interval is between about 17 and 37 years, labeled B, and it is discussed in Fig. 3.
To show the symmetric 5-year modulation of the AO, we present in Fig. 1c the latitudinal variations at 26 km altitude obtained from a synthesis of the spectral features h=40 and 32 that are prominent in Fig. 1a. Around the equator, the wind amplitudes vary over a period of 5 years by about 5 m/s. At higher latitudes, the winds are much larger, but the 5-year modulation is negligible when compared with the amplitude differences near the equator. Our analysis thus shows that the synthesized 5-year modulation of the symmetric AO in the zonal winds is confined to low latitudes.
It has been shown with a modeling study (Mayr et al., 2000) that an anti-symmetric 5-year oscillation is generated by a 30-month QBO that interacts through wave filtering with the dominant anti-symmetric AO. In this mechanism, the waves propagating up through the nodes of the QBO are less attenuated and therefore are more effective in amplify-ing the AO. Since the phase of the AO completely reverses in time intervals of 30 months between the QBO nodes, the corresponding wave filtering effects produce amplifications in opposite directions to generate the 5-year oscillation. This requires that the QBO nodes are aligned with the opposite phases of the AO, which is assured considering that the QBO in the stratosphere slowly propagates down with a velocity of about 1.2 km/months to cover the entire 12-month cycle within an altitude range of 10 km. The results in Fig. 1a sup-port a QBO connection to the 5-year oscillation but not
con-vincingly. While the QBO in the spectrum has a 30-month component, its dominant period is 28.2 months.
In search of a time span that may contain a predominant 30-month QBO, we analyzed the entire 48-years of R-1 data. For the equator at 31 km altitude, a running window of 30 months is applied, shifted by one day, to compute the ampli-tude of the first harmonic. The resulting ampliampli-tudes for the period of 30 months are shown with solid line in Fig. 2a. The values are around 20 m/s but are variable to indicate in part that the QBO is not phase locked. Further evidence of this variability is apparent from the result in dashed line, which was obtained from a running window of 90 months, with the 3rd harmonic applied to extract the 30-month QBO. In this case, the QBO was phase locked for 3 cycles, and the ampli-tudes are therefore reduced in general and in particular dur-ing certain time spans (e.g., between 10 and 17 data years).
Another measure of variability is presented in Fig. 2b, where we present the so-called “phase speed” for a 30-month moving window. If the oscillation were perfectly phase locked, its phase would change by a constant value as the window is moved forward in time from day to day. The re-sulting gradient, equivalent to a “phase speed”, is normalized to a value of one for the 30-month period. From Fig. 2b it is apparent that there are certain time spans in the data set where the “phase speed” deviates significantly from the norm. This is true for the initial few years, which are not
included in the Data Sample A of Fig. 1. The variability is also large for the years between 10 and 17. But Fig. 2b shows that there is a time interval between about 17 and 37 years (identified with B) where the “phase speed” varies relatively little around one, thus indicating that the 30-month period-icity is closer to being phase locked. This is also consistent with the amplitudes in Fig. 2a, which are less variable during these years.
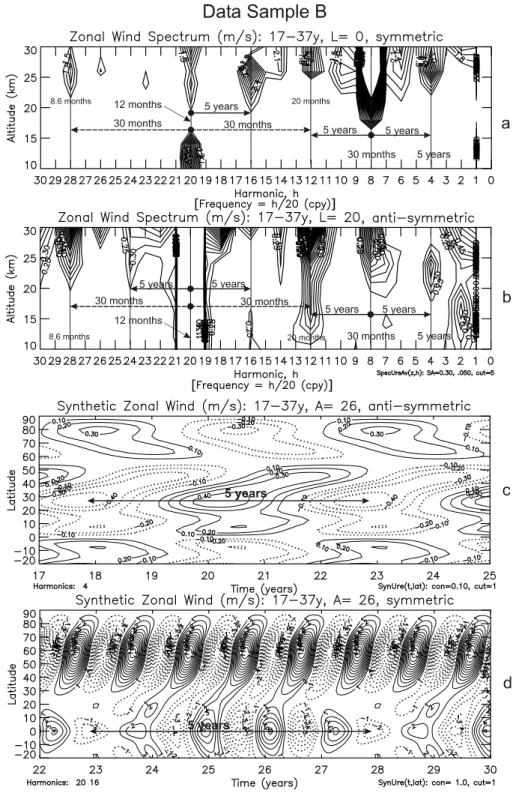
Having thus identified a data stretch in which the 30-month QBO is expected to be more coherent and stable, we present with Fig. 3 an analysis of the Data Sample B for com-parison with Fig. 1. This specifically selected and more re-stricted time span covers only 20 years instead of 40. As seen from Fig. 3a, the symmetric 30-month signature now dominates the QBO, in contrast to its signature in Fig. 1a that is relatively weak. Commensurate with that, the signa-tures of the 5-year oscillation are now also much stronger, and more ubiquitous, as indicated with solid line arrows. The 5-year side lobe at altitudes around 25 km, which describes the modulation of the symmetric AO at h=16 (removed from h=20 by 4 wave numbers), is now much stronger than the corresponding one at h=32 in Fig. 1a. The anti-symmetric 5-year oscillation at h=4 in Fig. 3b, believed to be the cause for the symmetric modulation, is also more pronounced, and it peaks near 25 km altitude. The analysis of the R-1 data presented in Figs. 3a and b thus provides considerable fur-ther evidence for the reality of the 5-year oscillation and its connection to the 30-month QBO.
As identified, the spectra of Fig. 3 show a number of other signatures of the 5-year oscillation. In Fig. 3b, the weak anti-symmetric QBO at h=8 and the anti-symmetric 5-year oscillation at h=4 could generate the symmetric features at h=4 and 12 in Fig. 3a, which describe the 5-year modula-tion of the dominant symmetric QBO; and the side lobes at h=4 and 12 in Fig. 3b produce the modulation of the anti-symmetric QBO. The anti-symmetric 5-year oscillation at h=4 in Fig. 3a could generate in Fig. 3b the side lobes at h=16 and 24 that produce a corresponding modulation of the anti-symmetric AO (h=20). In Figs. 3a and b, the anti-symmetric and anti-symmetric features at h=12 (20 months) and h=28 (8.6 months) are most likely produced by the interactions between the 30-month QBO and the 12-month AO, as indicated with dashed arrows. Most of the spectral features in Fig. 3 appear in the model prediction for the 30-month QBO that generates the 5-year oscillation (Mayr et al., 2000).
The predominance of the 30-month QBO in the above data sample is consistent with the results obtained by Tung and Yang (1994), who analyzed ozone measurements for the years from 1978 to 1991 (20 to 33 data years in our notation). As shown in Fig. 3 of their paper, the 30-month QBO domi-nates at low latitudes. Away from the equator, pronounced spectral features are identified with periods of 8.6 and 20 months, which correspond, respectively, to the lines at h=28 and 12 in Figs. 3a and b. The spectra obtained by Tung and Yang also reveal a pronounced 60-month (5-year) signature
outside the tropics.
Since the anti-symmetric 5-year oscillation is at the core of the data study presented here, we show in Fig. 3c, for 26 km altitude, a synthesis of the harmonic h=4 plot-ted versus latitude and time. With opposite phase in the two hemispheres, the magnitude of the 5-year oscillation is small, about 0.5 m/s, but it could interact with the large anti-symmetric AO to produce the symmetric modulation in Fig. 3a. This 5-year modulation of the AO is shown in Fig. 3d. Plotted versus latitude and time, we present a syn-thesis of the harmonics h=20 and 16. As in Fig. 1c for Data Sample A, the 5-year modulation of the AO is confined to latitudes around the equator. And the modulated oscillations in Fig. 3d are in phase with those shown in Fig. 1c.
3.2 CPC temperature variations
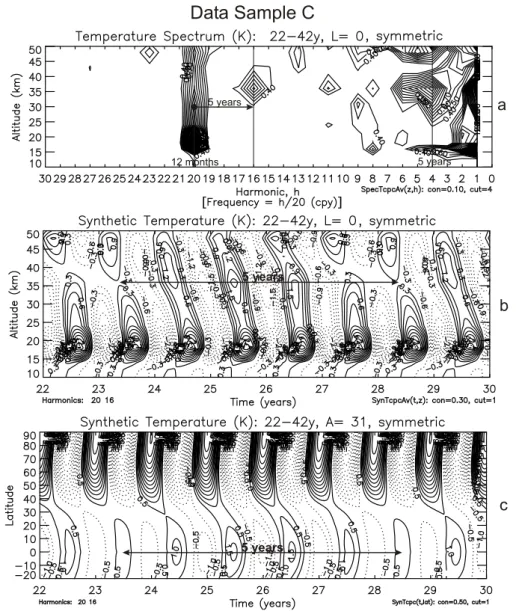
In contrast to the zonal winds from the R-1 data, which ex-tend only to altitudes of about 31 km, the CPC temperatures cover the entire stratosphere and go up to about 55 km. Since the latter data set includes only the years between 21 and 48, we have chosen the Sample C identified in Fig. 2b. Covering a time span of 20 years, as in Fig. 3, the last few years of data are eliminated where the QBO is more variable.
Shown in Fig. 4a is the symmetric amplitude spectrum for the temperature at 0 degrees latitude, extending from 10 to 50 km altitude. As in Fig. 3a, a pronounced signature is ev-ident at h=16, which causes the AO at h=20 to be modu-lated by the period of 5 years. (There is also a symmetric 5-year signature at h=4.) In Fig. 4b we present a synthesis for the harmonics h=20 and 16, which produces the altitude variations (10 to 50 km) for the 5-year modulated symmetric AO at 0 degrees latitude. The oscillation propagates down with slow phase progression (about 4 km/month), which is characteristic of wave driven oscillations around the equa-tor. (Synthesized height variations for the hemispherically anti-symmetric AO near the equator (not presented) exhibit virtually no time progression with altitude, due to the lack of effective wave forcing presumably.) The modulation is largest at 35 km where the AO temperature amplitude varies by almost 2 K over a period of 5 years. The latitudinal vari-ations of the synthesized AO for h=20 and 16 are shown in Fig. 4c at 31 km. At this altitude, the magnitude of the mod-ulation is smaller than at 35 km, but it is still about 1 K be-tween minimum and maximum, and it is essentially in phase with the wind oscillations in Figs. 1c and 3d. As is the case for the symmetric zonal winds, the magnitude of the AO tem-perature amplitude increases drastically towards higher lati-tudes. But unlike the zonal wind oscillation, the symmetric AO temperature exhibits a large 5-year modulation at higher latitudes. The difference between minimum and maximum amplitudes is almost a factor of two larger at the poles than at the equator.
42 H. G. Mayr et al.: Equatorial annual oscillation with QBO-driven 5-year modulation
Fig. 3. Sample B (defined in Fig. 2b) of R-1 zonal wind data. Analogous to Fig. 1 but for a shorter time span of 20 years. Compared with
Fig. 1, the harmonics, h, associated with particular periods are half as large (e.g., h=20 for 12-month AO). (a) (b) Spectra show pronounced signatures of AO, 30-month QBO, and 5-year oscillation. Virtually every signature is identified to indicate that we have a reasonably good understanding of how the spectral features are generated. Compared to Fig. 1, the 5-year side lobe at h=16 (a) is 50% larger due to the stronger 30-month QBO. (c) Synthesized 5-year anti-symmetric oscillation for h=4 shows small wind velocities at 26 km altitude; but its non-linear interaction with the strong anti-symmetric AO (h=20) could produce the symmetric side lobe in Fig. 3a. (d) Synthesis describes the latitudinal variations of the modulated symmetric AO at 26 km, essentially in phase with the results shown in Fig. 1c.
Fig. 4. Sample C (defined in Fig. 2b) of CPC temperature data. (a) Symmetric temperature spectrum for 0 degrees latitude and from 10 to
50 km altitude show the AO at h=20 and the side lobe at h=16 to indicate a pronounced 5-year modulation that peaks near 35 km, analogous to the wind results in Figs. 1 and 3. (With contour intervals of 0.1 K, the lowest 3 levels are suppressed to eliminate clutter.) (b) Synthesized variations versus height show the relatively large 5-year modulation at 35 km. The oscillation slowly propagates down, presumably due the efficient hemispherically symmetric wave forcing near the equator. (a) Synthesized latitudinal temperature variations of 5-year AO at 31 km, which are almost in phase with the corresponding zonal wind modulations at 26 km shown in Figs. 1c, 3d.
4 Summary and discussion
Our analysis of the zonal-mean winds from the R-1 reanaly-sis data shows that the hemispherically symmetric 12-month annual oscillation around the equator is modulated with a pe-riodicity of 5 years (Figs. 1 and 3). A comparison between the results in these figures provides circumstantial evidence that the 5-year modulation is generated by a QBO having a period of 30 months as predicted (Mayr et al., 2000). From Figs. 1c and 3d it is apparent that the 5-year modulated sym-metric AO in the zonal winds is confined to equatorial lati-tudes, which is consistent with the effectiveness of the wave
forcing that characterizes the tropical dynamics (Lindzen and Holton, 1968) as illustrated in a recent modeling study (Mayr et al., 2005). In the corresponding temperature variations (Fig. 4c), however, the 5-year modulation does extend to high latitudes into the Polar Regions, and this is also seen in the model results. It is argued in Mayr et al. (2000) that the 30-month QBO is exceptionally well suited for synchro-nization by the SAO. In intervals of 15 months, the positive and negative phases of the QBO and SAO can coincide. The resulting synchronization would contribute to keep the QBO phase locked, which in turn would help in generating the 5-year modulation of the AO that prevails over many cycles,
44 H. G. Mayr et al.: Equatorial annual oscillation with QBO-driven 5-year modulation
evident from Figs. 1c and 3d for the 40-year and 20-year data samples analyzed. In the 40-year data sample, the in-ferred (observed) 5-year modulation prevails over 8 cycles, which requires from the 30-month QBO that it is remarkably coherent and stable.
Tung and Yang (1994) analyzed QBO ozone data for the time span from 1978 to 1991 (20 to 33 data years in our no-tation). Their analyses thus covers a subset of the time span we have chosen for the Data Sample B discussed in Fig. 3. In agreement with our analysis, Tung and Yang show with their Fig. 3 that the 30-month QBO dominates around the equator. Away from the equator, the ozone data contain pronounced signatures with periods of 8.6 and 20 months, corresponding to h=28 and 12 in our Fig. 3b, respectively. In agreement with the interpretation offered by Tung and Yang, we also believe that these spectral features are generated by the in-teraction between the 12-month AO and the 30-month QBO. Their data also reveal a pronounced 60-month signature, but it was not identified or discussed in the paper.
Based on our modeling studies and the limited results from the above analysis of R-1 and CPC data, we propose that the symmetric and anti-symmetric components of the atmo-sphere could be valuable in diagnosing and understanding different classes of solar-driven atmospheric processes. In broad terms, one may look at the atmosphere under the in-fluences from: (1) the Sun that produces seasonal variations, (2) the differences between the topographies of the two hemi-spheres, and (3) the wave interactions with the flow around the equator.
For the zonal mean, the solar influence appears essentially in the 12-month AO and 6-month SAO. The solar AO is anti-symmetric, with negative winds and positive tempera-ture variations in the Summer Hemisphere, and the oppo-site in winter; while the solar (and wave driven) SAO is mainly symmetric, with zonal winds that peak at the equa-tor. Symmetry also applies to the QBO. These basic features of the atmosphere can be reproduced qualitatively with ide-alized models that do not account for topography and the re-lated differences of planetary wave activity in the two hemi-spheres. In realistic GCMs with realistic topographies and realistic planetary waves, the AO no longer is purely anti-symmetric owing to the solar influence only. The asymmetry between the hemispheres is then reproduced with the addi-tion of the symmetric AO. The symmetric AO discussed thus becomes to a large extent the manifestation of the various in-fluences that are associated with the differences between the hemispheres. And in a similar vein, such hemispherical dif-ferences would account for the anti-symmetric components of the SAO and QBO.
In light of this interpretation, we propose that the observed symmetric 12-month annual oscillations of zonal winds and temperature variations (Figs. 1c, 3d, 4c) have two regimes. The one at low latitudes may be understood primarily in terms of the wave forcing that drives the equatorial oscilla-tions. The regime outside the tropics may be understood to
a large extent as being caused by the differences between the two hemispheres, with their different planetary wave activi-ties; and quasi-geostrophic balance between zonal winds and temperature variations should be satisfied there.
In the present paper, we concentrated on the observed hemispherically symmetric equatorial annual oscillation (EAO) and its 5-year modulation. The EAO is of interest because, like the QBO, it is apparently driven by wave-mean-flow interactions that are very effective at equatorial lati-tudes. Although not discussed specifically, the QBO is also modulated by the 5-year oscillation, as is evident from the spectral features in Fig. 3 and from the model results.
Acknowledgements. The authors are indebted to C. A. Reddy, Hy-derabad, India, and to two anonymous reviewers for Annales Geo-physicae, who stimulated the work presented here. Incisive com-ments from an anonymous reviewer contributed significantly to im-prove the present paper.
Topical Editor U.-P. Hoppe thanks two referees for their help in evaluating this paper.
References
Baldwin, M. P., Gray, L. J., Dunkerton, T. J., Hamilton, K., Haynes, P. H., Randel, W. J., Holton, J. R., Alexander, M. J., Hirota, I., Horinouchi, T., Jones, D. B. A., Kinnersley, J. S., Marquardt, C., Sato, K., and Takahashi, M.: The quasi-biennial oscillation, Rev. Geophys., 39, 179–230, 2001.
Dunkerton, T. J.: On the role of the Kelvin wave in the westerly phase of the semiannual zonal wind oscillation, J. Atmos. Sci., 36, 32–41, 1979.
Dunkerton, T. J.: A two-dimensional model of the quasi-biennial oscillation, J. Atmos. Sci., 42, 1151–1160, 1985.
Dunkerton, T. J. and Baldwin, M. P.: Modes of interannual variabil-ity in the stratosphere, Geophys. Res. Lett., 19, 49–52, 1992. Gelman, M. E., Miller, A. J., Nagatani, R. M., and Long, C. S.: Use
of UARS data in the NOAA stratospheric monitoring program, Adv. Space Res., 14(9), 21–31, 1994.
Giorgetta, M. A., Manzini, E., and Roeckner, E.: Forcing of the quasi-biennial oscillation from a broad spectrum of at-mospheric waves, Geophys. Res. Lett., 29(8), 1245–1249, doi:10.1029/2002GL014756, 2002.
Hamilton, K.: Dynamics of the stratospheric semi-annual oscilla-tion, J. Meteorol. Soc. Japan., 64, 227–244, 1986.
Hamilton, K., Wilson, R. J., Mahlman, J. D., and Umscheid, L. J.: Climatology of the SKYHI troposphere-stratosphere-mesosphere general circulation model, J. Atmos., Sci., 52, 5–43, 1995.
Hirota, I.: Observational evidence of the semiannual oscillation in the tropical middle atmosphere – A review, Pure Appl. Geophys., 118, 217–238, 1980.
Hitchman, M. H. and Leovy, C. B.: Estimation of the Kelvin wave contribution to the semiannual oscillation, J. Atmos. Sci., 45, 1462–1475, 1988.
Holton, J. R. and Lindzen, R. S.: An updated theory for the quasi-biennial cycle of the tropical stratosphere, J Atmos. Sci., 29, 1076–1080, 1972.
Kalnay, E., Kanamitsu, M., Kistler, R., et al.: THE NCEP/NCAR 40-year reanalysis project, Bull. Amer. Meteorol. Soc., 77, 437– 471, 1996.
Lindzen, R. S. and Holton, J. R.: A theory of the quasi-biennial oscillation, J. Atmos. Sci., 25, 1095–1107, 1968.
Mayr, H. G., Mengel, J. G., Reddy, C. A., Chan, K. L., and Porter, H. S.: Properties of QBO and SAO generated by gravity waves, J. Atmos. Solar Terr. Phys., 62, 1135–1154, 2000.
Mayr, H. G., Mengel, J. G., Drob, D. P., Chan, K. L., and Porter, H. S.: Modeling studies with QBO: I. Quasi decadal oscillation, J. Atmos. Solar Terr. Phys., 65, 887–899, 2003.
Mayr, H. G., Mengel, J. G., and Wolff, C. L.: Wave-driven equato-rial annual oscillation induced and modulated by the solar cycle, Geophys. Res. Lett., 32, L20811, doi:10.1029/2005GL023090, 2005.
Mengel, J. G., Mayr, H. G., Chan, K. L., Hines, C. O., Reddy, C. A., Arnold, N. F., and Porter, H. S.: Equatorial oscillations in the middle atmosphere generated by small scale gravity waves, Geophys. Res. Lett., 22 , 3027–3030, 1995.
Pawson, S. and Fiorino, M. A.: comparison of reanalysis in the trop-ical stratophere. Part 1: Thermal structure and the annual cycle, Clim. Dyn., 14, 631–644, 1998.
Plumb, R. A.: The interaction of two internal waves with the mean flow: Implications for the theory of the quasi-biennial oscillation, J. Atmos. Sci., 34, 1847–1858, 1977.
Reed, R. J.: The quasi-biennial oscillation of the atmosphere be-tween 30 and 50 km over Ascension Island, J. Atmos. Sci., 22, 331–333, 1965.
Reed, R. J. and Vlcek, C. L.: The annual temperature variation in the lower tropical stratosphere, J. Atmos. Sci., 26, 163–167, 1969.
Takahashi, M.: Simulation of the quasi-biennial oscillation in a general circulation model, Geophys. Res. Lett., 26 , 1307–1310, 1999.
Tung, K. K. and Yang, H.: Global QBO in circulation and ozone. Part I: Reexamination of observational evidence, J. Atmos. Sci., 51, 2699–2707, 1994.