HAL Id: hal-00295643
https://hal.archives-ouvertes.fr/hal-00295643
Submitted on 18 Mar 2005
HAL is a multi-disciplinary open access
archive for the deposit and dissemination of
sci-entific research documents, whether they are
pub-lished or not. The documents may come from
teaching and research institutions in France or
abroad, or from public or private research centers.
L’archive ouverte pluridisciplinaire HAL, est
destinée au dépôt et à la diffusion de documents
scientifiques de niveau recherche, publiés ou non,
émanant des établissements d’enseignement et de
recherche français ou étrangers, des laboratoires
publics ou privés.
by NCEP reanalysis data: comparison with GOME
water vapor measurements
R. Lang, M. G. Lawrence
To cite this version:
R. Lang, M. G. Lawrence. Evaluation of the hydrological cycle of MATCH driven by NCEP reanalysis
data: comparison with GOME water vapor measurements. Atmospheric Chemistry and Physics,
European Geosciences Union, 2005, 5 (4), pp.887-908. �hal-00295643�
www.atmos-chem-phys.org/acp/5/887/ SRef-ID: 1680-7324/acp/2005-5-887 European Geosciences Union
Chemistry
and Physics
Evaluation of the hydrological cycle of MATCH driven by NCEP
reanalysis data: comparison with GOME water vapor
measurements
R. Lang and M. G. Lawrence
Max-Planck Institute for Chemistry, Mainz, Germany
Received: 15 October 2004 – Published in Atmos. Chem. Phys. Discuss.: 6 December 2004 Revised: 7 March 2005 – Accepted: 8 March 2005 – Published: 18 March 2005
Abstract. This study examines two key parameters of the
hydrological cycle, water vapor (WV) and precipitation rates (PR), as modelled by the chemistry transport model MATCH (Model of Atmospheric Transport and Chemistry) driven by National Centers for Environmental Prediction (NCEP) re-analysis data (NRA). For model output evaluation we pri-marily employ WV total column data from the Global Ozone Monitoring Experiment (GOME) on ERS-2, which is the only instrument capable measuring WV on a global scale and over all surface types with a substantial data record from 1995 to the present. We find that MATCH and NRA WV and PR distributions are closely related, but that significant re-gional differences in both parameters exist in magnitude and distribution patterns when compared to the observations. We also find that WV residual patterns between model and ob-servations show remarkable similarities to residuals observed in the PR when comparing MATCH and NRA output to ob-servations comprised by the Global Precipitation Climatol-ogy Project (GPCP). We conclude that deficiencies in model parameters shared by MATCH and NRA, like in the surface evaporation rates and regional transport patterns, are likely to lead to the observed differences. Monthly average regional differences between MATCH modelled WV columns and the observations can be as large as 2 cm, based on the analysis of three years. Differences in the global mean WV values are, however, below 0.1 cm. Regional differences in the PR be-tween MATCH and GPCP can be above 0.5 cm per day and MATCH computes on average a higher PR than what has been observed. The lower water vapor content of MATCH is related to shorter model WV residence times by up to 1 day as compared to the observations. We find that MATCH has problems in modelling the WV content in regions of strong
Correspondence to: R. Lang
upward convection like, for example, along the Inter Tropical Convergence Zone, where it appears to be generally too dry as compared to the observations. We discuss possible causes for this bias and demonstrate the value of the GOME WV record for model evaluation.
1 Introduction
The accurate knowledge of the 3-D water vapor (WV) field is essential for the understanding of a variety of physical and chemical processes in the atmosphere, and is therefore one of the key parameters for the accurate modelling of climate forcing and its feedback mechanisms. WV is the strongest greenhouse gas, because it is the fourth most abundant atmo-spheric constituent, absorbing over large parts of the spec-tral region from the visible up to the infra-red, and because of its emission of thermal radiation from the far infrared to the microwave regions (Learner et al., 2000). WV plays an essential role in the direct and indirect effect of radiative forcing via its influence on aerosol optical properties and the formation of clouds and precipitation. WV is a driving parameter in reactive chemistry related to ozone and HOx. Due to its complex spectroscopic structure, the contribution of WV to the total radiative forcing budget and the vari-ous feedback processes, however, still can not be quantified accurately (Maurellis and Tennyson, 2003; Minschwander and Desseler, 2004). Detailed parameterizations of aerosol optical properties and cloud formation in general circula-tion models (GCM) and chemical transport models (CTM) are currently being developed (e.g. in the framework of the EU funded project Particles of Human Origin Extinguish-ing Natural solar radiation In Climate Systems (PHOEN-ICS), or the Global Aerosol Model interCOMparison project
(AEROCOM)), but will significantly increase the demand for accurate knowledge of the 3D-WV distribution in the near fu-ture (Metzger et al., 2002), as well as the demand for data for cross-comparison and model performance evaluation.
Comparisons of global model output to observations of the atmospheric WV distribution from both GCMs and CTMs are still in their early stages due to lack of independent and consistent observations with global coverage on longer time scales. This paper and a following companion paper will therefore address the question how well the hydrological cy-cle is represented by a CTM frequently used for modelling of tropospheric ozone and aerosol related chemistry: The Model of Atmospheric Transport and Chemistry (MATCH). MATCH is, as other CTMs, driven by basic meteorological input data, which are taken from weather center analysis and re-analyses, such as those from the National Centers for En-vironmental Prediction (NCEP) or the European Center for Medium-range Weather Forecasts (ECMWF). In contrast to other CTMs, MATCH is currently, to the best of our knowl-edge, the only CTM where the tropospheric hydrological cy-cle is calculated directly within the model. MATCH may therefore be characterized as what we call a “semi-offline” CTM. This specific formulation of the MATCH model guar-antees a consistent balance between evaporation fluxes and precipitation rates (PR), and prevents an under or overesti-mation of the atmospheric WV residence time via a too rapid or too slow conversion of nudged specific humidity in pre-cipitation.
The question posed by this paper is how well are the main parameters of the hydrological cycle represented by MATCH over longer time series in comparison to data-assimilation models like the ECMWF Reanalysis ERA-40 (ERA) and the NCEP/NCAR Reanalysis (NRA). The paper focuses on the evaluation of modelled monthly mean WV content and pre-cipitation amounts computed by MATCH driven by NRA. MATCH has been used for numerous studies of atmospheric chemistry and transport including the chemistry of tropo-spheric ozone and nonmethane hydrocarbons (Rasch et al., 1997; Mahowald et al., 1997a,b; Lawrence and Crutzen, 1998, 1999; Lawrence, 2001; Lawrence et al., 1999, 2003a; von Kuhlmann et al., 2003a,b; Bonn et al., 2004; Kunhikr-ishnan et al., 2004a,b; KunhikrKunhikr-ishnan and Lawrence, 2004c; Labrador et al., 2004a,b), and for chemical weather forecast-ing usforecast-ing NCEP reanalysis data (Lawrence et al., 2003b). Differences between model output and observations are ana-lyzed in light of the previously mentioned ongoing studies on new aerosol and cloud microphysical parameterizations used in models, which may only be successfully evaluated provid-ing a good understandprovid-ing of all other parameters and mech-anisms leading to the observed residuals. The evaluation of the modelled WV distribution requires appropriate observa-tions on a global scale, preferably from independent sources, which can also be cross-evaluated to help reveal where model discrepancies appear robust in light of measurement errors. The second main purpose of this study is to present such a
set of observations, which we will use to evaluate various configurations of MATCH as well as of the GCM ECHAM version 5 in subsequent studies.
MATCH and NRA WV distributions will be compared to independent satellite based remote sensing measurements from the Global Ozone Monitoring Experiment (GOME) on ESA’s ERS-2 satellite platform covering the whole globe. GOME WV data retrievals have recently be demonstrated to deliver good results over all surface types and in cloud-free situations (Lang et al., 2003). GOME data is not as-similated in either ERA or NRA and provides a data record starting in August 1995 until present, which makes it fa-vorable for model evaluations. The evaluated data periods cover August 1996 to 1998 and January 1996 to 1998, in-cluding the strong El Ni˜no years of 1997 and 1998. The to-tal GOME WV data record available from the GOME Water Vapor Climatology web site (http://www.mpch-mainz.mpg. de/∼saphire/gome igam/) covers the time period from July
2002 to Summer 2003. There is no other instrument with a comparable data record measuring WV on a global scale and over all surfaces types. Well known instrument suites like the TIROS Operational Vertical Sounder (TOVS) and is successors (Advanced-TOVS series; 1979 to present), or the Special Sensor Microwave Imager (SSM/I) on the Defense Meteorological Satellite Platform (DMSP) series (1987 to present) measure WV in the infrared or microwave regions and are restricted to either land or ocean surfaces (Enge-len and Stephens, 1999). New generations of instruments like the Moderate Resolution Imaging Spectroradiometer (MODIS) on the Aqua and Terra platforms (1999–present), the Medium Resolution Imaging Spectrometer (MERIS) and the SCanning Imaging Absorption spectroMeter for Atmo-spheric CartograpHY (SCIAMACHY) on ESA’s ENVISAT (2002 to present), as well as the instruments more specifi-cally dedicated to WV like the Atmospheric Infrared Sounder (AIRS; 2002 to present) on Aqua and the Infrared Atmo-spheric Sounding Interferometer (IASI) to be launched by the end of 2005 on EUMETSATs Metop series, will greatly improve our knowledge of the tropospheric 3-D WV field. However, the data record of most of these instruments is not yet long enough for valuable model evaluations. It should also be mentioned that, even though significant advances in remote sensing technology have been made in recent years and instruments like AIRS and IASI will achieve unprece-dented spatial resolution performances, in order to get the complete knowledge of the 3-D WV distribution a combina-tion of data from various sensors as well as radiosondes will still be required within the foreseeable future. This study will demonstrate the value as well as the limitations of the GOME WV data record and that of its successors (SCIAMACHY on ENVISAT and GOME-2 on the METOP series) to contribute to blended WV products for model evaluation.
From the model output comparisons to the observations we find that regional differences in WV residence time (RT) are likely due to differences in the modelled surface
evaporation rate or the regional transport patterns, which both are shared parameters between MATCH and NRA. We further conclude that a too rapid conversion of WV to pre-cipitate in MATCH, especially in instances of strong convec-tion, leads to regionally too dry model results and in turn to regionally and also globally underestimated WV residence times.
In Sect. 2 we describe the various sources used for MATCH model output evaluation starting with a detailed description of the GOME WV product (Sect. 2.1). This is the first use of the GOME WV-record for model evaluation. Satellite based WV measurements from SSM/I briefly de-scribed in Sect. 2.3 are used together with radiosonde data to demonstrate the feasibility of using GOME WV data for model evaluations over ocean and land surfaces. The me-teorological input parameters from NRA used in MATCH will be discussed in Sect. 4 for their crucial influence on the MATCH hydrological cycle and the specific implementation of the MATCH model employed here is laid out in Sect. 5. A more comprehensive and in-depth description of the data sets used here and an additional validation of GOME WV fields employing data from the NASA Water Vapor Project (NVAP) can be found in the earlier, more detailed version of the paper (Lang and Lawrence, 2004).
After having evaluated the GOME WV record over the three years period of interest in Sect. 6 we compare monthly averaged WV fields computed by MATCH for different periods with results from GOME, NVAP and NRA in Sect. 7.1. Therein, residuals between rain gauges mea-surements compiled by the Global Precipitation Climatol-ogy Project (GPCP) (Rudolf, 2001) (for a description of the GPCP data set see Sect. 3) and model as well as re-analysis fields, will be compared to derived residuals from comparisons of model WV fields with GOME measure-ments. We will focus on regions like Europe and the South-ern Asian/Indian Ocean area, which are of specific inter-est with respect to the impact of anthropogenic and non-anthropogenic aerosol load on the parameters of the hydro-logical cycle. The results will be discussed in order to dif-ferentiate between MATCH model-related effects on the ob-served residual patterns and differences caused by the in-fluence of NRA data on the model results. We will finally draw conclusions which will provide a basis for following-up MATCH model sensitivity studies using different sets of reanalysis data and different assumptions for the basic pa-rameters.
2 Water vapor measurements
In the following we briefly describe the most important as-pect for the data sets employed for model output evaluation. More details on the instruments and the specific data sets used can be found in the provided references and in Lang and Lawrence (2004).
2.1 GOME
The Global Ozone Monitoring Experiment (GOME) spec-trometer on the European Space Agency’s ERS-2 satel-lite (ESA, 1995; Burrows et al., 1999) measures backscat-tered solar radiation continuously between between 240 and 790 nm with a spectral resolution of on average 0.22 nm in the visible and near infrared regions. The instrument mea-sures on a spatial resolution of 40 by 320 km at three dif-ferent observation angles, west, nadir and east scanning, re-sulting in a total swath width of 960 km. ERS-2 crosses the equator at about 10:30 local time. Measurements presented here make use of the 580 nm absorption band covered by 185 detector pixels between 560 and 600 nm. This spectral re-gion also contains additional broad-band absorption features of the O3 Chappuis absorption band and a strong absorp-tion by (O2)2(Lang et al., 2002; Lang and Lawrence, 2004). The forward model employed is the Spectral Structure Pa-rameterization (SSP) model (Maurellis et al., 2000a; Lang et al., 2003) including direct-surface and single-scattering path contribution. SSP already demonstrated its capability to derive total water vapor column (WVC) values over all sur-face types in cloud-free situation with an accuracy of 0.3 cm for moderate aerosol-impact scenarios based on more than 300 representative GOME retrievals and 0.5 cm in aerosol rich environments (Lang et al., 2003, see also Sect. 6). So far, WVC from the GOME instrument has been derived for specific case studies only (No¨el et al., 1999; No¨el et al., 2002; Maurellis et al., 2000b; Casadio et al., 2000; Wagner et al., 2003; Lang et al., 2002, 2003), which have not yet demon-strated their potential for transport model evaluation over longer time series. Apart from providing WVC over all sur-face types and in cloud-free situations, GOME WVC are an independent measurement validation from water vapor fields delivered by the NCEP or ECMWF reanalysis set, which are frequently used for data assimilation or evaluation in CTMs. In contrast, SSM/I and (A)TOVS WVC are routinely assim-ilated in the mentioned reanalysis sets. The coarse spatial resolution is one of the major disadvantages of the GOME data set, resulting in a significant amount of ground pixels identified as being affected by clouds and therefore having to be removed from the analysis. However, with its data record of now more than nine years, the instrument data set is well suited for the evaluation of model-parameters from transport models or even from general circulation model out-put, where usually monthly averaged quantities of more than six to seven years are required for meaningful climatological comparisons with measured data.
2.2 GOME cloud mask
The quality of the detection of clouds within the observed slant path is a crucial criterion for the quality of tropospheric retrievals from instruments measuring in the visible and in-frared region. Clouds may alter the retrieved total column
results in two ways: either by blocking the light from trav-elling through the lower regions of the atmosphere leading, in case of WV, to a reduced total column retrieval, or by in-creasing the path length due to multiple scattering inside or at the cloud edges, which may in contrast lead to an increased column retrieval depending on cloud height and geometry. The accurate detection of clouds within the line-of-sight of the instrument is therefore of crucial importance for the ac-curacy of the retrieved total column values. The standard retrieval of cloud top pressures (CTP) from the GOME in-strument employs the detected optical thickness of molecular oxygen or its collision complex (O2)2. Here we make use of the (O2)2absorption feature with a maximum around 577 nm (Naus and Ubachs, 1999). The retrieved CTP is then used to label a measurement being affected by clouds in case the re-trieved value is below a certain limit. The choice of this limit is, however, somewhat arbitrary. From previous studies it is known that pixels with cloud cover of less than 15% do not affect the total column values more than other identified sys-tematic measurement biases do (Lang et al., 2003). CTP val-ues from the (O2)2retrieval are therefore correlated to cloud fraction values from the Fast Retrieval Scheme for Cloud from the Oxygen A-band (FRESCO) (Koelemeijer et al., 2001) and for a representative set of GOME retrievals (Lang and Lawrence, 2004). From the correlation of both parame-ters we reveal a CTP derived limit of 500 m above the ground corresponding to pixels with on average less than 15% cloud cover. It has to be noted that the removal of retrievals with cloud cover fractions above 15% significantly reduces the statistics with respect to the calculation of monthly mean val-ues especially in regions with high cloud coverage like, for example, the tropics (see Sect. 6). For details on the cloud detection scheme and comparisons to FRESCO results we refer the reader to Lang and Lawrence (2004).
2.3 SSM/I
The Special Sensor Microwave/Imager (SSM/I) (Hollinger et al., 1990) has been in orbit since 1987 on various plat-forms, predominantly of the Defense Meteorological Space Programs (DMSP) F-platform series. For the purpose of this study we use data from the F-13 and F-14 platforms. The algorithm used for retrieval results presented here has been developed by Wentz (1997). Since the retrieval of WVC is sensitive to the retrieved surface brightness the retrievals are restricted to ocean surfaces only employing climatological brightness values. The rms accuracy of the modelled bright-ness temperature over the ocean is estimated to be between 0.5 and 1 K and the rms on the retrieved WVC is estimated to be 0.12 cm with an bias of 0.6 mm. From a detailed analysis of SSM/I averaging kernels and response functions, Engelen and Stephens (1999) reveal that SSM/I is especially sensitive to the lower troposphere over ocean surfaces, which is impor-tant for the quality of the total column WV product. SSM/I retrievals are not affected by clouds except those with heavy
precipitation events. For a more detailed description of the SSM/I WVC data set as used here we refer to Wentz (1997); Engelen and Stephens (1999); Lang and Lawrence (2004).
3 Precipitation measurements
The Global Precipitation Climatology Project (GPCP) pro-vides global gridded precipitation estimates from raingauge and satellite observations on a 2.5◦ by 2.5◦horizontal grid
(Huffman et al., 1997; Rudolf, 2001). The data set com-prises data from geostationary and polar-orbiting satellites over land and ocean region, as well as analysis of raingauge stations from about 7000 geolocations over land surfaces. Data is available starting from 1979 and is updated on a near real time basis. GPCP precipitation amounts have been compared to the NCEP-NCAR Climate Prediction Center Merged Analysis of Precipitation (CMAP) (Xie and Arkin, 1997) in various studies (Gruber et al., 2000; Rudolf, 2001). Differences between the two data sets can be as large as 0.65 cm per day, where GPCP shows more precipitation over high latitude oceans, and less for Indonesia and the tropical Pacific for a case study based on monthly averaged data of January 1999 (Rudolf, 2001). The agreement between both data sets for zonally averaged values is, however, much better and differences are usually below 0.1 cm in the tropics.
4 The NCEP reanalysis data sets
The NCEP reanalysis (NRA) system described in detail by Kalnay et al. (1996) employs the NCEP global spectral model with 28 sigma vertical levels and a horizontal trian-gular truncation of 62 nodes, which relates to about 200 km. A 3-dimensional variational (3-D-Var) scheme for assimila-tion of observaassimila-tional data is employed in spectral space us-ing the 6-h forecast results of the model as the initial guess values. This also means that in regions with little data for ’adjustment’ the analysis is dominated by the model charac-teristics, such as convective parameterization (as discussed in the following section). NRA uses data from upper air raw-insonde observations of temperature, horizontal wind, and specific humidity, from TOVS vertical temperature sound-ings over ocean except between 20 north and 20 south due to rain contamination, and TOVS temperature soundings over land above 100 hPa (for details on the individual data set see Kistler et al., 2001). For the focus period of this paper starting 1995, all of the named observation sources had been available.
A large set of output parameters are delivered by the re-analysis, a good fraction of which has been calculated online (model predicted) and have not been based on observational data directly and are labelled “C” variables (here we adapt the notation by Kistler et al., 2001). Others rely to a sig-nificant portion on the initial guess forecast values and are
labelled with “B”. Those which are dominated by the ob-servations are labelled “A”. “A” variables are, for example, upper air temperature and wind fields, whereas all moisture variables and those near the surface are usually labelled “B”. Evaporation and precipitation are “C” variables. Moisture is a generally poorly measured variable in comparison to winds and temperature and is therefore a prototypical “B” variable. To the best of our knowledge little has been done so far to evaluate the water vapor fields of reanalysis model output with independent sources. This may be partly due to the lack of WV measurements on global scale which are not already assimilated in the NRA or ERA model. Kistler et al. (2001) report that a comparison of relative humidity between NRA and ERA shows qualitatively good agreement with, however, systematic differences in relative humidity of the order of 10%. These are large differences when compared to the in-terannual variability.
For the parameterization of moist convection NRA uses a number of significantly different parameterization than ap-plied in MATCH (see following section).
5 MATCH
The Model of Atmospheric Transport and Chemistry (MATCH) is an “semi-offline” model, where the most basic meteorological parameters, apart from those of the hydrolog-ical cycle, come from weather center analysis or reanalysis data. The model has been described in detail by Rasch et al. (1997); Mahowald et al. (1997a,b); Lawrence et al. (1999). Here we use temperature, pressure, horizontal winds, sur-face wind stresses, latent and sensible heat flux from NRA, described before, for model calculations of the months Jan-uary and August between 1996 and 1998. The runs are per-formed at a horizontal resolution of T63 (96 by 192 latitude-longitude grid) corresponding to the resolution of the NRA input fields provided by NCAR. The terrain following 28 ver-tical sigma layers employed by NRA have been adopted. The meteorological data is read in every 6 h and is linearly inter-polated to model time steps in between. The model includes representations of resolved scale transport, convective trans-port, boundary layer transtrans-port, and scavenging and deposi-tion of soluble gases (Lawrence, 1996; Lawrence et al., 1999; von Kuhlmann et al., 2003a). In contrast to other CTMs, MATCH has the capability of simulating online all cloud pro-cesses such as cloud water and ice content, cloud fraction, fraction of water converted to rain and snow as well as evap-oration of hydrometeors. Using the evapevap-oration at the surface from NRA, MATCH then calculates the full tropospheric hy-drological cycle online. In diagnosed mode, the model runs approximately 4 times faster than the Commmunity Climate Model (CCM) of NCAR (Rasch et al., 1997).
For resolved transport of cloud water the model uses the flux-form semi-Lagrangian scheme called SPITFIRE (Rasch and Lawrence, 1998) with a correction for the
surface-pressure mismatch between interpolated input and model data (for details, see J¨ockel et al., 2001; von Kuhlmann et al., 2003a). For the parameterization of moist convection MATCH uses two schemes successively. First, the deep pen-etrative convection scheme by Zhang and McFarlane (1995) is applied, reducing convective available potential energy (CAPE) within the total column from the surface to the up-per troposphere. Then, a local convective adjustment scheme by Hack (1994) is used to remove all remaining instabili-ties, representing shallow convection and mid-level convec-tion not originating in the boundary layer. The sensitivity of MATCH to the NRA input data and the convection parame-terization employed is described in Mahowald et al. (1997a, b).
The parameterization of cloud microphysics in MATCH follows the parameterization developed by Rasch and Kristj´ansson (1998). The cloud fraction parameterization depends on relative humidity, vertical motion, static stabil-ity, and convective properties and is based on the work by Slingo (1987). The convective cloud fraction is proportional to the rate at which mass is detrained from the parameter-ized convective updrafts above 500 mb, and to the convec-tive mass flux for the updraft core cloud fractions. Clouds are permitted in all tropospheric layers. The total mass of condensate within each gridbox is predicted for both liquid and ice clouds and the conversion from condensate to pre-cipitation uses a bulk microphysics model. Prepre-cipitation val-ues are then in turn used to drive wet scavenging of soluble gases. The scavenging parameterization has been developed and tested in Lawrence and Crutzen (1998); Lawrence et al. (1999); Crutzen and Lawrence (2000).
A detailed study of the distribution of MATCH modelled WV with respect to the output of other GCMs or CTMs, and the distribution of precipitation and WV with respect to mea-surements using meteorological reanalysis input fields has not previously been carried out.
Here, in addition to comparing the MATCH WV with ob-servations, we also compare it directly with the WV from the NRA (which is only used to initialize the simulations, but is not read in afterwards). There are significant similarities and differences between the MATCH and the NRA model. First, the source of WV to the troposphere is the same, since MATCH uses the evapotranspiration rates (converted from latent heat fluxes) directly from NRA. Both models include parameterizations for the main sub-gridscale physical pro-cesses. The two which are most important for the hydro-logical cycle are the large-scale cloud microphysics and the deep convection. The Rasch and Kristj´ansson (1998) 4-phase bulk microphysics scheme used in MATCH for the large-scale cloud microphysics is considerably more complex than the supersaturation approach with Kessler-based evaporation of precipitation used in NRA. On the other hand the Zhang and McFarlane (1995) scheme used for deep convection in MATCH is based on the same basic principles as the Pan and Wu (1994) scheme used in NRA (both being a bulk
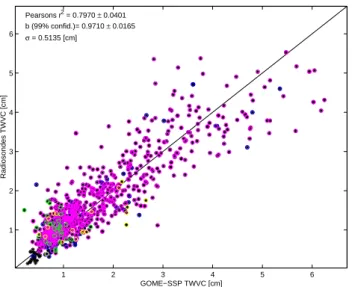
1 2 3 4 5 6 1 2 3 4 5 6 Pearsons r2 = 0.7970 ± 0.0401 b (99% confid.)= 0.9710 ± 0.0165 σ = 0.5135 [cm] GOME−SSP TWVC [cm] Radiosondes TWVC [cm]
Fig. 1. Comparison between GOME WVC and radiosonde
mea-surements from the ECMWF operational network for January and August 1995 to 2000. Values are correlated spatially and within 3 h in time. Pink and blue circles indicate Asian and Indonesian son-des, green circles indicate sondes from Europe, and yellow circles denote North American sonde values.
re-formulation of the Arakawa and Schubert (1974) plume ensemble quasi- equilibrium scheme, with a closure on the cloud work function, which can be thought of as the con-vective available potential energy (CAPE) applicable to an ensemble of entraining plumes). However, there are several differences in the assumptions used in the two convection schemes, e.g., regarding the distribution of the base mass flux as a function of the plume entrainment rate. Thus, differences which we note below could be due to either the cloud micro-physics or deep convection schemes (or as well due to the advective or vertical diffusive transport), which will need to be investigated in more detail on an individual basis in future studies.
6 GOME WV fields
Figure 1 shows the comparison between GOME WVC and radiosonde data from the operational weather center sonde network provided by ECMWF. The scatter plots compares data from August and January between 1996 and 2000. The data is taken from launch sites located within the area cov-ered by one GOME ground pixel and with a temporal corre-lation of less than three hours and cloud covers below 15%. Correlations have predominantly been found over Indonesia and Europe with some additional stations over North Amer-ica. The significant scatter of 0.4 cm is likely related to the problem in correlating a single sonde measurement to the area of 40 by 320 km covered by the GOME instrument. In addition, the quality of the sonde data can vary significantly
(a)
(b) Fig. 2. Comparison between GOME WVC and those from the
Special Sensor Microwave Imager on the Defense Meteorological Satellite Platforms F13 and F14 measurements for January (upper panel) and August (lower panel) 1996 to 1998. Values are correlated spatially and in time within 4 h until 1997 and 2 h after 1997.
depending on the type of instruments used, on-site monitor-ing of measurements and the post measurement quality check of the data. Here, only data with more than four measure-ments per launch have been used. Apart from removing data with physically unrealistic numbers, no additional quality as-surance techniques have been applied, which may cause a number of measurements to deviate significantly from the GOME measurements. However, quality assurance of ra-diosonde data is a very complex and difficult task required for climate change monitoring (Lanzante et al., 2003) but of less importance for relative short time scale comparisons. The bias of the correlation is found to be below 2.5% with a correlation of 70%, both supporting the high credibility of GOME data over land surfaces.
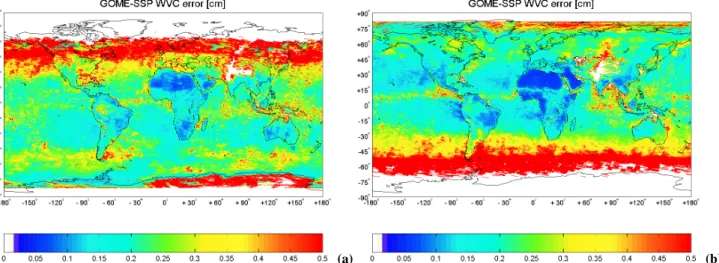
(a) (b) Fig. 3. GOME-SSP WVC total retrieval error for the monthly mean retrieved values of January (upper panel) and August (lower panel)
1996–1998. Missing values due to low statistics (high cloud frequency) or operational instrument calibrations (above Pakistan) are masked out and indicated in white. The relative error varies between below 5% over the subsidence region, 25% between 50 to 60 (30 to 40) degree and 50% and more above 70 (60) degree for hemispheric summer (winter).
Over ocean surfaces we compare GOME WVC data with spatially correlated gridded (0.5 by 0.5◦) SSM/I data from
SSM/I descending orbits of the F13 and F14 DMSP satel-lite platforms (see Sect. 2.3). Figure 2 shows the correla-tion for August 1996 to 2000 and January 1996 to 2000 (ex-cluding January 1999 because of an instrumental problem of GOME affecting the employed spectral region of the WV absorption). The standard deviation is smaller than 0.5 cm, which we attribute to the significant differences between the instruments’ spatial resolution (25 km resolution for SSM/I as opposed to 40 by 320 km resolution for GOME) and the reduced sensitivity over ocean surfaces for the GOME instru-ment as compared to land surfaces. The bias of this compar-ison is smaller than 1%. This demonstrates the capability of GOME to achieve good accuracy in WVC also over ocean surfaces, however, associated with an averaged increase in the retrieval error due to the low reflectivity of the ocean sur-face and therefore an increased contribution of photons scat-tering above the surface. GOME-SSP also exhibits a number of dry spots along the ITCZ and the Pacific warm pool re-gions, which are not visible in the SSM/I product, most of which can be attributed to unsatisfactory removal of clouds and low measurement statistics as they are also visible in the three years averaged comparisons with SSM/I data. For addi-tional comparisons of GOME-SSP WVC with data monthly mean values from the NASA Water Vapor Project we refer the reader to Lang and Lawrence (2004).
Figure 3 shows the global distribution of the monthly mean retrieval error for August and January 1996 to 1998 as pro-vided by the distribution matrix of the individual retrievals and consisting of an estimate of the model-parameter error, the forward-model error and the retrieval noise contributions (for details on the error analysis, the impact of multiple
scat-tering and aerosol loading on the retrieval, we refer to Lang et al., 2003). The forward model error contribution con-tains the impact of aerosol scattering and absorption on the retrieval for two reference maritime and rural aerosol sce-narios employed in dependence of the observed geolocation. The error values delivered by the retrieval are therefore good estimates of an upper error bound. This is due to the fact that, especially for the rural aerosol case, the employed sce-narios are more an exception than a standard. The figure shows that the error is smallest (below 0.1 cm) in the sub-sidence regions with relatively large WV content and little cloud cover, i.e., good statistics. For the strongest WV sig-nals along the ITCZ but small number of measurements the error is around 0.25 cm. The error is largest (up to 0.5 cm) at high latitudes, where the WV absorption signal is weak both due to the low WV content (nearly three orders of magnitude lower at the poles as compared to the ITCZ) and due to large solar zenith angles (SZA). Large SZA correspond to large air masses traversed by the detected photons, which in turn lead to high contributions of multiple scattering out and into the light path, which is not explicitly accounted for by the retrieval model. Therefore we generally restrict the retrieval to latitudes within 70 to 80◦of the equator. The number of measurements averaged over one month (three years) varies between 2 to 5 (6 to 15) measurements along the ITCZ and up to 15 (45) for the highest latitudes. The higher retrieval errors at high latitudes are partially compensated in the multi-year average by the better statistics in these regions due to over-lapping satellite passes. The relative error varies between below 5% along side of the ITCZ and the subsidence region, 25% between 50 to 60◦and 100% and more around 70◦and
above for the hemispheric winter. In the hemispheric sum-mer the relative error at 70 degrees is around 25 to 50%.
(a) (b)
(c) (d)
(e) (f)
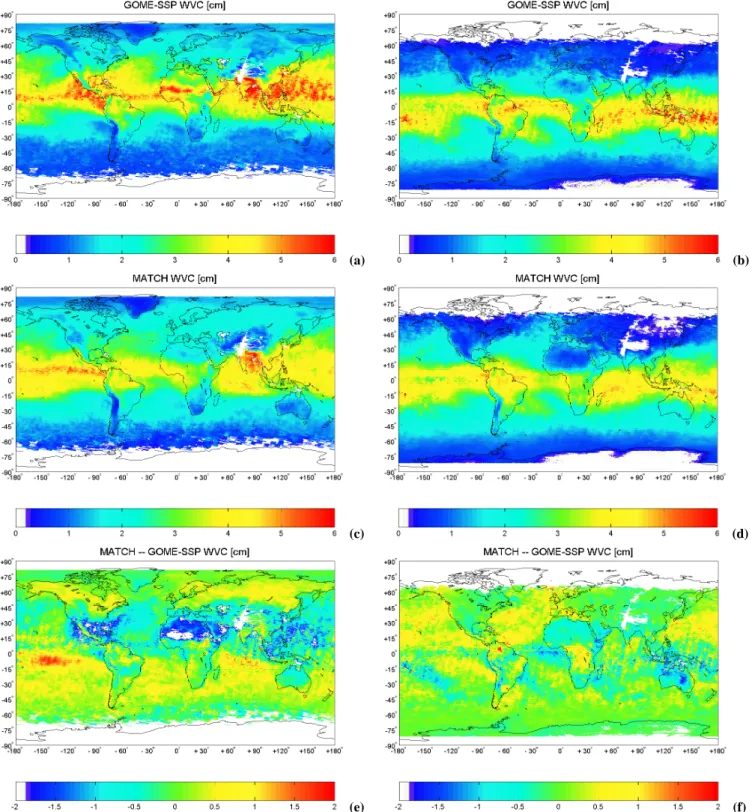
Fig. 4. Monthly averaged WVC for August (left panels) and January (right panels) 1998 from GOME (upper panels) and MATCH (middle
panels). The lower panels show the differences between the monthly mean values. The GOME retrieved cloud-mask has also been applied to MATCH.
In summary, and as has been discussed in detail in Lang and Lawrence (2004), there are four main caveats concern-ing the monthly averaged WVC from GOME as presented
here: First, there are some unusually high column values at around 15◦ north of the equator over the African continent for August 1998, which might be related to the impact of
(a) (b)
(c) (d)
(e) (f)
Fig. 5. Same as Fig. 4 but for three years averaged WVC for August (left panel) and January (right panels) 1996 to 1998.
Saharan dust and an increased contribution of multiple scat-tering, which is not accounted for by the retrieval method. Second, the surface albedo retrieval around the 590 nm re-trieval window is a matter of concern, because the rere-trieval assumes a linear behavior of the albedo over the spectral
region applied, which is usually not the case for predomi-nantly green surfaces in, for example, tropical rainforest re-gions of the spectrum. This may lead to an underestimation of the actual WVC in these areas. Third, GOME exhibits a dry bias over oceanic regions at mid to high latitude and for
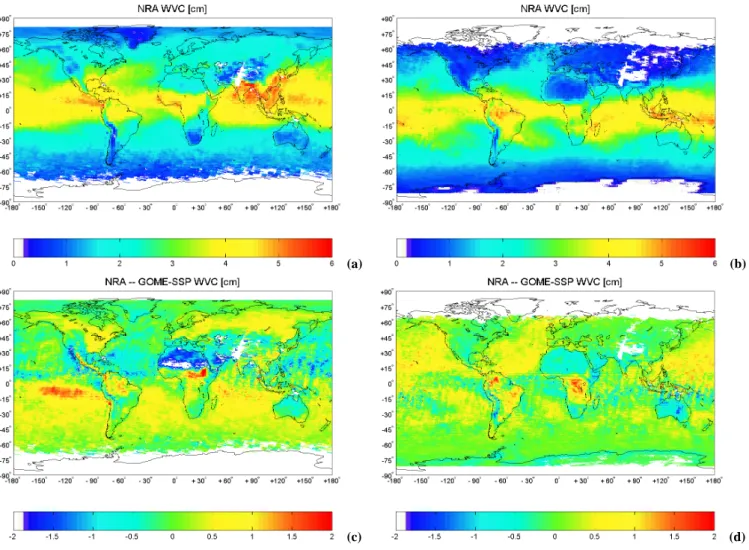
(a) (b)
(c) (d)
Fig. 6. Same as Fig. 5 but for WVC from NRA. The GOME retrieved cloud-mask has also been applied to NRA.
hemispheric winter when compared to SSM/I data. This bias may be due to the impact of hygroscopic aerosols (like, for example, sea salt), which grow significantly under high rela-tive humidity conditions forming haze and thin cloud layers, which is not properly detected by the cloud masking scheme and may therefore lead to an underestimation of the retrieved column. This bias has also been observed in comparison with NVAP WV data. Fourth, regions of the ITCZ are pre-dominantly covered by clouds, which leads to a significantly reduced statistical basis and increased biases in the GOME data, as well as to an increased impact of residual cloud con-tamination on the retrieved WVC from GOME. Biases due to these systematic effects are found to be of the order of 0.4 to 0.5 cm and can be as much as 1 cm locally in the case of cloud contaminated ITCZ regions with high WVC (see also Lang and Lawrence, 2004).
7 Results
In this section the key results of the comparisons between modelled WV and precipitation fields and the measurements are presented, including a discussion on the implication of these results with regard to the model performance and the quality of the driving reanalysis data.
7.1 Method of comparison
Monthly averaged WVC distributions for August and Jan-uary 1996 to 1998 have been modelled employing the MATCH CTM with driving meteorological input parameters from NRA, as has been described in Sect. 4 and 5 of this paper. MATCH results have been written out at 10:30 local time to achieve maximum temporal overlap with GOME. For comparisons between model and measurements we will first compare the model results with the observations on a global scale including globally and zonally averaged comparisons and then focus on regional scales with two exemplifying re-gions, Europe and the Southern Asian/Indian Ocean region.
−80 −60 −40 −20 0 20 40 60 80 0 0.5 1 1.5 2 2.5 3 3.5 4 4.5 5 5.5 [cm] Latitude
Zonally averaged WVC August 1998
MATCH NVAP NRA GOME−SSP (a) −80 −60 −40 −20 0 20 40 60 80 0 0.5 1 1.5 2 2.5 3 3.5 4 4.5 5 5.5 [cm] Latitude
Zonally averaged WVC January 1998
MATCH NVAP NRA GOME−SSP (b) −80 −60 −40 −20 0 20 40 60 80 0 0.5 1 1.5 2 2.5 3 3.5 4 4.5 5 5.5 [cm] Latitude
Zonally averaged WVC August 1996 to 1998
MATCH NVAP NRA GOME−SSP (c) −80 −60 −40 −20 0 20 40 60 80 0 0.5 1 1.5 2 2.5 3 3.5 4 4.5 5 5.5 [cm] Latitude
Zonally averaged WVC January 1996 to 1998
MATCH NVAP NRA GOME−SSP (d) 1996 1997 1998 1.8 1.9 2 2.1 2.2 2.3 2.4 2.5 2.6 2.7 2.8 [cm] January
Globally averaged WVC August 1996 to 1998
MATCH NVAP NRA GOME−SSP (e) 1996 1997 1998 1.9 2 2.1 2.2 2.3 2.4 2.5 2.6 [cm] January
Globally averaged WVC January 1996 to 1998
MATCH NVAP NRA GOME−SSP
(f) Fig. 7. Comparisons between zonally and area-weighted globally averaged WVC from GOME-SSP, MATCH, NVAP and NRA. Zonally
averaged WVC are given for for August and January 1998 (upper panels) and averaged over August and January 1996 to 1998 (middle panels). Global mean WVC are given in the lower two panels for August and January 1996 to 1998. All quantities are derived from the WVC distributions presented in Figs. 4 to 6.
Table 1. Absolute global, hemispheric and tropical area-weighted mean values for WVC modelled by MATCH. WVC mean values for
different cloud masking are shown together with their relative differences with respect to the full mean values. Global 30◦N–90◦N 30◦S–30◦N 90◦S–30◦S
August 1996–1998 [cm] [%] [cm] [%] [cm] [%] [cm] [%]
MATCH all ground pixels 2.38 100 2.05 100 3.24 100 1.03 100
MATCH with GOME cloud mask 2.40 100.84 1.98 96.59 3.12 96.29 1.24 120.62
MATCH with common cloud mask 2.15 90.33 1.78 86.83 2.81 86.73 0.96 93.39
January 1996–1998
MATCH all ground pixels 2.16 100 0.80 100 3.15 100 1.54 100
MATCH with GOME cloud cover 2.22 102.78 0.98 122.50 3.07 97.46 1.55 100.65
MATCH with common cloud mask 1.92 88.89 0.75 93.75 2.72 86.35 1.27 82.46
Figures 4 to 7 show the monthly averaged global and zonal WVC distribution as modelled by MATCH and NRA and as measured by GOME-SSP in January and August 1998 (Figs. 4 and 7), as well as for the three years average from 1996 to 1998 for both months (Figs. 5 to 7). It is very im-portant to emphasize that for all comparisons presented here the cloud-mask derived from the GOME-SSP retrievals has also been applied to the model values, including the zonally and globally averaged results. This has consequences for the accuracy of the presented absolute values.
Applying a cloud mask reduces the calculated mean WVC values as compared to the unmasked model output in the tropics and for hemispheric summer when data up to the highest latitudes with the smallest WV content are avail-able from the satellite data. In contrast, for instances of hemispheric winter, cloud masking may lead to an even higher hemispheric mean value as compared to the unmasked means. This is because high latitudes with very low WVC (especially for hemispheric winter) see more cloud cover and are therefore masked out applying the GOME cloud mask. These two effects nearly cancel each other out for the global mean values (see Table 1).
The application of cloud-masking of model data also in-fluences the relative comparison between observation and model results because of an effect we hereafter will refer to as the “common-cloud-problem”. Table 1 denotes an “ar-tificial” moistening effect of the model results by applying the GOME cloud mask to the model output. This is because pixels with cloud contamination are usually corresponding to high WVC amounts relative to surrounding clear-sky pixels. However, ground pixels identified as cloudy by the GOME measurement do not necessarily correspond to cloudy pix-els in the model. As a consequence of applying the mea-sured GOME cloud mask to the model, this will generally lead to moister model results as compared to clear-sky sce-nario for the measurements, because the GOME cloud-mask will partly mask out model clear-sky pixel and leave cloudy model pixels (with relatively high WVC) in the analysis. The impact of the “common-cloud-problem” on the comparisons is shown by comparing the results of the third row for both
month in Table 1 with the results of row two. Row three de-notes model mean values for all pixels which are denoted as cloud-free due to both the model results and the satellite ob-servations. The differences between row two and three are of the order of 0.3 cm (10%) when compared to applying only the GOME cloud mask to the model results.
7.2 MATCH and GOME WV fields
Figures 4 to 6 show that MATCH generally models the global WV distribution quite well, from the moist ITCZ regions to the dry polar regions. MATCH also resembles the overall shape of the moist and convective regions. However, sig-nificant differences between MATCH and GOME-SSP exist on regional scales and in the magnitude of the WVC distribu-tion. MATCH is systematically lower than what has been ob-served over the Atlantic ITCZ and in the Pacific warm-pool region for both seasons (Figs. 4 and 5) and the moist areas commonly extend more to the north and to the south. The most pronounced features occur in the Western Pacific con-vergence zone. Here, MATCH significantly overestimates the southern branch of the Western Pacific split ITCZ in August and exhibits a too broad and moist feature in Jan-uary in the same region, when compared to GOME measure-ments. These features become less pronounced when com-paring to the three years averages including also the non-El Ni˜no year 1996 (Fig. 5). MATCH is generally moister than GOME-SSP over the northern hemisphere (NH) landmasses of Canada, as well as wide parts of Russia and the south-ern hemisphere (SH) oceans for August (Figs. 4 and 5). The low bias of GOME-SSP over the SH oceans as observed in the intercomparisons to SSM/I values is also visible for the MATCH comparisons. Consequently, for January, Figs. 4 and 5 show that MATCH is generally high as compared to GOME-SSP for NH oceans, whereas MATCH agrees gener-ally quite well with what has been observed by GOME over NH land masses, with dry biases for Central Africa and the Central Amazon region.
Table 2. Global and regional area-weighted mean values for the WVC distributions as presented in Figs. 4 to 7, and for the precipitation rate
(PR) comparisons presented in Figs. 8 to 12. In addition, the residence time (RT), given by the ratio of WVC over PR, is also denoted for all observed regions.
Global Europe Indian Ocean
WVC PR RT WVC PR RT WVC PR RT
August 1996–1998 [cm] [cm/day] [day] [cm] [cm/day] [day] [cm] [cm/day] [day]
MATCH 2.40 0.31 7.74 1.94 0.19 10.21 3.34 0.5 6.68 NRA 2.59 0.37 7.00 2.13 0.27 7.89 3.76 0.58 6.48 GOME-SSP/GPCP 2.51 0.26 9.65 2.35 0.15 15.67 3.51 0.42 8.36 January 1996–1998 MATCH 2.22 0.31 7.16 1.18 0.21 5.62 3.61 0.4 9.03 NRA 2.32 0.36 6.44 1.17 0.23 5.09 4.21 0.5 8.42 GOME-SSP/GPCP 2.18 0.27 8.07 1.07 0.22 4.86 3.84 0.34 11.29
7.3 NRA and GOME WV fields
The global WV distribution as given by NRA (Fig. 6) gen-erally resembles what has been modelled by MATCH. The shape of the ITCZ is quite similar to the MATCH model results for both seasons. For example, the strong southern branch of the Western Pacific split ITCZ and the high WV values over NH land masses are similar features leading to similar residual patterns for NRA and MATCH when com-pared to the GOME-SSP results. NRA ITCZ values are, however, generally higher than those computed by MATCH. Differences are evident for the Central Amazon and Western Pacific regions, where MATCH is moist over the ocean and dry over land when compared to NRA.
7.4 Global and Zonal averages in WV
MATCH is about 0.1 to 0.2 cm lower in the globally aver-aged WV content than GOME-SSP, NVAP and NRA for Au-gust and compares better (within 0.15 cm difference) to the other products for January as indicated by the lower panels of Fig. 7. The NVAP product is a blended WV data set em-ploying instruments like SSM/I and TOVS, as well as in situ data from the operational radiosonde network. For more de-tails on NVAP and comparisons with GOME measurements we would like to refer the reader to Randel et al. (1996) and Lang and Lawrence (2004). For January, the shape of the zonal distribution of all four products compares very well. However, NVAP and NRA peak higher around the ITCZ than GOME-SSP and MATCH. A different picture occurs for the August zonal mean distributions. Here, NVAP and GOME-SSP compare very well in shape and absolute quan-tities. MATCH and NRA are systematically low during the NH summer season as compared to NVAP and GOME-SSP. The shape of the zonal WV distribution of MATCH again re-sembles quite well the shape of the NRA zonally averaged values.
7.5 MATCH and GPCP precipitation fields
Figure 8 (upper panels) shows averaged daily PR as given by GPCP (cf. Sect. 3) for August (left panels) and January (right panels) 1996 to 1998. The middle panels of Fig. 8 show the corresponding model results from MATCH. MATCH mod-els the basic patterns very well, like the continuous stream of precipitation along 10◦north in August and the more distinct precipitation fields over the south western Pacific, Central South America, Africa and the Pacific warm pool. Differ-ences occur, similar to the WVC distributions, on regional scales and due to differences in the absolute values (lower panel of Fig. 8). MATCH PR are weaker along the ITCZ and more spread out in latitude leading to significant residuals of high MATCH PR north and southwards of the ITCZ (e.g., the overestimation in precipitation along the southern branch of the Western Pacific split ITCZ in August). MATCH mod-els significantly higher PR over the Central South Ameri-can and Central AfriAmeri-can land masses for January and over North America, Europe and Russia for August, as compared to what has been measured by the GPCP observations. 7.6 NRA and GPCP precipitation fields
As MATCH is driven by NRA parameters like temperature, wind fields, and surface evaporation rates, with potentially significant influences on the modelled WV and precipitation patterns, the comparisons presented in Fig. 9 give an indi-cation to which extent MATCH precipitation model output may depend on NRA input parameters. The figure compares NRA PR to those given by GPCP in a similar fashion as the comparisons presented in Fig. 8. The NRA precipitation dis-tribution is for large parts of the globe closely related to the MATCH modelled PR indicating the strong influence of the before mentioned shared parameters on the precipitation dis-tributions modelled by both products. The residual patterns of Fig. 9, however, also reveal significant regional differences to what has been modelled by MATCH. MATCH PR are generally higher over NH land masses in August and over
(a) (b)
(c) (d)
(e) (f)
Fig. 8. Global distribution of precipitation averaged over three years for August 1996 to 1998 (left panels) and January 1996 to 1998 (right
panels). We compare daily precipitation amounts as provided by GPCP (see Sect. 3; upper panels) and as modelled by MATCH (middle panels). The differences between both products are given in the lower panels.
the Central Amazon and Central African regions for January. There are considerably less differences in the precipitation residuals for NRA and MATCH over ocean surfaces.
Gen-erally the residuals of Figs. 8 and 9 differ predominantly in magnitude and less in shape and geolocation.
Figure 10 additionally provides the MATCH modelled contribution of convective to the total (large-scale plus con-vective) amount of precipitation, showing that seasonal changes in the residual patterns of Figs. 8 and 9 are fre-quently related to changes in the relative contribution of con-vective precipitation. Generally, the large model to observa-tion residuals correspond to the shift between north and south in the convective precipitation for hemispheric summer. 7.7 Regional comparisons
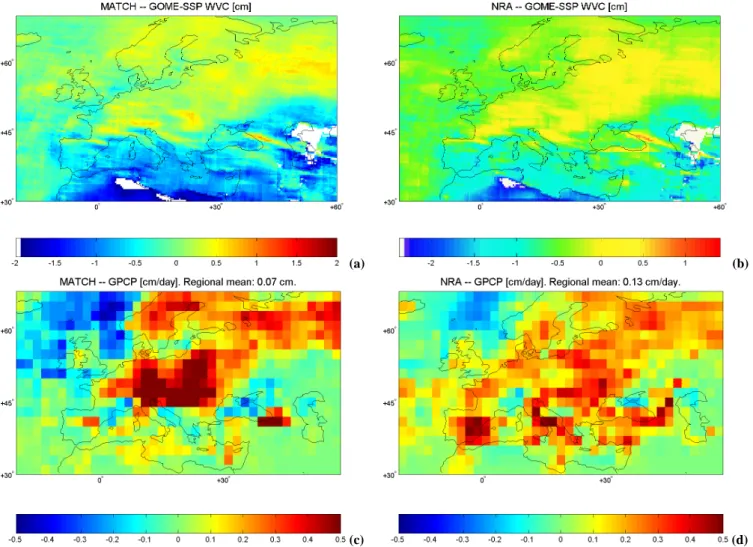
Figures 11 and 12 provide a more detailed look at regional differences between model and measurements for Europe and the Indian Ocean/Southeast Asian region. Residuals be-tween model and observations for WVC (upper panels) and PR (lower panels) distributions are given for the three-year averages of August 1996 to 1998, i.e. for the summer sea-son. MATCH and NRA show high atmospheric WV content over European land masses in August and low biases over the Mediterranean ocean and North Africa (Fig. 11). The close relation between NRA and MATCH WVC distribution, as has been observed before for the global comparisons, is evi-dent from Fig. 11. MATCH is, however, generally drier than NRA but exhibits, in turn, higher PR over Central Europe. NRA and MATCH show similar residual patterns in precipi-tation with an emphasis on regions with high elevations. The Indian Ocean/Southeast Asian region (Fig. 12) exhibits simi-lar relations between WV and precipitation residual patterns. Regions with relatively high WV content as compared to the GOME measurements, over land and south of the Equator, correspond to regions with high PR when compared to the GPCP measurements and vice versa. A detailed discussion of the observed relation between WV and precipitation pat-terns is given in the following discussion section.
7.8 Summary of comparisons
The comparisons presented here are finally summarized in Table 2 which presents the area-weighted global and regional mean values in WVC, PR and RT. The latter has been calcu-lated as the ratio between WVC and PR and serves as an use-ful measure for the modelled and observed mean conversion of WV into precipitation, as discussed further in the follow-ing section.
8 Discussion
8.1 Distribution of WV and precipitation
It is beyond the scope of this paper to analyze the detailed mechanisms behind all of the differences between MATCH and the observations, but the results presented here encour-age us to make those mechanisms subject of follow-up stud-ies. Here, we focus on the question: where are significant differences between MATCH and the observations found and
which of those are unique to the MATCH model and there-fore missing in a comparison between GOME-SSP data to NRA data?
Along the ITCZ region MATCH is significantly drier than NRA, but exhibits generally very similar patterns with re-spect to the reanalysis values in the global WV distribution, as well as in the latitudinal dependence of the zonally aver-aged values for both seasons. In addition, regional distribu-tion patterns of WV are significantly influenced by net trans-port processes (and therefore by the wind-fields delivered by NRA), due to the relatively long residence time of WV of about 8.8 days on global average (1996 to 1998) based on the observations. Differences between NRA and MATCH WV and precipitation fields can therefore be attributed to differ-ences between NRA and MATCH in the modelled produc-tion of clouds and precipitaproduc-tion, as well as the parameteriza-tion of the re-evaporaparameteriza-tion of hydrometeors. For example, an inefficient re-evaporation of hydrometeors in the modelled precipitation columns would lead to a too dry model with a decreased WV residence time because of increased precipi-tation, and vice versa.
Figures 8 and 9 confirm the strong influence of the men-tioned shared parameters (see also previous section) leading to the strong similarity in the general precipitation patterns between both models. A comparison between the residual panels of Figs. 8 and 9 (lower panels) identifies a number of regions, especially over the oceans, where NRA shows residuals in precipitation with respect to the observations, which are similar to MATCH. MATCH precipitation patterns along the ITCZ and also along NH land masses, for example Canada, the eastern part of the U.S., as well as Europe and Russia are therefore expected to be significantly influenced by NRA surface evaporation rates and wind fields. It has been pointed out by a number of studies (Kistler et al., 2001; Stendel and Arpe, 1997), that errors in the modelled evap-otranspiration rate over land (evapevap-otranspiration is a “C”-variable derived from vapor pressure, surface temperature, the net irradiation flux, and wind speed, some of which are labelled as poorly measured “B”-variables) serve as an im-portant source of model error responsible for differences be-tween modelled and observed PR over longer time scales.
In contrast, other regions can be identified, like the Cen-tral Amazon and CenCen-tral Africa, where MATCH exhibits stronger residual patterns than NRA. Those areas may be attributed as regions where specific MATCH parameteriza-tions of the hydrological cycle may significantly contribute to the observed differences. The comparisons further reveal that differences in the residuals to the observations between MATCH and NRA are often correlated with regions of dom-inant contribution of convective precipitation. For example, strong differences over Central Africa and the Central Ama-zon exist especially for SH summer correlated with the posi-tion of the ITCZ with strong convective updrafts. The differ-ences in the precipitation between MATCH and GPCP over western Canada and Siberia are also evident solely for NH
(a) (b)
(c) (d)
Fig. 9. Same as Fig. 8 but for NRA results in comparison to GPCP.
(a) (b)
Fig. 10. Averaged relative contribution of convective to the total (large-scale plus convective) amount of precipitation as modelled by
(a) (b)
(c) (d)
Fig. 11. Differences between MATCH (left panels) and NRA (right panels) modelled WVC and GOME-SSP WVC (upper panels) over
Europe and for August 1996 to 1998. The lower panels show the corresponding residuals between the modelled precipitation amounts and those given by the GPCP observational data set over the same area and for the corresponding time period.
summer, where these regions see significant contributions of convective precipitation. This points therefore again to a problem related to the parameterization of convection or the formation of convective precipitation in MATCH, like, for example, the aforementioned inefficient evaporation of falling precipitate leading to too high PR.
8.2 Correlations between WV and precipitation residuals The regional comparisons of Figs. 11 and 12 suggest a correlation between an overestimation of precipitation by MATCH and NRA with respect to GPCP observations and an overestimation in the modelled WV content when com-pared to the GOME results. We also note the close relation-ship in WV residual pattern between the NRA and MATCH model comparisons to GOME observations. These correla-tions additionally support the conclusion drawn before, that an overestimated WV input by high surface evaporation or
an regional overestimated net-influx of WV may regionally lead to too high availability of precipitable water.
In contrast, a general bias noted in the GOME-SSP data in comparison to sondes and SSM/I (too dry over land and too moist over the Mediterranean and North Africa) may also explain some of the observed differences. However, GOME-SSP comparisons with the European radiosonde net-work show only very small biases, below 3%, and compari-son with SSM/I data over the Mediterranean region confirm a higher WV content as has been modelled by MATCH and NRA over this region. The elevation signal visible in both the NRA and the MATCH WV residual patterns may also point to problems in comparing the coarse latitudinal model resolu-tion (about 1.8◦) to the relatively high latitudinal resolutions of the GOME measurements (about 0.4◦). But close rela-tions between WV and precipitation residual patterns as ex-amined, for example, above the Alpes, the Carpatians, Scan-dinavia and the Kaukasus mountains, leads us to question the
(a) (b)
(c) (d)
Fig. 12. Same as Fig. 11 but for Southern Asia and the Indian Ocean region.
models performance in regions with orographically induced convection. Additionally, other European land regions (e.g., Germany, Poland, and Russia) also show close relationships between WV and precipitation residual patterns.
The global atmospheric WV content is strongly influenced by temperature via the Clausius-Clapeyron relationship, pro-viding that the relative humidity stays approximately con-stant. Precipitation is then closely linked to the surface evap-oration rate. However, this strong link only holds for large scale averages not influenced by the local to regional trans-port patterns, the regional net incoming radiation, or dif-ferences in surface types and soil moisture content. The influence of regionally overestimated net influx of WV on the observed residuals in WVC and PR is further supported by the fact that too high WVC over European land masses for NRA and MATCH are balanced by low WVC over the Mediterranean and North Africa, in the sense that the mean WV content of NRA and MATCH comes close to what has been observed by GOME-SSP over the entire region (see
Ta-ble 2). However, the MATCH WV residence time is signif-icantly lower than what has been observed by GOME-SSP and GPCP because of the on average higher PR of MATCH when compared to the measurements. Table 2 shows that this also holds for the global mean values, for which MATCH ap-pears to model about one day shorter residence times because of the higher mean precipitation-rate values.
Figure 12 confirms the close relation on regional scales between WV and precipitation residual patterns as has been observed before for Europe, but now for the Indian Ocean/Southeast Asian ITCZ region for August 1996 to 1998. Again, MATCH PR are on average significantly higher than what has been observed. However, in this region, the differences between NRA and MATCH in mean PR are small for both August and January (cf. Table 2), but, be-cause MATCH is generally drier along the ITCZ regions, the MATCH modelled residence time is again lower when com-pared to the observations. Table 2 also shows that MATCH modelled residence time for Europe and the Indian Ocean
compare much better to what has been observed and to what has been provided by NRA in January.
We want to add here that both models, NRA and MATCH, lack a detailed cloud-microphysics scheme. This has numer-ous consequences and may partly explain observed differ-ences to observation for both data sets, for example, in re-gions with high aerosol loading as above Central Europe, In-dia, China and Indonesia. A detailed analysis of the impact of cloud microphysics on the results, however, requires signif-icantly improved observational data sets (especially with re-spect to spatial resolution), as well as detailed regional stud-ies comprising additional sets of modelled and observed opti-cal parameters (Feichter et al., 2004). This would be valuable to examine in future studies. However, in order to be able to perform a successful study of the consequences of new pa-rameterizations in cloud microphysics and its effect on mod-elling the hydrological cycle, the impact of the applied me-teorological re-analysis data sets and the employed cloud pa-rameterizations on the current model results, as has been laid out in this study, has to be estimated in detail together with the underlying mechanisms leading to differences between model output and observations, which will be subject of a subsequent study to what is presented here.
9 Summary
The main objective of this study was to examine how well key parameters of the hydrological cycle like WV and pre-cipitation are represented by the semi-offline model MATCH driven by NRA data and to identify regions with poten-tial problems in the MATCH parameterizations related to the formation of cloud and precipitation, as well as regions with potential deficiencies in the employed reanalysis data. The results of this study may therefore be of use in subse-quent model sensitivity studies employing and testing differ-ent convective cloud model parameterizations, differdiffer-ent re-analysis data sets (e.g., ERA rere-analysis instead of NRA), as well as new cloud micro-physical schemes for use in CTMs and GCMs. An additional objective of the paper is to demon-strate the capabilities of the GOME WV data record to be used for model evaluations on global and regional scales and as a truly independent source with respect to the reanalysis data sets.
There are four qualitative conclusions which can be drawn from the above comparisons:
i: GOME compares well to independent measurements of WVC by SSM/I over oceans and reasonably to mea-surements compiled by NVAP over land (cf., Lang and Lawrence, 2004).
ii: MATCH models the general global PR and atmospheric WV content quite well with a tendency to be on average drier than the observations and the reanalysis data.
iii: The WV distribution patterns as modelled by MATCH are quite similar to those given by NRA, whereas both MATCH and NRA exhibit significant regional differ-ences to what has been observed by GOME.
iv: The WVC residuals between MATCH and the GOME observations are similar to residuals observed in the PR between MATCH model results and GPCP observations for wide parts of the globe.
The GOME instrument provides a database from 1995 to the present over all surface types, whereas most other instru-ments measuring WV with a comparable record of data are restricted to either land or ocean surfaces. However, GOME retrievals are performed employing a WV absorption around 590 nm, which is affected by cloud contamination of the line-of-sight. GOME-SSP retrieved differences to other indepen-dent measurement sources, like those from the SSM/I instru-ment over oceans and the NVAP blended WV database over ocean and land, are generally significantly lower than 0.5 cm except for regions along the ITCZ, where frequent occur-rence of cloud contaminated ground pixels introduces differ-ences up to 1 cm in the three years averaged monthly WVC. The impact of hygroscopic aerosols (like sea salt) under high relative humidity conditions probably leads to an observed dry bias of the GOME-SSP retrievals for hemispheric winter over ocean surfaces. This aerosol induced effect on the re-trieval may be studied by employing recent newly developed aerosol modules in model calculations with simple relation-ships between aerosol mass relative humidity and aerosol op-tical properties (Metzger et al., 2002). Such studies are cur-rently underway along with employing improved tempera-ture and pressure profiles from reanalysis data for the calcu-lation of reference absorption line-parameters in SSP.
MATCH calculates both WV and precipitation fields online, whereas for the NRA data set only precipitation amounts are online modelled quantities and not directly forced by measurements. The shape of the MATCH mod-elled zonally averaged WV closely resembles the shape of the zonally averaged NRA data set, because the MATCH ver-sion employed here uses parameters essential for modelling the hydrological cycle, like temperature, wind fields and la-tent heat fluxes, from NRA. However, regional differences in the WVC distributions have been identified. MATCH is sig-nificantly drier along the ITCZ than NRA for both seasons and moderately dry compared to the GOME-SSP observa-tions in August. MATCH appears to have problems in mod-elling the WV content in regions of strong upward convec-tion like along the ITCZ. As a consequence of the relatively dry convergence zone regions, MATCH is globally drier by about 0.2 cm than the NRA data set in August. GOME-SSP is also biased dry along the ITCZ through reduced monthly WVC statistics and residual cloud contamination. Therefore, GOME-SSP global mean WVC values are comparable to MATCH global mean values, especially for January where
the ITCZ regions are predominantly oceanic with longer cloud lifetimes. GOME-SSP derived global mean WVC are therefore generally smaller than those provided by NRA.
Regional differences between MATCH modelled WV columns and the observations can be as large as 2 cm on the basis of monthly averages over three years. This con-clusion also holds for differences observed between GOME-SSP and NRA data, whereas the NRA and MATCH WV distribution patterns generally closely resemble each other. MATCH and NRA share significant common WVC residu-als to the GOME-SSP observations over NH land masses, especially Canada and the U.S. East Coast, over Europe and wide parts of Russia for August, and over Central Africa and South America for January. There are also a number of oceanic regions along the ITCZ, like the southern branch of the Eastern Pacific split ITCZ for both seasons and the In-dian Ocean region along the equator in August showing high WVC when compared to GOME observations. NRA WVC residuals are generally larger than those observed from the MATCH comparisons to the observations. One conclusion that can be drawn from the comparisons is that either defi-ciencies in the modelled surface evaporation rates or region-ally too high net-influx of WV through overestimated mass fluxes may lead to these high WVC values.
This conclusion is further supported by the fact that re-gions of high WVC are generally closely related to rere-gions of too high model PR and vice versa for both MATCH and NRA output. The latter has been evaluated from a set of PR obser-vations comprised in the GPCP data set. This similarity in WV and precipitation patterns has been observed on a global scale, as well as over Europe and the Indian Ocean/Southeast Asian region. Even though GOME-SSP exhibits only small biases when compared to accurate data sets like SSM/I and radiosondes, it should be noted here that it might nevertheless be possible that the observed common biases in the presented comparisons might partly be due to biases in the GOME ob-servations, some of which have already been discussed be-fore. Regions like remote hemispheric land masses should therefore be subject of further evaluation of the quality of GOME retrieved WVC in additional studies.
MATCH generally exhibits too high mean PR when com-pared to both GPCP observations and NRA output. This study therefore suggests that a too rapid conversion of WV to precipitate in MATCH, especially in instances of strong convection, could be a main factor leading to regionally too dry model results and in turn to generally too low WV res-idence times when compared to regional and global mean values from GOME-SSP and GPCP observations.
In summary we therefore conclude that a study on the usage of a different set of reanalysis data to drive the MATCH model is required to examine the impact on the modelled WVC distribution. In addition, the re-examination of MATCH cloud formation and precipitation parameteriza-tions for strong convective events is also required in order to improve MATCH modelled precipitation fields. These
sults will be of relevance especially with respect to the re-gional to global scale impact of anthropogenic emissions on weather and climate via the strong link between the hydro-logical cycle and the atmospheric HOxchemistry, wet scav-enging of aerosols and trace gases and it will be of major importance for present model sensitivity studies employing and testing new sets of aerosol model parameterizations.
Acknowledgements. The authors would like to thank
R. von Kuhlmann for many fruitful discussions and valuable comments on the manuscript. We would like to thank P. Rasch (NCAR, Boulder, Colorado), and A. N. Maurellis (SRON, Utrecht, The Netherlands) for their careful reading of the manuscript
and very valuable suggestions on earlier drafts. The detailed
comments and constructive critiques of three anonymous referees were much appreciated and have contributed significantly to
the readability of the paper. The authors would like to thank
B. Steil (MPI-Chemistry, Mainz, Germany) for providing ECMWF
operational radiosonde data sets. M. Allaart (KNMI, Utrecht,
The Netherlands) is acknowledged for his support with the interpretation of radiosonde data. GOME level 1 data has been supplied by the Netherlands SCIAMACHY Data Center under ESA Category 1 Proposal A0-2310. NVAP and SSM/I data were obtained from the NASA Langley Research Center Atmospheric
Sciences Data Center. The GPCP combined precipitation data
were developed and computed by the NASA/Goddard Space Flight Center’s Laboratory for Atmospheres as a contribution to the GEWEX Global Precipitation Climatology Project. NRA data has been provided by the National Center for Atmospheric Research of the National Centers for Environmental Prediction, Boulder, Colorado. This work is financially supported by the EU funded 5th framework project PHOENICS.
Edited by: U. P¨oschl
References
Arakawa, A. and Schubert, W. H.: Interaction of a cumulus cloud ensemble with large-scale environment. 1, J. Atmos. Sci., 31, 3, 674–701, 1974.
Bonn, B., von Kuhlmann, R., and Lawrence, M. G.: High contri-bution of biogenic hydroperoxides to secondary organic aerosol formation, Geophys. Res. Lett., 31, 10, L10108, 2004.
Burrows, J. P., Weber, M., Buchwitz, M., Rozanov, V., Ladst¨atter-Weienmayer, A., Richter, A., deBeek, R., Hoogen, R., Bramst-edt, K., Eichmann, K.-U., and Eisinger, M.: The Global Ozone Monitoring Experiment (GOME): Mission Concept and First Scientific Results, J. Atmos. Sci., 56, 151–175, 1999.
Casadio, S., Zehner, C., Piscane, G., and Putz, E.: Empirical Re-trieval of Atmospheric Air Mass Factor (ERA) for the Measure-ment of Water Vapor Vertical Content using GOME Data, Geo-phys. Res. Lett., 27, 1483–1486, 2000.
Crutzen, P. J. and Lawrence, M. G.: The Impact of Precipitation Scavenging on the Transport of Trace Gases: A 3-Dimensional Model Sensitivity Study, J. Atmos. Chem., 37, 81–112, 2000. Engelen, R. J. and Stephens, G. L.: Characterization of water-vapor
retrievals from TOVS/HIRS and SSM/T-2 measurments, Q. J. R. Meteorol. Soc., 125, 331–351, 1999.