Distributed Quantitative Precipitation Forecasts Combining
Information from Radar and Numerical Weather Prediction
Model Outputs
by
Auroop R. Ganguly
B. Tech. (Hons.), Civil Engineering
Indian Institute of Technology, Kharagpur-India, 1993 M. S., Civil Engineering
University of Toledo, Toledo, OH, 1997
Submitted to the Department of Civil and Environmental Engineering in Partial Fulfillment of the Requirements for the Degree of Doctor of Philosophy
at the
Massachusetts Institute of Technology June, 2002
© 2002 Massachusetts Institute of Technology All rights reserved
S ignature of A uthor ... . . . . . .. ... De artnen of Civil and Environmental Engineering
February, 2002 Certified by... ...
Rafael L. Bras JBacard aSo/ckDolm Water Foundations Professor Thesis Supervisor A cce pted by ... ... ... --.
MASSACHUSETTS INSTITUTE Oral Buyukozturk
Distributed Quantitative Precipitation Forecasts Combining
Information from Radar and Numerical Weather Prediction
Model Outputs
Auroop R. GangulySubmitted to the Department of Civil and Environmental Engineering in Partial Fulfillment of the Requirements for the Degree of Doctor of Philosophy
ABSTRACT
Applications of distributed Quantitative Precipitation Forecasts (QPF) range from flood forecasting to transportation. Obtaining QPF is acknowledged to be one of the most challenging areas in hydrology and meteorology. Recent advances in precipitation physics, Numerical Weather Prediction (NWP) models, availability of high quality remotely sensed measurements, and data dictated forecasting tools, offer the opportunity of improvements in this area. Investigative studies were performed to quantify the value of available tools and data, which indicated the promise and the pitfalls of emerging ideas. Our studies suggested that an intelligent combination of NWP model outputs and remotely sensed radar measurements, that uses process physics and data dictated tools, could improve distributed QPF.
Radar measurements have distributed structure, while NWP-QPF incorporate large scale physics. Localized precipitation processes are not well handled by NWP models, and grid average NWP-QPF are not too useful for distributed QPF owing to the spatial variability of rainfall. However, forecasts for atmospheric variables from NWP have information relevant for modeling localized processes and improving distributed QPF, especially in the Summer. Certain precipitation processes like advection and large scale processes could be modeled using physically based algorithms. The physics for other processes like localized convection or residual structures are not too well understood, and data dictated tools like traditional statistical models or Artificial Neural Networks (ANN) are often more applicable.
A new strategy for distributed QPF has been proposed that utilizes information from radar and NWP. This strategy decomposes the QPF problem into component processes, and models these processes using precipitation physics and data dictated tools, as appropriate and applicable. The proposed strategy improves distributed QPF over existing techniques like radar extrapolation alone, NWP-QPF with or without statistical error correction, hybrid models that combine radar extrapolation with NWP-QPF, parameterized physically based methods, and data dictated tools alone. New insights are obtained on the component processes of distributed precipitation, the information content in radar and NWP, and the achievable precipitation predictability.
Thesis Supervisor: Rafael Bras
Acknowledgments
This work was partially supported through the National Weather Service (NOAA, US Department of Commerce) Award NA07WH0437 as part of the Cooperative Agreement on the Comparison of Distributed and Lumped Hydrologic Models, and the Consiglio Nazionale delle Ricerche of Italy as part of the Cooperative Agreement in Climate Change and Hydrogeological Disasters. I would like to acknowledge the support I received at Oracle Corporation, where I have been employed full time for the last three and a half years.
I am grateful for the suggestions and help I received from my adviser Prof. Rafael Bras, and all my committee members: Profs. Dennis Mclaughlin and Elfatih Eltahir of the MIT Parsons Lab, Dr. Amar Gupta of the MIT Sloan School of Management, and Prof. Shafiqul Islam of the University of Cincinnati. I am grateful for the suggestions from Prof. Dara Entekhabi, to whom I owe many of the starting assumptions of this research. I would also like to thank Dr. Earle Williams of the Parsons Lab at MIT for his initial comments, and the helpful suggestions at various stages from Prof. Ana Barros at Harvard University. I gratefully acknowledge the help from the National Weather Service for making the radar data (in Topeka, KS) available and the help from Prof. Ana Barros and her collaborator Dr. Robert Kuligowski on information regarding this data and the necessary transformations. The NWP-Eta FOUS model outputs were purchased from the NCDC (thanks to Ms. Diane Dicus), and the gage corrected NEXRAD data in Oklahoma were downloaded from the ABRFC web page.
I cannot begin to acknowledge the constant support of my parents, Shreemati
Deepali Ganguly and Shree Nirmal Kumar Ganguly, my "kid" brother Swaroop, and my wife Debashree. Without their constant support and encouragement, I could never have finished this work. Thanks also to all my friends, relatives, and coworkers at Oracle Corporation, MIT, IIT-KGP, and elsewhere, who supported and encouraged me while I was a full time graduate student at MIT, and especially during the final three and a half years, as I juggled between my doctoral research in rainfall forecasting at MIT, and full time work as the Product Manager for Demand Planning (a forecasting application) at Oracle. Special thanks to Ms. Elaine Healy and Ms. Cynthia Stewart of MIT for their continual help during the last three and a half years when I was a non-resident student at MIT, and during the preparation of the thesis as well as for other coordination issues.
Contents
Pages
1.0 Introduction... ... ... 12-16 1.1 Benefits of Im proved Distributed QPF ... 12-12 1.2 Challenges and Issues...13-14
1.3 Improving Distributed QPF...14-16
2.0 Executive Summary and Problem Setting... ... 17-19 2 .1 P ro ble m S etting ... 17-17 2.2 Executive S um m ary ... 18-19
3.0 Recent Advances and Distributed QPF Literature...20-33 3.1 Numerical Weather Prediction Models and Precipitation Physics...20-23 3.2 Remote Sensing Methods and Ground Measurements...23-25 3.3 Traditional and Emerging Statistical and Data Dictated Tools...25-29 3.4 Radar Extrapolation, NWP Model Outputs and Precipitation Physics ... 30-31 3.5 Meteorological and Hydrological Approaches to Distributed QPF ... 32-33
4.0 Data Analyses and Investigation of QPF Strategies...34-55 4.1 Analysis of Information Content in the Available Data...35-42 4.2 Analysis of Distributed Precipitation Processes and Strategies...43-50 4.3 Exploring the Value of Conceptual Approaches to Distributed QPF...51-52 4.4 Consolidation of Insights for Improved Distributed QPF ... 53-55
5.0 Decomposition of Precipitation Processes and a Hybrid Model...56-78 5.1 Decomposition Rationale ... 56-56 5.2 Overview of the Hybrid Modeling Strategy...58-59 5.3 Details of the Radar Extrapolation Component...60-62 5.4 Details of the Large Scale Physics Component ... 63-68 5.5 Details of the Localized Evolution Component...69-74 5.6 Details of the Residual Structures Component ... 75-78
6.0 Reference Models and Skill Scores...79-87 6.1 Reference Models for Distributed QPF ... 79-82 6.2 Measures of Skill for Distributed QPF ... 83-87
7.0 Description and Availability of Data...88-96 7.1 Numerical Weather Prediction Model Outputs ... 88-92 7 .2 R adar R ainfall ... 93-94 7.3 P recipitation Events ... 95-96
8.0 Results...97-137 8.1 Contribution of the Component Processes of Precipitation ... 97-102 8.2 Improvements to Distributed QPF...103-137
9.0 Discussions and Performance Analysis...138-148 9.1 Summer Precipitation Events...140-142 9.2 Winter Precipitation Events ... 143-147
9.3 All Seasons C om bined...148-148
10.0 S um m ary ... 149-151
11.0 Future Research ... 152-158 11.1 Event Based and Continuous QPF Formulations ... 154-157 11.2 Distributed Precipitation Maps as Geometrical Objects ... 158-158
12.0 Conclusions...159-160
Appendix A: Use of Artificial Neural Networks (ANN)...161-185 A.1 Hydrologic Scope of the QPF Problem...161-161 A.2 ANN Fundamentals and Forecasting Applications ... 162-176 A.3 ANN Formulation Details ... 177-185
Appendix B: Directional Structure in Precipitation and QPF Errors...186-204
List of Figures
Pages
Figure 4-1: Spatial Mean and Variance of Hourly Radar Rainfall... 37
Figure 4-2: Spatial Mean of Radar Rainfall, Persistence, and Advection... 38
Figure 4-3: Distributed Skills in Persistence and Advection... 39
Figure 5-1: Flowchart for the Proposed Hybrid Modeling Strategy... 59
Figure 5-2: Radar Extrapolation Strategy ... 62
Figure 5-3: Large Scale Physics Strategy: Temporal Disaggregation ... 66-67 Figure 5-4: Large Scale Physics Strategy: Spatial Disaggregation... 68
Figure 5-5: Localized Evolution Strategy: Function Approximation ... 73
Figure 5-6: Localized Evolution Strategy: ANN...74
Figure 5-7: Residual Structures Strategy... 78
Figure 6-1: The NIMROD QPF Strategy... 82
Figure 7-1: NWP FOUS locations in the US... 91
Figure 8-1: Contribution of Component Processes - Distributed Skills...101
Figure 8-2: Contribution of Component Processes - Aggregate Errors ... 102
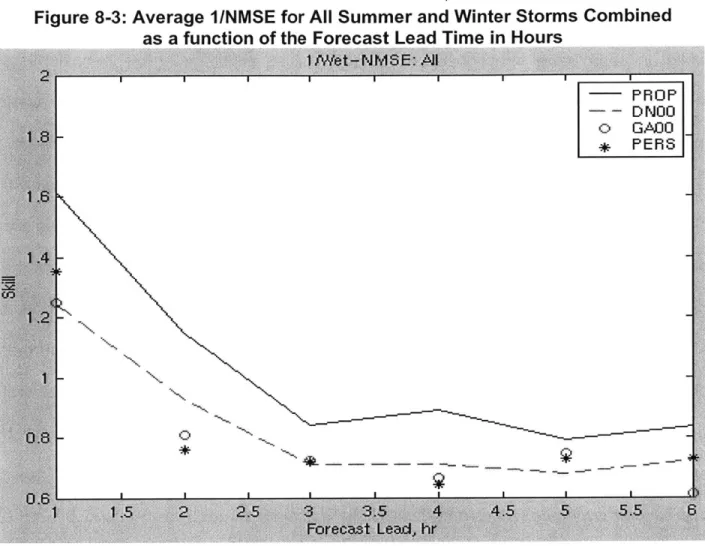
Figure 8-3: Average 1/NMSE for all Seasons Combined ... 112
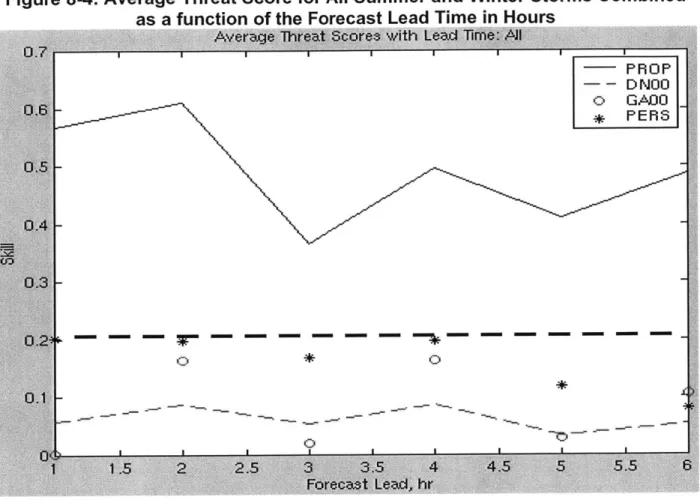
Figure 8-4: Average Threat Scores for all Seasons Combined ... 113
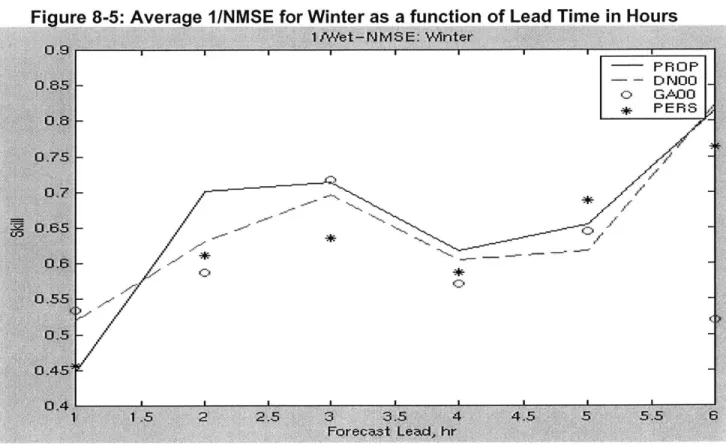
Figure 8-5: Average 1/NMSE for the Winter...114
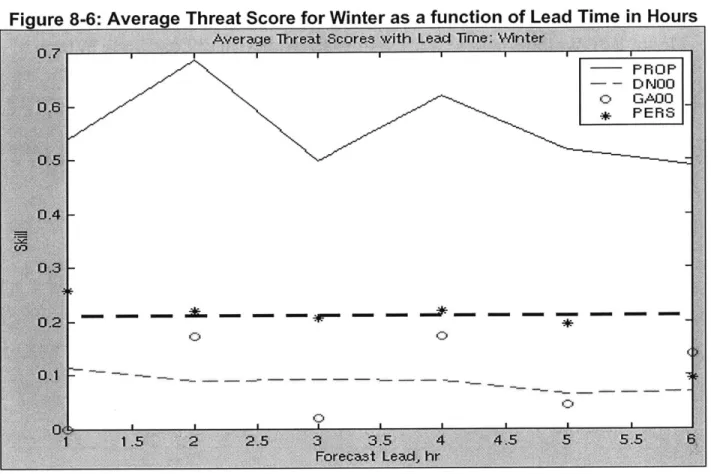
Figure 8-6: Average Threat Score for the Winter ... 115
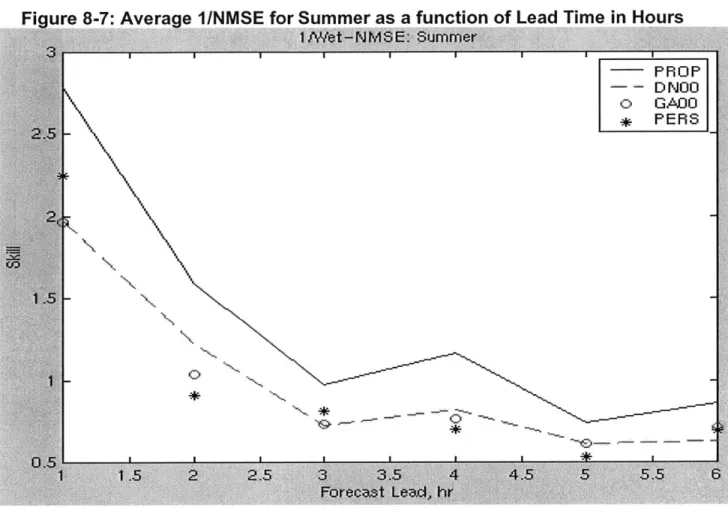
Figure 8-7: Average 1/NMSE for the Summer...116
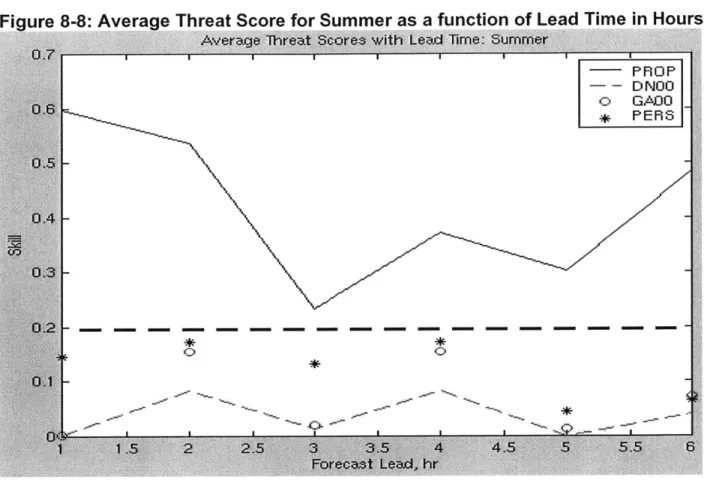
Figure 8-8: Average Threat Score for the Summer ... 117
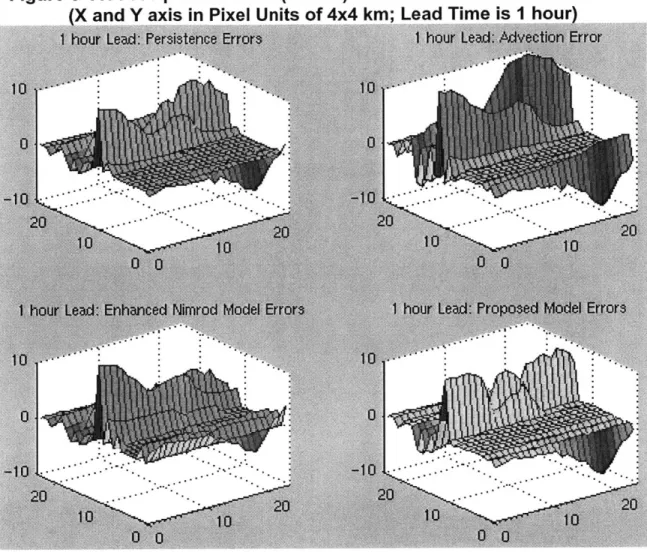
Figure 8-9: Precipitation Error Contour Plots for Summer Storm "A"...118
Figure Figure Figure Figure Figure Figure Figure Figure Figure Figure Figure Figure Figure Figure Figure Figure Figure Figure Figure Figure Figure Figure Figure 8-11: 8-12: 8-13: 8-14: 8-15: 8-16 8-17 8-18 8-19 8-20 8-21 8-22 8-23 8-24 8-25 8-26 8-27 11-1 B-1: B-2: B-3: B-4: B-5:
Contour Plots of Radar Rainfall, Contour Plots of Radar Rainfall, Contour Plots of Radar Rainfall, Contour Plots of Radar Rainfall, Contour Plots of Radar Rainfall, Contour Plots of Radar Rainfall, Contour Plots of Radar Rainfall, "Continuous" QPF Performance Precipitation Precipitation Precipitation Precipitation Precipitation Precipitation Precipitation Precipitation Precipitation Precipitation
Measured Precipitation and Persistence Contours: Storm A... Measured Precipitation and Persistence Contours: Storm A... Persistence Errors: Storm A ... Measured Precipitation and Persistence Contours: Storm B... Measured Precipitation and Persistence Contours: Storm B...
187 188 189 190 191
Error Contour Plots for Summer Storm "B"...120
Error Surface Plots for Summer Storm "B"...121
Error Contour Plots for Summer Storm "C"...122
Error Surface Plots for Summer Storm "C"...123
Error Contour Plots for Winter Storm "D"...124
Error Surface Maps for Winter Storm "D" ... 125
Error Contour Plots for Winter Storm "E"...126
Error Surface Plots for Winter Storm "E" ... 127
Error Contour Plots for Winter Storm "F"...128
Error Surface Plots for W inter Storm " " ... 129
Proposed QPF, and pQPF...131
QPF and pQPF Errors for Storm A ... 132
QPF and pQPF Errors for Storm B...133
QPF and pQPF Errors for Storm C...134
QPF and pQPF Errors for Storm D...135
QPF and pQPF Errors for Storm E ... 136
QPF and pQPF Errors for Storm F ... 137
Figure B-6: Persistence Errors: Storm B ... 192
Figure B-7: Measured Precipitation and Persistence Contours: Storm C...193
Figure B-8: Measured Precipitation and Persistence Contours: Storm C...194
Figure B-9: Persistence Errors: Storm C ... 195
Figure B-10: Measured Precipitation and Persistence Contours: Storm D...196
Figure B-11: Measured Precipitation and Persistence Contours: Storm D...197
Figure B-12: Persistence Errors: Storm D ... 198
Figure B-13: Measured Precipitation and Persistence Contours: Storm E...199
Figure B-14: Measured Precipitation and Persistence Contours: Storm E...200
Figure B-15: Persistence Errors: Storm E ... 201
Figure B-16: Measured Precipitation and Persistence Contours: Storm F...202
Figure B-17: Measured Precipitation and Persistence Contours: Storm F ... 203
List of Tables
Table 4-1: Aggregate Radar Rainfall and NWP Outputs: Variability Explained...42
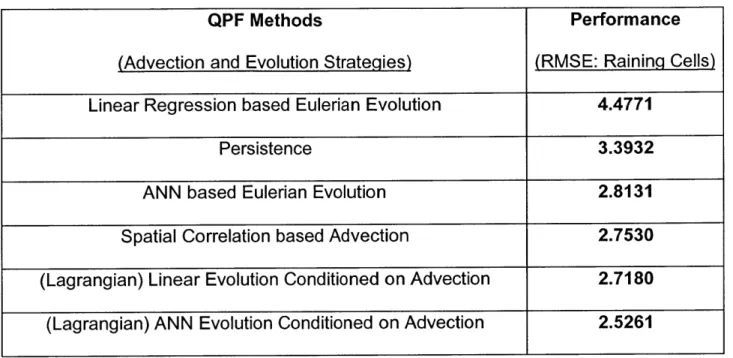
Table 4-2: Performance of Preliminary QPF for Advection and Evolution...47
Table 4-3: Comparison of Simple Disaggregation and Localized Evolution ... 50
Table 7-1: Sample FOUS data for the NWP-Eta model ... 88
Table 7-2: Significant Precipitation Events in Oklahoma... 96
Table 9-1: Performance of QPF Component Processes in the Summer...142
Table 9-2: Performance of QPF Component Processes in the Winter...147
Pages
1.0 Introduction
1.1 Benefits of Improved Distributed QPF
Distributed Quantitative Precipitation Forecasts (QPF) are the primary forcing to lumped and distributed models of hydrology (Pessoa et al., 1993; Garrote and Bras, 1995; Ibbit et al., 2000), and critical for accurate predictions of floods and flash floods. Of all natural disasters, floods are the leading cause of damage to human lives and property in the United States (NRC, 1996; Kim and Barros, 2001; Droegemeier et al., 2000) and other countries. Between 1989 and 1999, floods resulted in 988 human lives lost in the United States and $4.5 billion property damage (US Army Corps of Engineers, 1999; Kim and Barros, 2001). Approximately 75% of all presidential declarations of natural disasters have involved floods (NRC 1996).
As indicated by Smith and Austin (2000), applications of short-term, distributed QPF range from urban hydrology (Cluckie et al, 1999) to space shuttle landings (Bauman and Businger, 1996). Browning and Collier (1989) tabulated the benefits of nowcasting (e.g., 1-3 hour QPF). Severe weather warnings for heavy rain and gust fronts, and water management operations like flood forecasting, sewer operations and spillway operations could save lives and property. Agriculture, irrigation and civil engineering operations like concrete pours could benefit from advance warning systems that use accurate forecasts of rainfall and floods. QPF is useful for the transportation industry, including air, road, sea, and rail transport. Diverse activities like military operations and leisure are influenced by QPF, as are industry sectors like power and communication.
1.2 Challenges and Issues
Distributed QPF is acknowledged to be among the most challenging areas in hydrology and meteorology (Fritsch et al., 1998; Antolik, 2000; Collier and Kryzysztofowicz, 2000), and improvements to QPF over the decades have been somewhat limited (Smith and Austin, 2000). The degree of belief in distributed QPF is so low that until recently, operational models of hydrology were run (and often continue to be run) without these inputs. However, not using QPF corresponds to using forecasts of no rainfall (Collier and Kryzysztofowicz, 2000), which could significantly underestimate the likelihood of floods.
Several factors contribute to make precipitation "notorious for being difficult to quantitatively predict accurately" (Gaudet and Cotton, 1998). The atmospheric processes that cause precipitation could occur at several scales, ranging from large air mass movements to extremely localized convective events (Rogers and Yau, 1989). The relations of precipitation quantity to the basic meteorological state variables are indirect. The meteorology of precipitation is influenced by air motion and turbulent eddies leading to cloud formation, variation of cloud and aerosol properties, and microphysical processes that dictate droplet growth and evaporation. The net effect of all of the above is that precipitation is extremely variable in space and time, and hence very difficult to forecast.
The requirements and achievable predictability for the temporal and spatial resolution at which QPF needs to be produced vary by forecast lead times. At very short lead times (0-1 hour), high forecast resolutions are needed. Forecasts based on extrapolation of observations like radar rainfall are often found to be most skillful in this
context (Golding, 2000; Collier, 1991). At lead times greater than about 6 hours, Numerical Weather Prediction (NWP) models by themselves provide the best available forecasts of precipitation, at lower resolutions in space and time. Researchers like Krishnamurti et al. (1999) have demonstrated that an optimal combination of the outputs from several NWP models could improve forecasts at these resolutions. This research focuses on 1-6 hour QPF, for which forecasts are required at high resolutions for hydrologic applications (NOAA, 1997). For these forecast scenarios, an optimal combination of information from NWP model outputs and distributed radar measurements could lead to improved distributed QPF.
1.3 Improving Distributed QPF
Better understanding of the physics of the weather system and improved computer speeds have enabled Numerical Weather Prediction (NWP) models to forecast precipitation and atmospheric quantities in real time at higher resolutions, and to consider effects like topography and convective parameterizations. The best available and archived NWP model results currently available in the United States are those from the 48-km Eta model, in the form of FOUS (Forecast Outputs for the United States). The forecasts from NWP-Eta are 6 hourly and 48 km grid average.
Availability of high quality measurements from remote sensing tools like radar and satellites are continually improving in accuracy, coverage and resolutions. NEXRAD (NEXt generation RADar) covers the continental United States extensively, and precipitation measurements in the HRAP (Hydrologic Rainfall Analysis Project) grid are available at 4x4 km resolutions. Uncalibrated Stage I and calibrated Stage Ill precipitation estimates from radar are made available by the River Forecast Centers
(RFC). The highest quality radar data are available in the ABRFC (Arkansas-red Basin River Forecast Center), the best calibration with ground based measurements is in Oklahoma due to the presence of the Oklahoma MesoNet. Antolik (2000) of the
National Weather Service (NWS) mentions that future research needs to explore methods that combine the 48-km NWP-Eta model outputs with Stage III radar data.
Evaluation of available and emerging tools and methods for distributed QPF indicate that the best strategy to combine radar and NWP information could be through a hybrid modeling strategy that decomposes the problem into component processes, and handles each process using precipitation physics or data dictated tools, whichever is most applicable. The hybrid modeling strategy must be designed to extract the maximum information from NWP and radar at different space-time resolutions.
This work decomposes the distributed QPF problem into four component processes. These are "Radar Extrapolation", "Large Scale Physics", "Localized Evolution", and "Residual Structures". A hybrid modeling strategy is proposed to account for these processes, each component successively builds upon the results of the previous components. Radar extrapolation is handled through advection. QPF produced by Numerical Weather Prediction models (NWP-QPF) is assumed to represent large scale physics at lower resolutions, this is disaggregated in time and space using the results of advection. Localized evolution is assumed to be conditioned on the results of advection and large scale physics, and uses NWP forecasts of atmospheric variables in a data dictated Artificial Neural Network (ANN) formulation. Error analysis of distributed and aggregate (in space and time) predictions indicate that improvements can be obtained by combining various outputs in an "optimal" way.
The proposed hybrid model is shown to appropriately combine the individual component processes, and succeeds in improving distributed QPF over the "state of the art". The use of data dictated tools alone, as well as the use of parameterized physically based models, are shown to be sub-optimal to a hybrid modeling strategy. We consider persistence, advection, and a hybrid model that combines advection and NWP-QPF, as the commonly used reference models. These are compared with the proposed hybrid model in terms of skill measures. The goodness of a forecast is quantified by an average distributed measure of skill based on the Root Mean Squared Errors (RMSE), and a surrogate cost measure that is based on a redefined threat score, which considers the number of times the forecasts and observations lie within given thresholds. The improvement in distributed QPF is also depicted by contour and surface plots of the QPF errors. Detailed analyses of performance of the various QPF components offer interesting insights on the precipitation processes and on the information content in radar measurements and NWP model outputs.
2.0 Problem Setting and Executive Summary
2.1 Problem Setting
In the United States, high resolution precipitation estimates are obtained from the NEXRAD (NEXt generation RADar) system. Uncalibrated radar measurements are referred to as "Stage I". The River Forecast Centers (RFC) calibrate radar measurements with ground based information, to obtain "Stage Ill" precipitation estimates. The available resolution of radar precipitation is 4x4 km and 1 hour, in the HRAP (Hydrologic Rainfall Analysis Project) grid. The best radar calibrations are available in the ABRFC (Arkansas-red Basin River Forecast Center) in Oklahoma, owing to the presence of the Oklahoma Mesonet.
Numerical Weather Prediction (NWP) models take into account large scale physics of the atmosphere, and generate low resolution forecasts for precipitation and atmospheric variables. The best NWP model for which archived results are readily available is the 48-km Eta. Outputs from the NWP-Eta are available at 48 km grid spacing and for 6, 12, 18, 24, 30, 36, 42, and 48 hours.
The objective of this work is to obtain distributed Quantitative Precipitation Forecasts (QPF) at 1-6 hour lead times, which are useful for hydrologic applications like flood forecasting. The achievable resolutions are 4x4 km and 1 hour (i.e., radar resolution). The first part of this work performs an analysis of the information, and evaluates traditional and emerging tools and strategies for distributed QPF. The second part attempts to use these insights to develops a new strategy for distributed QPF that improves over the "state of the art".
2.2 Executive Summary
Distributed QPF is useful for a variety of applications ranging from the prediction of floods and flash floods, to transportation and space shuttle landings. This research evaluates existing methods for distributed QPF like radar extrapolation (i.e., persistence and advection), NWP-QPF (raw, or after statistical post-processing), hybrid models that combine radar extrapolation with NWP-QPF, data dictated tools alone (which include traditional statistical techniques and nonlinear methods like ANN), and parameterized physically based methods. A new strategy is proposed that improves distributed QPF over existing methods. Improvement in distributed QPF is achieved by decomposing the problem into component processes. The decomposition strategy attempts to utilize available precipitation physics and data dictated tools, through the use of relevant information from NWP model outputs (including QPF and atmospheric variables) and remotely sensed radar measurements. The proposed strategy has four component processes, which we shall call "Radar Extrapolation", "Large Scale Physics", "Localized Evolution" and "Residual Structures".
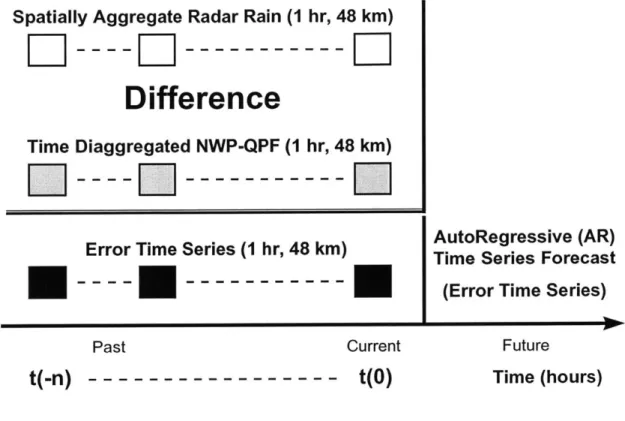
Radar Extrapolation provides distributed structure, and is best modeled using advection. The proposed advection formulation uses two-dimensional spatial correlation to estimate the velocity scales at lagged time steps, and single exponential smoothing to forecast the velocity scales. These are in turn used to translate the current precipitation map. Large Scale Physics is best represented by NWP-QPF, which is available at lower resolution. This is disaggregated in time using linear interpolation, and then corrected for errors by comparing with
spatially aggregated radar measurements, through an Auto-Regressive statistical time series technique. The time disaggregated and error corrected QPF from NWP is then disaggregated in space using the results of Extrapolation. Localized Evolution is assumed to occur on top of Extrapolation and Large Scale Physics. This is assumed to be a function of the precipitation intensity at neighboring pixels, and the large scale atmospheric state, which in turn is indicated by NWP forecasts of atmospheric variables. The physics at these scales is not well known, so localized evolution is modeled using an ANN based nonlinear regression framework. The Residual Structures strategy attempts to reduce the distributed and aggregate errors at all lead times by utilizing the complementary skills of the other components processes.
The proposed strategy produces spatially distributed QPF and pQPF (i.e., upper and lower confidence bounds) for 1-6 hour lead times. Improvements to distributed QPF are demonstrated through quantitative skill scores, and visually through plots of the errors.
3.0 Recent Advances and Distributed QPF Literature
3.1 Numerical Weather Prediction Models and Precipitation Physics
Numerical models of the weather have been improving continually over the years (see Hartmann, 1994), currently atmospheric centers around the globe routinely run their own versions of these models. NWP models attempt to describe atmospheric state evolution with three dimensional partial differential equations, and solve these by numerical integration. The boundary conditions are derived from data assimilation techniques, which use measurements and results of lower resolution models. Initial conditions are obtained from measurements and previous model runs.The greatest source of uncertainty in NWP model outputs are subgrid scale processes like convection, clouds, and Planetary Boundary Layer (PBL) eddies. The coverage of the NWP models and the constraints imposed by the numerical schemes preclude the possibility of grid resolutions that are high enough to capture these subgrid processes, however these processes could significantly influence the weather system. Convection and clouds, for example, have large impacts on rainfall generation and cause the greatest uncertainty in NWP model outputs. NWP models generate grid average forecasts of various quantities including QPF, the latter is often thought to be relatively less accurate and is typically used as a measure of model performance (Mesinger, 1996; Antolik, 2000).
There is a belief that gradual improvements to NWP models (both the physics as well as the resolutions) and computer speeds would be the best way to improve distributed QPF in the future. Given the nature of the distributed precipitation processes
(Islam et al., 1993a; Rodriguez-Iturbe et al., 1989; Schertzer and Lovejoy, 1987), and the limited understanding of the precipitation physics at those scales (Grecu and Krajewski, 2000; Rogers and Yau, 1989), this assumption remains to be proven (see also, Georgakakos 2000; Nakakita et al., 1996). Scientists are beginning to generally acknowledge that the ultimate limit to predictability from NWP models is dictated by the chaotic nature of the weather system (Lorenz, 1982; Islam et al., 1993b; Li et al., 1995), which causes the numerical model results to be very sensitive to the prescribed initial conditions. This is reflected on the widespread use of ensemble techniques that attempt to run NWP models with a number of possible initial conditions to generate a set of probable outcomes (e.g., Du et al., 1997). Another consideration is that the currently achievable resolutions from NWP models are not adequate for generating QPF at scales useful for hydrologic purposes (Antolik, 2000; Georgakakos, 2000). However, NWP models are rapidly evolving, and it is conceivable that the forecast resolutions would approach hydrologically useful scales in the future (Droegemeir et al., 2000).
Some researchers have suggested using radar measurements to initialize NWP model runs through data assimilation, or "nudging" NWP models with radar estimates (Jones and Macpherson, 1997). However, these nudging methods do not address several key issues, as pointed out by Golding (2000) and others. First, these methods do not alleviate the problems caused by the lower NWP model resolutions. Initializations and calibrations still need to be performed at NWP resolutions. Second, the models themselves are not a good approximation of reality owing to the relatively poor understanding of the precipitation physics at distributed scales. Finally,
precipitation is a not a state variable of the weather equation but needs to be derived, which causes the accuracy to suffer as mentioned by Antolik (2000) and others.
While NWP models cannot account for distributed precipitation physics too well, parameterized physically based models do exist for distributed QPF (Georgakakos and Bras, 1984 a,b; Lee and Georgakakos, 1990, 1996; French et al., 1994 a,b; Dolcine et al., 2000). The parameters of these models could be potentially related to (and estimated from) NWP model outputs. For example, Nakakita et al. (1996) obtained improvement in QPF at 1-3 hour lead times by using forecasts for atmospheric variables (but not QPF) from a NWP model, through a physically based scheme developed for distributed scales (see also, Sugimoto et al., 2001).
Previous researchers have attempted to make use of statistical and fractal models of rainfall, and "downscale" NWP-QPF in a manner that preserves the statistical properties of distributed rainfall. For example, the downscaling algorithm of Perica and Foufoula-Georgiou (1996) uses the CAPE (Convective Available Potential Energy). Bindlish and Barros (2000) suggest a way to disaggregate rainfall in regions of complex terrain. While these disaggregation models could be useful to understand and forecast the statistical properties of rainfall at distributed scales, they might not be optimal in forecasting applications that attempt to generate distributed QPF for hydrologic or other applications.
In the United States, operational rainfall forecasts at selected locations are made using MOS (Model Output Statistics) techniques, which use linear regression equations to relate NWP model outputs to point rainfall (Antolik, 2000). These seem to work better in the "cooler seasons", possibly because localized convection dominates in the
"warmer seasons". An interesting observation from these results is that the forecasts for precipitation (QPF) from the NWP models are not found to be the most important predictor for rainfall at a point. This underscores the spatial variability of precipitation at distributed scales, and the relevance of NWP forecasts of atmospheric variables to precipitation generation. In the US, the best NWP model for which outputs are currently readily available is the 48 km NWP-Eta (Black, 1994). The model outputs are forecasts of precipitation (QPF), and atmospheric variables like wind, pressure, temperature, humidity and instability indices. The forecasts are for 48 km grid average and every 6 hours, till 48 hours (6, 12, 18, 24, 30, 36, 42, 48 hours).
3.2 Remote Sensing Methods and Ground Measurements
Advanced remote sensing systems for precipitation estimation, like the NEXt generation RADar (NEXRAD), and geostationary satellites, are in place in countries like the US.
Satellite observations have been used for rain rate estimation (Sorooshian et al., 2000) and for forecasting precipitation (Browning, 1979) and floods (Kim and Barros, 2001). Satellite observations are not available at resolutions directly useful for hydrologic purposes, and could have significant errors, especially when related to quantities relevant to precipitation generation (Smith and Austin, 2000).
The information from weather radar is believed to be more directly relevant to distributed QPF. Weather radar is used to measure reflectivity, and atmospheric variables like Vertically Integrated Liquid (VIL) water content at near surface layers (Rogers and Yau, 1989). The intensity of the back-scattered radiation is quantified by the radar reflectivity, Z. The quantity Z is related to the size and distribution of the water
droplets (or hydrometeors) in the atmosphere. These hydrometeors cause precipitation, hence empirical relations have often been used to relate Z to the actual rainfall rate R. Empirical power laws of the type Z=aRb (a, b are constants) have often been used, as in the Marshall-Palmer relation, which assumes an exponential form for the Drop Size Distribution (DSD) of the hydrometeors. These power law assumptions could cause significant errors in QPF and hydrographs. Some researchers have tried the Probability Matching Method (PMM) or variations thereof (see Sun et al., 2000, and the references therein) to obtain rainfall from radar.
Remotely sensed measurements typically need to be compared and calibrated with ground based measurements. Precipitation estimated from radar measurements often show systematic bias, and at times fail to adequately represent the true rainfall observed at the ground (Browning and Collier, 1989). Rain gages are used to measure rainfall at specific locations, and represent the "ground truth" at these points. However, even fairly dense rain gage networks often fail to provide significant distributed information owing to the extreme variability of rainfall in space (Golding, 2000). One compromise that is often attempted is to use radar measured quantities to estimate rainfall with a correction factor from rain gage measurements (e.g., for removal of any systematic bias). Some researchers tend to believe that an optimal combination of radar and rain gages produces the best results, although there is some debate on the value of calibration for distributed rainfall estimation (Kitchen and Blackall, 1992).
In the United States, the ABRFC (Arkansas-red Basin River Forecast Center) has the most dense NEXRAD radar coverage. In the Hydrologic Rainfall Analysis Project (HRAP) grid, the NEXRAD resolution is 4x4 km and hourly. Uncalibrated Stage I
radar data, as well as calibrated Stage III data, are made available through the RFC (River Forecast Centers). The best quality calibrated radar data are in the state of Oklahoma, where high quality ground based measurements are available from the Oklahoma MesoNet.
3.3 Traditional and Emerging Statistical and Data Dictated Tools
Statistical techniques for QPF have been evolving continuously over the years. One approach is to model, analyze and forecast time series and space-time phenomena from observations. Another could be to estimate and update the parameters of physically based formulations in real-time with new observations, for example through the use of discrete Kalman filter formulations. The tools available for statistical analysis of data have improved over the years. Among these complex tools are Artificial Neural Networks (ANN, see Bishop, 1996), which have been shown to efficiently model nonlinear relationships among data sets (Vemuri and Rogers, 1994; Weigend and Gershenfeld, 1994).
As pointed out by Grecu and Krajewski (2000), the physics of rainfall at distributed scales in space and time is not well understood. Previous researchers have attempted to obtain mathematical or stochastic formulations for the description and forecasting of distributed rainfall. An example is the cluster model of Rodriguez-lturbe and Eagleson (1987), where statistical distributions were used to describe rainfall cells in space and time. McLaughlin et al. (1990) demonstrated how the parameters of these models could be determined from data through the use of a discrete Kalman filter formulation. Other researchers suggested parameterized, physically based models, and estimated the parameters thereof using a Kalman filter (for example, Georgakakos and
Bras, 1984 a,b). These are conceptually appealing, but the inherent physics or statistics is typically a crude parameterization, and the applicability is often limited to specific situations for which these models were designed (Smith and Austin, 2000).
Forecasts of rainfall using statistical time series methods have been attempted before. Burlando et al. (1996) used a multivariate ARIMA (AutoRegressive Integrated Moving Average) formulation. Toth et al. (2000) forecast rainfall time series using a variety of methods like ARMA, ANN, and K-NN (K Nearest Neighbor), and verified the QPF by routing these through models of hydrology. The method based on ANN performed the best. To combine information from various models or measurement sources, Kryzysztofowicz (1999) suggested using Bayesian statistics. Similar methods based on human computer interaction were alluded to by Browning and Collier (1989). These methods might not fully address the need to generate distributed forecasts, or to combine information at disparate space-time resolutions.
Estimation and forecasting based on Artificial Neural Networks (ANN) have shown promise in geophysical applications (Elsner and Tsonis, 1992; Grieger and Latif, 1994; Navone and Ceccato, 1994; Tsonis et al., 1994), including Quantitative Precipitation Estimation (QPE) and Forecasting (QPF). ANN are complex data dictated tools that have been shown to act as "universal function approximators", and converge faster than other traditional approximators (Bishop, 1996; MacKay 1991, 1992). The Santa Fe time series competition saw some of the best forecasts from ANN based methods (Weigend and Gershenfeld, 1994). However, there is a need for caution when these tools are used. The applicability of ANN for a specific situation needs to be determined from an understanding of the statistics, domain knowledge and data
analysis. The discussions by Chatfield (1993) illustrate how it could be easy to misuse these tools, and the Sante Fe competition showed that misleading results could be obtained from not so good ANN techniques.
ANN based techniques have been shown to perform better than existing methods for fusion of radar and rain gage estimates in most situations (Matsoukas et al., 1999). Multiple information from satellite remote sensing (IR and/or VIS) were optimally combined for QPE using an ANN based technique by Hsu et al. (1999) and Sorooshian et al. (2000). QPE using satellite brightness temperature was also attempted by Hsu et al. (1997). Radar measurements were related to rainfall rate using an ANN based methodology by Xiao and Chandrasekar (1997), which improved over existing methods. Kuligowski and Barros (1998 a,b) obtained 0-6 hr QPF at a point using an ANN based time series forecasting method and information from multiple sources. Barros et al. (1996) forecast 1-hour QPF time series at a point using wind information and ANN. Hall (1996) used NWP-Eta model outputs and ANN for 24-hour gage mean and probabilistic rainfall forecasts. Single station QPF using pattern detection was attempted by Dumais and Young (1995). Basin average and basin maximum QPF were produced from NWP outputs through an ANN based approach by Gillispie (1993 a,b,c), results improved over the operational weather service forecasts. Lindner and Krien (1993) used ANN to determine the maximum rain in Mississippi state from radiosonde. Kim and Barros (2001) improved flood forecasts by the use of ANN and multisensor information. ANN based cloud classification have been attempted by Lee et al. (1990), Visa et al. (1995) and in the Gandolf system of Golding (2000). Analysis and tracking of radar images using ANN were attempted by Ding et al. (1993)
and Denoeux and Rizand (1995). Marzban and Stumpf (1996) modeled a tornado using ANN. McCann (1992) modeled and forecast thunderstorms using ANN, and attempted to interpret the weights to obtain insights on the process physics. Lightning was modeled by Frankel et al. (1993) using ANN. An ANN based approach was used to forecast the Indian monsoon by Navone and Ceccato (1994).
The promise and pitfalls of ANN usage in the context of QPF are illustrated by Toth et al. (2000) and Grecu and Krajewski (2000). Toth et al. (2000) forecast precipitation time series, a method based on ANN performed the best. The works of Kuligowski, Barros, Gillispie, McCann and others described earlier also seem to indicate that ANN have the potential to significantly improve QPF. However, Grecu and Krajewski (2000) showed that ANN methods are not always appropriate for precipitation forecasting, specifically for modeling certain processes like advection. This suggests that ANN methods could be useful to handle certain components of the QPF problem, while other techniques might be more appropriate for the remaining components. This
leads to the possibility of a hybrid modeling strategy for QPF.
Hybrid models for QPF that statistically combine results from NWP models and extrapolation techniques have been used by the meteorological community (see Smith and Austin, 2000, for a review). Golding (2000) mentions that improving QPF at 1-6 hour lead time is a key requirement, and this could be achieved by statistically combining radar and NWP information. As discussed earlier, at 0-1 hour, NWP model outputs do not improve over radar extrapolation alone (Collier, 1991), while for longer leads (greater than 6 hours), forecasts are skillful only at aggregate space-time scales, at which NWP model outputs are available. The currently operational NIMROD system
in the U. K. Meteorological Office (Golding, 2000) combines radar advection with NWP-QPF using relative weights, and was designed for 1-6 hour NWP-QPF. This hybrid strategy improves distributed QPF at short lead times (1-6 hours) over radar extrapolation alone and NWP-QPF alone. Smith and Austin (2000) hail this NIMROD strategy as a great step forward in improving QPF.
Our studies indicate that complex phenomena like precipitation could be best modeled and forecast by decomposing the problem into component processes, and using process physics where these are most applicable, and data dictated tools like ANN or traditional statistics where these are best suited. In other words, this suggests a hybrid modeling approach, that uses the most applicable tool for each component process. The "state of the art" models for distributed QPF are in essence simple hybrid models, that combine the results of radar extrapolation achieved through advection or pattern recognition, with the results of large scale physics as represented by grid average QPF from NWP models (e.g., Golding, 2000). Hybrid models have been used in other areas related to forecasting and optimization. For example, in an inventory optimization problem undertaken at the MIT Sloan School of Management by the author along with others, inventory was reduced and customer satisfaction levels were maintained by using a hybrid model that combined domain specific knowledge with data dictated ANN tools (Reyes-Aldasoro et al., 1999).
3.4 Radar Extrapolation, NWP Model Outputs, & Precipitation Physics
Grecu and Krajewski (2000) conclude that advection (or translation based on estimates of a velocity scale) is the only physical process that contributes to QPF improvement from radar extrapolation. They tried two methods to estimate the velocity scales for advection, one based on spatial correlation, and another based on ANN. Improvement from the ANN was minimal to zero, which led them to conclude that complex statistical models do not improve forecasts based on extrapolation. Smith and Austin (2000) and Browning and Collier (1989) cite references to conclude that complex or higher order methods do not improve radar extrapolation results over simpler and/or linear methods. Browning and Collier (1989) mention that the decorrelation time for precipitation structure is of the order of an hour. Mecklenburg et al. (2000) demonstrated that local structures persist for about 40 min for convective situations and for slightly higher lead times for stratiform. The relative skills obtained by Golding (2000) show that advection could have two distinct skill behaviors (and modeling strategies). The 15-minute (or sub-hourly) Advection, which uses 15-minute precipitation maps, shows significant relative skills at lead times of 0-1 hour, but decays sharply thereafter. The skills from the 1-hour Advection are relatively low initially, but the decay rate is lower for 1-6 hour leads. Golding (2000) uses either spatial correlation or NWP wind profile information for estimating the velocity scales for advection, whichever improves the forecast at analysis time. Browning and Collier (1989) mention that the use of measured or NWP wind has not been conclusively proven to improve advection forecasts.We mentioned that NWP-MOS studies, which linearly regress NWP outputs with point rainfall, have discovered that QPF from NWP is not the most important predictor (Antolik, 2000). Precipitation exhibits high spatial variability, and NWP models do not predict QPF as well as atmospheric variables (Mesinger, 1996). Regression relations between atmospheric variables (or, instability indices) and convective rainfall have been reported (Zawadzki et al., 1981). Peppler and Lamb (1989) reported regression relations for "growing season" rainfall, where convective and stratiform regimes might not be easily separable. These results, when viewed together, appear to suggest that while a simple disaggregation of NWP-QPF in space might have limited predictive power for distributed QPF, forecasts of atmospheric state variables and instability indices from NWP could have additional information content, especially in convective situations. This possibility is also suggested from the results of Perica and Foufoula-Georgiou (1996), and Nakakita et al. (1996). However, previous researchers (e.g., Grecu and Krajewski, 2000) acknowledge that precipitation physics at distributed scales is not too well understood, and existing models for convective processes often rely on simplifying assumptions and parameterizations (Smith and Austin, 2000). In a nutshell, previous research seems to strongly indicate that there is information in NWP model outputs other than QPF (e.g., forecasts of atmospheric variables) that could potentially be exploited to improve distributed QPF. However, how best to exploit this information remains an open research area.
3.5 Meteorological and Hydrological Approaches to Distributed QPF
The meteorological community has been improving NWP models continuously. There is a belief that better NWP models, faster computer speeds, and better data assimilation techniques that use (for example) radar measurements to initialize or "nudge" NWP models, could be sufficient to improve distributed QPF. We agree with Golding (2000) that data assimilation or initialization with distributed measurements would not make up for the inability of the NWP models to handle localized subgrid scale processes like convection. One line of argument is that NWP model resolutions and convective (and orographic) parameterizations would improve in the future, thus the best approach would be to estimate the parameters of the NWP models themselves (e.g., using discrete filter formulations) from radar measurements. We believe that given the spectrum of spatial and temporal scales at which rainfall processes could occur, the disparity between the resolutions of NWP models and measurement devices like radar would continue to exist. To circumvent this, the meteorological community has often developed hybrid models that combine extrapolation techniques with NWP-QPF (Golding, 2000; Kryzysztofowicz, 1999; Browning, 1979).The value of NWP model outputs for distributed QPF is yet to be generally acknowledged or proven, and the physics of precipitation is not too well understood at distributed scales. Thus a line of argument could be that data dictated models alone (e.g., based on traditional statistics, fractal schemes, or ANN) would be best in these situations. The hydrologic community has often used different mathematical or stochastic approaches to describe and forecast aspects of rainfall structure and evolution. For example, Johnson and Bras (1980) proposed a new technique to
forecast rainfall in space and time using rain gage information, while Rodriguez-lturbe and Eagleson (1987) developed stochastic models to describe rainfall structures in space and time. However, previous studies of advection (Grecu and Krajewski, 2000) and nowcasting (Smith and Austin, 2000; Tsonis et al, 1981) demonstrate that complex data dictated tools might not be best to model certain component processes of precipitation. For example, the lack of improvement in distributed QPF from direct application of these tools (Browning and Collier, 1989; Grecu and Krajewski, 2000) indicate that complex data dictated methods by themselves, either fail to significantly improve estimates for velocity scales in advection, and/or fails to model the dynamics of the distributed precipitation evolution.
Finally, given the fact that the value of NWP model outputs for distributed QPF is an open research area, the use of NWP model outputs as surrogate measurements could be questioned. Krishnamurti et al. (1999) have shown that combining the results of different NWP models based on relative skills (a "multimodel superensemble") could improve forecasts at NWP resolutions. The work of researchers like Kuligowski and Barros (1998a) suggest that post-processing of NWP model outputs using statistical methods could have value in distributed QPF applications.
4.0 Data Analyses and Investigation of QPF Strategies
In this section, we analyze the data from NWP and radar and outline the results of our investigative studies to distributed QPF processes and strategies. These confirm insights of past researchers described in the previous chapter, and suggests new ones.
The studies carried out here could be broken down into three broad categories: * Analysis of Information Content in the Available Data
* Analysis of Distributed Precipitation Processes and Strategies " Applicability of Parameterized, Physically Based Models
These studies were designed to explore the potential value of the available strategies in their present form for distributed QPF, given the nature of the available data. The insights gained from these analyses were used to formulate a hybrid strategy for distributed QPF, which is described in later sections.
4.1 Analysis of Information Content in the Available Data
Two sources of information were considered in this research, distributed precipitation estimates from radar, and space-time averaged NWP model outputs for precipitation and atmospheric variables. The behavior of radar measurements with time, both in terms of their aggregate statistics and distributed structure, was explored. Correlation studies were carried out to explore the relationship of NWP model outputs to aggregated radar rainfall.
4.1.1 Analysis of Hourly Radar Rainfall
Spatially aggregate statistics of the hourly radar rainfall, as a function of time, were investigated. Uncalibrated Stage I radar rainfall was used for events in Topeka, Kansas, while calibrated Stage Ill radar rainfall from the ABRFC region in Oklahoma was used. We looked at the spatial mean of the radar map and the variance around this mean. Data analyses on hourly radar rainfall demonstrate the non-stationary nature, both in terms of the spatial mean and the variance around this mean. These were calculated at each hourly time step using the precipitation intensities of individual pixels. The hourly distributed precipitation maps show minimal persistence, but exhibit relatively higher skills upon advection, especially in the Winter. The skills are more evident in terms of the spatially aggregate statistics of the distributed rainfall.
Figure 4-1 uses a Summer and a Winter precipitation event, and demonstrates the non-stationarity in the rainfall process in terms of both the spatial mean, and the variance around this mean, as a function of the lead time in hours. Figure 4-2 show the spatially aggregate mean from radar, and the corresponding forecasts obtained from
information is preserved in hourly rainfall maps, with or without translation. While significant information is not preserved in either case, advection does show more skill than simple persistence in terms of the aggregate statistics. The skills are worse in terms of the distributed measures. Figure 4-3 shows the lack of distributed skills from either persistence or translation for hourly QPF. The distributed skill was quantified in terms of the Root Mean Squared Errors (RMSE) normalized by the standard deviation of the verification data.
Both the mean and the variance showed significant non-stationarity in the 1-6 hour range. The non-stationarity was higher in the Summer than in the Winter. The hourly radar maps showed limited persistence, both in an Eulerian or in a Lagrangian sense (i.e., after advection), especially in the Summer. The large changes in aggregate statistics could indicate the influence of large scale precipitation processes. The lack of persistence, whether in an Eulerian or in a Lagrangian sense, could indicate the possibility of localized processes.
In general, we observed that radar advection performed better in the Winter than in the Summer, especially with respect to the overall distributed error measure (i.e., the NMSE when all pixels were considered) and in terms of the aggregate error measure (i.e., the error in the spatial mean). However there were a few situations, more predominant in the Winter, when the advection forecasts missed the rainfall areas almost completely. An overall distributed error measure, given raining conditions, was obtained by considering pixels with non-zero rainfall only (for the NMSE calculations). In terms of this NMSE for "wet" pixels only, skills from advection and persistence were comparable in the Winter, but advection performed slightly worse in the Summer.
Figure 4-1:Spatial Mean & Variance of Rain as a function of Time in Hours
Radar Rain Spatial Mean Sep 25, 1998
1 2 3 4
Lead Time (h) Figure a: Spatial Mean of Radar Rainfall (mm/h) for an event in the
Winter as a function of lead time in hours.
1,
C
5
Radar Rain Spatial Mean May 6~ 19~8
J / \ A 4 / A' 0.2 1 2 3 4 Lead Time (h) Figure c: Spatial Mean of Radar Rainfall (mm/h) for an event in the Summer as a function of lead time in hours.
5
Radar Rain Spatial Variance Sep 25, 196
5
1 23 4
Lead Time (h)
Figure b: Spatial Variance of Radar Rainfall (around the mean) for an event in the Winter as a function of lead time in hours. 10 8 0 U C 6 4
Radar Rain Spatial Variance May 6 1998 1. I.
/
/I-I
/ L / N *'N. 1 2 3 4 Lead Time (h)Figure d: Spatial Variance of Radar Rainfall (around the mean) for an event in the Summer as a function of lead time in hours. E 0.4 0.3 0.2 *1 E 0A0 0.6 0.4
Figure 4-2: Spatial Mean of Radar Rainfall, Persistence and Advection
UIJ I 2-- Persistence L
0
~1 2 3 4 5
Figure a: Spatial Mean of Radar Rainfall Rainfall (mm/h), Persistence, and
Advection, for a precipitation event as a function of hourly lead. A Winter event.
-
--0.4
1 2 3 4 5
Figure c: Spatial Mean of Radar Rainfall Rainfall (mm/h), Persistence, and
Advection, for a precipitation event as a function of hourly lead. A Summer event.
30 10 U
I
o
.1 0 1! A 2 34
aFigure b: Percent error in the spatial mean from Advection and Persistence, for a precipitation event, as a function of lead time in hours. A Winter event. ice
)n0
100
nfall
1 2 3 4 5
Figure d: Percent error in the spatial mean from Advection and Persistence, for a precipitation event, as a function of lead time in hours. A Summer event. I
K
K Advection Radar Rainfall Advecti Radar Rai MIt 0'( 0.9Figure 4-3: Distributed Skills in Persistence and Advection for Hourly Rainfall (NMSE and Wet-NMSE)
NoImalized Mean Squared Error: All Pixels Normalized Mean Squared E'or Wet Pixels
.6
2
I
1 2 3 4
Figure a: A Winter event. RMSE normalized by the variance of the
verification data (NMSE) for all radar pixels, as a function of lead in hours.
Normalized Mean Squared Error. All Pixels
181
1.4 12 2 3 5 1.4 1.3 1.2 1 4Figure c: RMSE normalized by the variance of the verification data (NMSE) for all radar pixels, as a function of the lead time in hours. A Summer event.
PersistenceA
- Advectio~n
Normalized Mean Squared Error Wet Pixels
2 3 4 5 Persistence Advection 5 2 116 1~4 1 2 3 4
Figure b: A Winter event. NMSE for raining pixels, as a function of the lead time in hours. Provides a measure of the skills, given rain.
Advection
Persistence
Figure d: NMSE for raining pixels, as a function of the lead time in hours. Provides a measure of the distributed skills, given rain. A Summer event. Persistence
4.1.2 Analysis of Information Content in NWP Model Outputs
Radar rainfall was aggregated up both in space (e.g., 4 km to 48 km) and in time (e.g., 1 hour to 6 hours). We used high quality Stage III radar rainfall in the ABRFC in Oklahoma and the 48-km Eta model outputs. Table 4-1 shows how well the variability in aggregate radar rainfall is explained by (a) NWP-QPF alone and (b) by all NWP model outputs, which include QPF and atmospheric variables. The atmospheric variables used were LI (Lifted Index), T (Temperature at 3 Layers), P (Sea Level Pressure), RH (Average Relative Humidity), u and v (Wind Velocity), o (Vertical Velocity). The results are shown for the Summer and for the Winter, using both linear and nonlinear (ANN) techniques. We analyzed the residuals from ANN based regression, and compared with the analysis of residuals from linear regression, to understand the usefulness of nonlinear strategies. The ANN used were standard Multi-Layer Perceptrons (MLP), the parameters and configuration of which were determined from data analysis (see Bishop, 1996; Jordan & Bishop, 1996). Classification of storm events into "Summer" and "Winter" improved the linear correlation estimates. The information content in all NWP model outputs was found to be higher than that in NWP-QPF alone. The information content in NWP-QPF alone was found to be higher in the Winter than in the Summer. On the whole, these results agreed with NWP-MOS studies (Antolik, 2000). The results of our data analyses also showed that while the information in NWP-QPF was insignificant in the Summer, NWP forecasts of atmospheric variables had significant information content. The degree of non-linearity (as quantified by the performance of linear regression versus ANN algorithms, see Appendix A) was seen to be higher in the Summer. Nonlinear ANN techniques (see Appendix A) did not improve
over linear methods in the Winter, and "optimally trained" ANN were obtained at a very small number of "epochs" (Bishop, 1996), indicating limited nonlinearity in the Winter. In the Summer, the degree of nonlinearity was higher. This is to be expected, as convective and other nonlinear processes are expected to dominate in the Summer. One other interesting observation from these analyses was that when all NWP model outputs (QPF and atmospheric variables) were used, the variability in aggregated radar rainfall could be better explained in the Summer than in the Winter. In contrast during the Winter NWP model outputs beyond QPF did not improve predictability. We also observed that the degree of nonlinearity (as indicated by improvements resulting from ANN) was higher when all NWP model outputs were used, compared to when only
NWP-QPF was used (except for Winter).
We performed a sensitivity analysis using NWP outputs. When all seasons were combined, NWP-QPF, Top and Middle Layer Temperature, Lifted Index, and Vertical Velocity, in that order, were most useful. In the Summer, the most influential were Top, Middle, and Bottom Layer Temperature, and Vertical Velocity, in that order. This indicates the dominance of convective processes. The other influential variables, with less influence than the previous ones, were QPF and Relative Humidity, in that order. This suggests that the QPF produced from NWP in the Summer retains minimal information. In the Winter, QPF was most influential. This indicates that at the lower NWP resolutions, the QPF from NWP is fairly useful in the Winter. The other variables with some information were Bottom Layer Temperature, Pressure, and Vertical Velocity, in that order.