HAL Id: hal-02987157
https://hal.archives-ouvertes.fr/hal-02987157
Submitted on 19 Apr 2021HAL is a multi-disciplinary open access archive for the deposit and dissemination of sci-entific research documents, whether they are pub-lished or not. The documents may come from teaching and research institutions in France or abroad, or from public or private research centers.
L’archive ouverte pluridisciplinaire HAL, est destinée au dépôt et à la diffusion de documents scientifiques de niveau recherche, publiés ou non, émanant des établissements d’enseignement et de recherche français ou étrangers, des laboratoires publics ou privés.
Petrology and Geochemistry of Calcite Veins: An
Example from the Southern Pyrenees
Daniel Muñoz-López, David Cruset, Irene Cantarero, Antonio Benedicto,
Cédric John, Anna Travé
To cite this version:
Daniel Muñoz-López, David Cruset, Irene Cantarero, Antonio Benedicto, Cédric John, et al.. Fluid Dynamics in a Thrust Fault Inferred from Petrology and Geochemistry of Calcite Veins: An Example from the Southern Pyrenees. Geofluids, Wiley, 2020, 2020, pp.1-25. �10.1155/2020/8815729�. �hal-02987157�
Research Article
Fluid Dynamics in a Thrust Fault Inferred from Petrology and
Geochemistry of Calcite Veins: An Example from the
Southern Pyrenees
Daniel Muñoz-López
,
1David Cruset,
2Irene Cantarero
,
1Antonio Benedicto,
3Cédric M. John,
4and Anna Travé
11Departament de Mineralogia, Petrologia i Geologia Aplicada, Facultat de Ciències de la Terra, Universitat de Barcelona (UB),
Martí i Franquès s/n, 08028 Barcelona, Spain
2Group of Dynamics of the Lithosphere (GDL), Geosciences Barcelona, GEO3BCN-CSIC, Lluís Solé i Sabarís s/n,
08028 Barcelona, Spain
3UMR CNR GEOPS, Université Paris-Saclay, 91405 Orsay, France
4Department of Earth Science and Engineering, Imperial College London, London SW7 2BP, UK
Correspondence should be addressed to Daniel Muñoz-López; munoz-lopez@ub.edu
Received 8 April 2020; Revised 10 August 2020; Accepted 2 September 2020; Published 25 September 2020 Academic Editor: Paul D. Bons
Copyright © 2020 Daniel Muñoz-López et al. This is an open access article distributed under the Creative Commons Attribution License, which permits unrestricted use, distribution, and reproduction in any medium, provided the original work is properly cited.
Petrographic and geochemical analyses (δ18O,δ13C,87Sr/86Sr, clumped isotopes, and elemental composition) coupled withfield
structural data of synkinematic calcite veins, fault rocks, and host rocks are used to reconstruct the episodic evolution of an outstanding exposed thrust zone in the Southern Pyrenees and to evaluate the fault behavior as a conduit or barrier tofluid migration. The selected thrust displaces the steeply dipping southern limb of the Sant Corneli-Bóixols anticline, juxtaposing a Cenomanian-Turonian carbonate unit against a Coniacian carbonate sequence. Successive deformation events are recorded by distinct fracture systems and related calcite veins, highlighting (i) an episodic evolution of the thrust zone, resulting from an upward migration of the fault tip (process zone development) before growth of the fault (thrust slip plane propagation), and (ii) compartmentalization of the thrust fault zone, leading to different structural and fluid flow histories in the footwall and hanging wall. Fractures within the footwall comprise three systematically oriented fracture sets (F1, F2, and F3), each sealed by a separate generation calcite cement, and a randomly oriented fracture system (mosaic to chaotic breccia), cemented by the same cements as fracture sets F1 and F2. The formation of fractures F1 and F2 and the mosaic to chaotic breccia is consistent with dilatant fracturing within the process zone (around the fault tip) during initial fault growth, whereas the formation of the latest fracture system points to hybrid shear-dilational failure during propagation of the fault. The continuous formation of different fracture systems and related calcite cementation phases evidences that the structural permeability in the footwall was transient and that thefluid pathways and regime evolved due to successive events of fracture opening and calcite cementation. Clumped isotopes evidence a progressive increase in precipitation temperatures from around 50°C to 117°C approximately, interpreted as burial increase linked to thrust sheet emplacement. During this period, the source offluid changed from meteoric fluids to evolved meteoricfluids due to the water-rock interaction at increasing depths and temperatures. Contrary to the footwall, within the hanging wall, only randomly oriented fractures are recognized and the resulting crackle proto-breccia is sealed by a later and different calcite cement, which is also observed in the main fault plane and in the fault core. This cement precipitated from formation fluids, at around 95°C, that circulated along the fault core and in the hanging wall block, again supporting the interpretation of compartmentalization of the thrust structure. The integration of these data reveals that the studied thrust fault acted as a transverse barrier, dividing the thrust zone into two separate fluid compartments, and a longitudinal drain for migration offluids. This study also highlights the similarity in deformation processes and mechanisms linked to the evolution of fault zones in compressional and extensional regimes involving carbonate rocks.
1. Introduction
The study of outcrop analogues in fractured carbonate reser-voirs is important to better understand the characteristics and evolution of synkinematic fracture systems and their control on fluid migration during crustal deformation [1– 4]. In areas undergoing compressional regimes, the largest fluid fluxes, mass transfer, and heat transport commonly occur along the main thrust faults and related fracture net-works because of the loading induced by thrust sheet emplacement [5–7]. By contrast, fluid flow rates in adjacent rock-matrix and poorly connected synkinematic fractures are commonly very low and fluid composition are often rock-buffered [6, 8]. In some cases, the development of thrust systems may also inhibit vertical fluid transport inducing fluid overpressure [9–11] leading to hydraulic fracturing [12–14]. Whether a fault zone will constitute either a conduit or barrier tofluid migration depends, among other factors, on the architecture of the fault zone and the permeability associated with the developed structures [15, 16]. Since the fault zone consists of a fault core, which is usually formed of low-permeability fault rocks, and a damage zone, which mainly includes extensional fractures and faults, overall per-meability of the fault is conditioned by the amount, the spa-tial distribution, and the internal composition of these two fault zone elements [15, 17]. Besides, such structural perme-ability is dynamic and may vary spatially and temporally across the fault zone due to successive episodes of fracture opening and cementation [18, 19].
Although numerous studies based primarily on structural and numerical data have provided conceptual and analytical models on the architecture, mechanical properties, andfluid flow along fault zones [7, 15, 20], there exist only a few stud-ies coupling field data and geochemistry of synkinematic mineralsfilling fractures that characterize the fluid migration through a thrust zone [21–25] and its spatial behavior as a conduit or barrier system [26, 27]. An outstanding exposed thrust in the Southern Pyrenees was chosen as a case study to evaluate qualitatively the fault-related permeability and its control on thefluid flow within and around the fault zone. Here, we combine structural, petrological, and geochemical data of calcite veins and host rocks present in the studied thrust zone. Therefore, the main objectives of this paper are (i) to determine the origin, composition, and temperature of the vein-formingfluids and the timing of fluid migration in relation to the fracturing events and (ii) to discern thefluid pathways, the extent offluid-rock interaction, and the transfer offluids across a fault zone during thrusting. The field and lab results are then compared with other studies reportingfluid flow within fault zones in other geological settings to general-ize our conclusions to fault zones in carbonate settings.
2. Geological Setting
The Pyrenees constitute an asymmetrical and doubly verging orogenic belt that resulted from the Alpine convergence between the Iberian and European plates from Late Creta-ceous to Oligocene, causing the inversion of previous Meso-zoic rift basins and their incorporation into the thrust
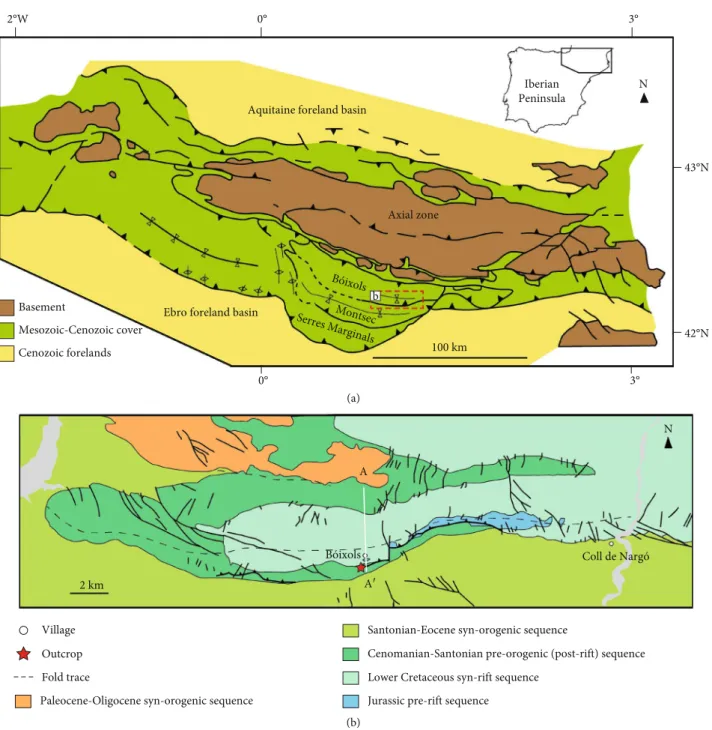
system [28–32]. The Pyrenean structure consists of a central antiformal stack of basement-involved thrust sheets from the axial zone [30],flanked by two oppositely vergent fold-and-thrust belts and their related Cenozoic Aquitaine and Ebro foreland basins [30, 33] (Figure 1(a)).
The South Pyrenean fold-and-thrust belt comprises a piggy-back imbrication of south verging and east-west strik-ing thrust sheets involvstrik-ing Mesozoic and Tertiary cover rocks detached above Late Triassic evaporites [34] and transported southwards over the Ebro foreland basin. From north to south, they are the Bóixols thrust sheet, emplaced during the Late Cretaceous to Paleocene, the Montsec thrust sheet, originated during the Paleocene to late Ypresian, and the Serres Marginals thrust sheet, formed during the Lutetian-Oligocene [35, 36] (Figure 1(a)). In the frontal part of the Bóixols thrust sheet, a south verging and east-west trending fault-related anticline developed in relation to the propaga-tion of the Bóixols thrust (the Sant Corneli-Bóixols anticline; Figures 1(b) and 1(c)). It is characterized by a gently dipping northern backlimb and a vertical to overturned southern forelimb [37].
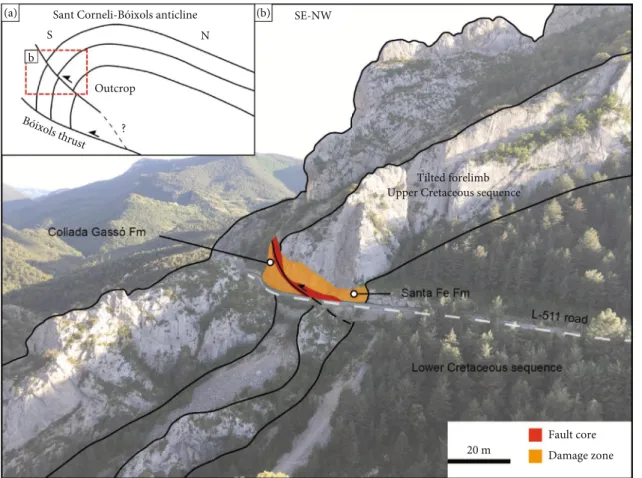
Rocks cropping out along the Bóixols anticline comprise a large stratigraphic record ranging in age from Jurassic to Oligocene and deposited during the main tectonic events that affected the study area [38] (Figures 1(b) and 2). The strati-graphic sequence includes prerift Jurassic limestones and dolostones, synrift Lower Cretaceous limestones, marls and clays, preorogenic (postrift) Late Cenomanian to Santonian limestones, sandy limestones and marls and synorogenic Late Santonian to Oligocene marls and clays, sandstones, sandy limestones, and conglomerates ([38] and references therein). In the central part of this anticline, the southern tilted fore-limb is offset by minor low-dipping south-directed thrusts developed after the main folding phase, as evidenced by the displacement of already folded beds [38–40]. Therefore, they have been interpreted as postfolding accommodation struc-tures or as hanging wall splays of the main Bóixols thrust [39, 40, 42]. One of these minor thrust faults is well exposed 2 km southeast of the Bóixols village (15 km of the L511 road), in the southern-central Pyrenees (Figure 3), exhibiting a com-plex calcite-filled fracture network developed in the fault core and damage zone of both the footwall and hanging wall of this reverse fault. This outcrop represents an exceptionalfield ana-logue to observe in a 300 m long outcrop the variation in deformation mechanisms developed across a fault zone and its contribution as seal or conduit forfluids. In this area, the studied thrust juxtaposes the Upper Cretaceous Santa Fe For-mation against the Collada Gassó ForFor-mation (Figures 2 and 3). The Collada Gassó Formation [43] is formed of Coniacian grainstones with the variable presence of quartz, marly lime-stones, and limestones with abundant fossil content and has a general thickness of 150 to 250 m [38]. The Santa Fe Forma-tion [44] is basically constituted of Cenomanian-Turonian limestones with a general thickness of 20 m [38].
3. Methodology
This study combinesfield structural data, including bedding and fracture orientation and dips, fracture type identification,
Aquitaine foreland basin Axial zone Iberian Peninsula N Basement Mesozoic-Cenozoic cover
Ebro foreland basin
Cenozoic forelands Montsec Serres Marginals 100 km b (a) A N A′ 2 km
Paleocene-Oligocene syn-orogenic sequence Village
Outcrop
Jurassic pre-rift sequence
Santonian-Eocene syn-orogenic sequence
Cenomanian-Santonian pre-orogenic (post-rift) sequence Lower Cretaceous syn-rift sequence
Fold trace
(b)
kinematics, and crosscutting relationships, with petrological and geochemical analyses. Structural data were plotted in equal-area lower-hemisphere projections, and different frac-ture sets were established according to their type, strike, orien-tation respect to bedding, mineral infillings, and relative age deduced from crosscutting relationships. Representative sam-ples of each fracture generation and related host rocks were sampled in order to perform petrological and geochemical analyses. Thin sections were prepared and studied under opti-cal and cathodoluminescence microscopes at the Facultat de Ciències de la Terra of the Universitat de Barcelona, using a Zeiss Axiophot optical microscope and a Technosyn Cold Cathodoluminescence microscope, model 8200 Mk5-1 oper-ating between 16–19 kV and 350 μA gun current.
Thirty-one samples of calcite cements and host rocks were sampled for carbon and oxygen isotopic analysis using a 500μm-diameter dental drill. Around 50-100 μg of each sample was reacted with 100% phosphoric acid for two minutes at 70°C. The resultant CO2 was analyzed with an automated Kiel Carbonate Device attached to a Thermal Ion-ization Mass Spectrometer Thermo Electron MAT-252 (Thermo Fisher Scientific) following the method of [45]. The International Standard NBS-18 and the internal stan-dard RC-1, traceable to the International Stanstan-dard NBS-19, were used for calibration. The standard deviation is ±0.03‰ for δ13C and ±0.05‰ for δ18O expressed with respect to the VPDB standard (Vienna Pee Dee Belemnite). Analyses were carried out at“Centre Científics i Tecnològics” of the Universitat de Barcelona (CCiTUB).
The elemental composition of the calcite cements and related host rocks (12 samples in total) was analyzed with a high-resolution inductively coupled plasma-mass spectrom-eter (HR-ICP-MS, model Element XR, Thermo Fisher Scien-tific). Around 100 mg of each sample was extracted with a 400/500μm-diameter dental drill, and then, powdered sam-ples were dried at 40°C for 24 h. Then, 100 mg of sample
was acid digested in closed polytetrafluoroethylene (PTFE) vessels with a combination of HNO3+ HF + HClO4
(2.5 mL : 5 mL : 2.5 mLv/v). The samples were evaporated, and 1 mL of HNO3was added to make a double evaporation. Finally, the samples were redissolved and diluted with Milli-Q water (18.2 MΩ cm-1) and 1 mL of HNO3in a 100 mL vol-umeflask. In order to improve the sensitivity of the ICP-MS, a tuning solution containing 1 g L-1Li, B, Na, K, Sc, Fe, Co, Cu, Ga, Y, Rh, In, Ba, Tl, and U was used, and as internal standard, 20 mg L-1 of a monoelemental solution of 115In was used. Reference materials are the BCS-CRM no. 393 (ECRM 752-1) limestone, JA-2 andesite, and JB-3 basalt. The precision of the results was expressed in terms of two standard deviations of a set of eight reference material mea-surements (reference material JA-2), whereas accuracy (%) was calculated using the absolute value of the difference between the measured values obtained during the analysis and the certified values of a set of eight reference material analysis (reference material BCS-CRM no. 393 for major oxides and JA-2 for trace elements). The detection limit (DL) was calculated as three times the standard deviation of the average of ten blanks. Analyses were performed at the Geochemistry Facility of labGEOTOP of Geoscience Barce-lona (GEO3BCN-CSIC).
The 87Sr/86Sr isotope ratios were analyzed in calcite cements and host rocks (9 samples). Powdered samples were fully dissolved in 5 mL of 10% acetic acid. After centrifuga-tion, the supernatant was dried and dissolved in 1 mL of 1 M HNO3. The resulted solid residue, generated after evap-oration, was diluted in 3 mL of 3 M HNO3and loaded into chromatographic columns to separate the Rb-free Sr fraction, by using SrResin™ (crown-ether (4,4′(5′)-di-t-butylcyclo-hexano-18-crown-6)) and 0.05 M HNO3 as eluent. After evaporation, samples were loaded onto a Re filament along with 1μL of 1 M phosphoric acid and 2 μL of Ta2O5. Isotopic ratio analyses were carried out in a TIMS-Phoenix mass
A′ A
2000 m 1000
0 m
Village
Jurassic pre-rift sequence
Cenomanian-Santonian pre-orogenic (post-rift) sequence
Lower Cretaceous syn-rift sequence Fold trace
(c)
Figure 1: (a) Simplified geological map of the Pyrenees (modified from [32]). (b) Geological map of the Sant Corneli-Bóixols anticline showing the studied outcrop (modified from [38, 39]). (c) N-S cross section of the Sant Corneli-Bóixols anticline (modified from [40]). Location is shown in (b).
spectrometer (Isotopx) following a dynamic multicollection method, during 10 blocks of 16 cycles each one, maintaining a88Sr beam intensity of 3-V. Isotopic ratios were corrected for 87Rb interferences and normalized using the reference
value of88Sr/86Sr = 0:1194, in order to correct for the possible mass fractionation during loading and analysis of the sample. During sample analysis, the isotopic standard NBS-987 was analyzed six times, yielding an average value of 0:710243 ± Oligocene Eocene Paleocene Maastrichtian Campanian Santonian Coniacian Turonian Cenomanian Albian Aptian Barremian Neocomian Malm Dogger Lias Keuper Triassic Paleozoic basement Muschelkalk Buntsandstein Cenozoic Cretaceous Jurassic Synrift Prerift Postrift Synorogenic Maximum thickness (m) Formation Santonian 600 250 120 Congost Sant Corneli Reguard Pardina Santa Fe 20 25 20 Cenomanian Turonian Coniacian Conglomerate Sandstone Lutite Dolomite Limestone Reef limestone Breccia Evaporite Volcanic rock Ophite Basement rock Rudists Ammonites Pithonella
Figure 2: Chronostratigraphic diagram showing the main stratigraphic sequences and their related tectonic event [41]. The preorogenic (postrift) sequence, where the thrust was emplaced, is colored in green. The right panel shows a detail of the formations forming this sequence. Thickness and age of these formations are based on [38].
0:000009 (standard deviation, 2σ). NBS 987 data have been used to correct the sample ratios for standard drift from the certified value. The analytical error in the 87Sr/86Sr ratio, referred to two standard deviations, was 0.01%, whilst the internal precision is 0.000003. Sr procedural blanks were always below 0.5 ng. Analyses were carried out at the“CAI de Geocronología y Geoquímica Isotópica” of the Universi-dad Complutense de Madrid.
The143Nd/144Nd isotope ratios were also analyzed in cal-cite cements and host rocks (9 samples in total). Samples were weighed in Teflon® vessels, with enriched spike solution (149Sm-150Nd, Oak Ridge) and dissolved in 5 mL of ultrapure HF and 3 mL of ultrapure HNO3 (Merck-Suprapur™). The PFA vessels were placed for 65 hours into an oven at 120°C. Then, cold vials were evaporated on a heat plate at 120°C. 4 mL of distilled 6N HCl was added to the dried samples and placed in an oven overnight at 120°C. The resulted solid residue, generated after evaporation, was dissolved in 3 mL of distilled and titrated 2.5N HCl. In order to separate the dissolved fraction from the residue, if any, samples were centrifuged for 10 minutes at 4000 rpm. Chromatographic separation of the total group of REE was performed using cation exchange resin DOWEX 50W-X8 200-400 mesh (pre-viously calibrated). Then, recovered REE fractions were completely dried and again dissolved in 200μL 0.18N HCl. These solutions were passed in a new chromatographic step (Ln-resin) in order to obtain a complete separation between the Nd and the Sm fractions (using 0.3N HCl and 0.4N
HCl as eluent, respectively). Dried Sm and Nd samples dis-solved with 2μL of 0.05 M phosphoric acid were loaded onto a side rhenium (Re)filament of a triple Re filament arrange-ment. Nd ratios were analyzed in a mass spectrometer TIMS-Phoenix®, following a dynamic multicollection method, through 160 cycles at a stable intensity of 1 V for the144Nd mass. In turn, Sm ratios were analyzed in the same spectrom-eter, following a single static method through 112 cycles maintaining 1 V intensity for the149Sm mass. Nd measure-ments were corrected for possible142Ce and144Sm interfer-ences and they were normalized to a constant ratio of
146Nd/144Nd = 0:7219 to correct the possible mass
fraction-ation during the processes of loading and analyzing at the TIMS. Nd isotopic standard JNdi-1 was checked along with the samples to correct the sample ratios for standard drift from the certified value. The analytical error (2STD) in the 147Sm/144Nd ratio was 0.1% and in the 143Nd/144Nd ratio was 0.006%. Procedural blanks were always below 0.1 ng. Analyses were performed at the“CAI de Geocronolo-gía y Geoquímica Isotópica” of the Universidad Complutense de Madrid.
Clumped isotope thermometry was applied to four repre-sentative samples of the calcite cements Cc1 to Cc4 in order to determine the temperature and δ18Ofluidin ‰VSMOW of the vein-formingfluids. Around 2–3 mg aliquots of pow-dered calcite cements was measured with an automated line developed at Imperial College London (the Imperial Batch Extraction system, IBEX). Samples were dropped in 105% Outcrop ? S N b (a) (b) SE-NW Tilted forelimb Upper Cretaceous sequence
20 m
Fault core Damage zone
phosphoric acid at 90°C and reacted for 30 minutes. The reactant CO2 was separated with a Poropak Q column and transferred into the bellows of a Thermo Scientific MAT 253 mass spectrometer. The characterization of a single rep-licate consisted of 8 acquisitions in dual inlet mode with 7 cycles per acquisition. The total time of analysis per replicate is ~2 hours, and each sample was replicated at least 3 times. The postacquisition processing was completed with software for clumped isotope analyses (Easotope) [46]. During phos-phoric acid digestion,Δ47 values were corrected for isotope
fractionation with a phosphoric acid correction of 0.069‰ at 90°C for calcite [47]. The data were also corrected for non-linearity applying the heated gas method [48] and projected into the reference frame of [49]. Carbonateδ18O values were calculated with the acid fractionation factors of [50]. Results were converted to temperatures applying the calibration method of [51]. Calculatedδ18Ofluidvalues are expressed in ‰ with respect to the Vienna Standard Mean Ocean Water (VSMOW).
4. Results
4.1. Nature of Host Rocks. In the study area, two Upper Cre-taceous sequences are present [38, 42]: the Collada Gassó Formation, located in the footwall, and the Santa Fe Forma-tion, located in the hanging wall.
The Collada Gassó Formation consists of massive to well-bedded dark grey to brown limestones with an E-W orientation and dipping 80° towards the north. The lime-stones consist of grainlime-stones made up of bivalves, gastropods, echinoids, bryozoans, corals, miliolids, partially to totally micritized components (i.e., peloids), and locally quartz grains. The inter- and intraparticle porosity is cemented by calcite cement (Cc0) (Figure 4(a)). Under cathodolumines-cence, the skeletal components show a dull to bright brown color, whereas the inter- and intraparticle calcite cement (Cc0) displays a bright yellow color (Figure 4(b)). This for-mation is characterized by the widespread presence of bedding-parallel compaction stylolites, developed during progressive burial prior to deformation.
The Santa Fe Formation consists of a massive succession of grey limestones with an E-W orientation and dipping 80– 85°towards the north. The limestones are made up of wack-estones, locally packstones, with a notably presence of calci-spheres and planktonic foraminifera (Figure 4(c)). Under cathodoluminescence, it exhibits a very dark orange color (Figure 4(d)).
4.2. Fault Zone Structure. The studied fault zone exhibits a classical fault organization with a main slip plane, a fault core, and two surrounding damage zones within the footwall and hanging wall, respectively (Figures 5 and 6). The slip plane (a) 1 mm b (a) (b) 1 mm (b) Matrix Vein (c) 1 mm d (c) (d) 1 mm (d)
Figure 4: (a, b) Plane-polarized light and cathodoluminescence microphotographs of the footwall host rocks consisting of a grainstone made up of corals (c), foraminifers (f), bivalves (b), echinoids (e), and peloids (p), cemented by calcite (Cc0). (c, d) Plane-polarized light and cathodoluminescence microphotographs of the hanging wall host rocks composed of a wackestone of calcispheres and planktonic foraminifera.
Protolith Damage zone Fault core Damage zone Protolith Systematically oriented calcite veins
F1
F2
10 m
F3
b
Stylolites Randomly oriented calcite veinsRandomly oriented calcite veins
c d S - N Bedding (a) (a) Bed-parallel stylolites Figure 6(b) Figure 6(c) Figure 6(a) F1 F3 1 m (b) F2 (b) Sigmoidal lenses Hanging wall Figure 6(f) Figure 6(e) Fault core
Randomly oriented calcite veins
Footwall Figure 6(d) (c)
(c)
Figure 6(f)
Randomly oriented calcite veins (d)
(d)
Figure 5: (a) Sketch of the spatial distribution of veins within the outcrop. In the footwall, three systematically oriented vein systems (F1 to F3) (b) evolve to randomly oriented veins located next to the fault core (c). In the hanging wall, only randomly oriented veins are observed (d).
locates immediately below the fault core (Figure 5(a)), strikes E-W, dips between 15 and 30°N, and has a displacement of several hundred meters juxtaposing the
Cenomanian-Turonian sequence of the hanging wall against the Coniacian succession of the footwall [38, 42] (Figures 3 and 5). The fault core overlying the slip plane consists of a 2 to 7 m thick, light
Vein orientation Field observation
F1 F2 In cr ea se in v ein den si ty t o wa rd s t h e fa ul t co re (a) (b) + n = 8 n = 10 n = 30 n = 7 (c) (d) Randomly oriented calcite veins. Mosaic to chaotic breccia
Randomly oriented calcite veins. Crackle proto-breccia F o o twall Fau lt c o re H an gin g wall Thrust F3 + (e) (f) 𝜎1 𝜎3 𝜎2 𝜎3 𝜎1 𝜎2 + F1 F3 F2 Stylolites F3 F1
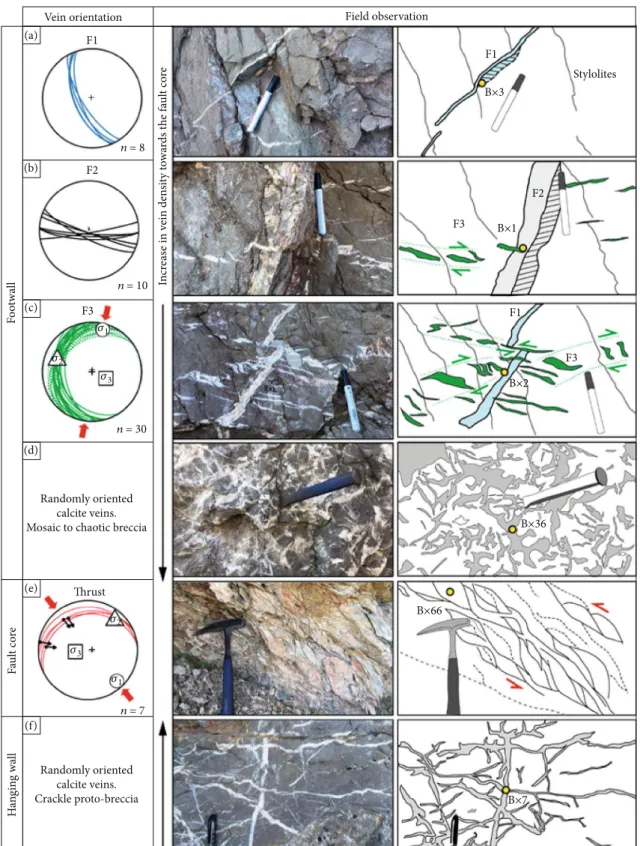
Figure 6: Spatial distribution and crosscutting relationships between veins developed within the studied thrust zone. Vein density increases towards the fault plane. In the footwall, three vein systems (F1, F2, and F3) (a, b, and c, respectively) evolve to randomly oriented veins (d) on approaching the fault core (e). In the hanging wall, only randomly oriented veins are observed, being more chaotic towards the fault plane (f). The yellow circle refers to sample location.
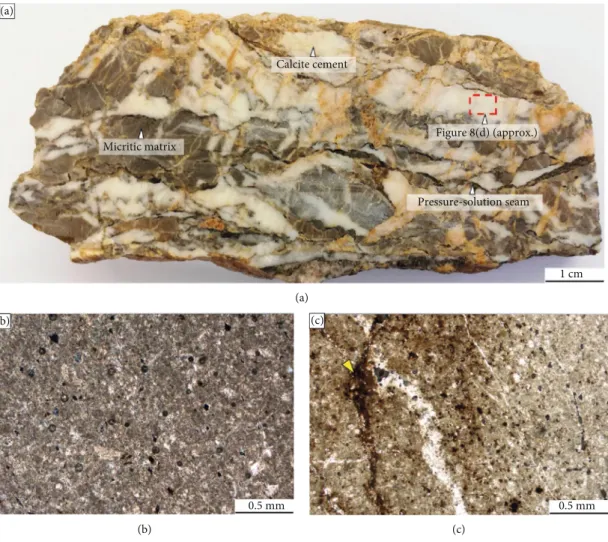
grey to yellowish foliated cataclasite (Figure 7). This foliated cataclasite is characterized by well-developed S-C shears forming sigmoidal lenses (imbricated lithons), a combina-tion of host rock carbonate and calcite lenses within a fine-grained micritic matrix (Figure 7(b)) with abundant calcite cement (Figures 6(e) and 7). Imbricated lithons are bounded by well-developed pressure-dissolution seams or stylolites (Figure 7(a)). S-C shears and stylolites strike ENE-WSW, compatible with the NNW-SSE shortening direction. Orange to reddish clay minerals concentrate along pressure-dissolution surfaces and are locally scattered within the micritic matrix (Figure 7(c)).
The transition from the fault core to the hanging wall damage zone is marked by discrete S-C sigmoidal shears without the development of foliated cataclasite, or by a dis-crete, discontinuous slip plane mineralized with calcite (Figure 5(c)).
Both the footwall and hanging wall damage zones comprise multiple sets of systematically and randomly ori-ented calcite-cemori-ented fractures (i.e., veins) developed at both sides of the fault core (Figures 5 and 6). Although in both cases, there is a progressive increase in
deforma-tion and vein intensity from the protolith towards the fault core (Figure 5(a)), the geometry of veins differs from one to another damage zone.
In the footwall damage zone, there are two areas showing different vein characteristics (Figure 5(a)). The first area is around 30 m wide from the protolith and is characterized by three systematically oriented vein systems (F1 to F3) with clear crosscutting relationships between them (Figures 5(a)– 5(c)). F1 consists of NNW-SSE extensional veins dipping between 50 and 70° to the SW. They are up to 1–2 m long and less than 2 cm thick (Figures 5(a), 5(b), and 6(a)). F2 is characterized by E-W extensional veins steeply dipping to the S-SW. These veins are several meters long and up to 5 cm thick (Figures 5(a), 5(b), and 6(b)). F3 consists of N-S and NE-SW en échelon conjugate sets of tension gashes (i.e., hybrid extensional-shear calcite veins) gently dipping towards the NW (Figure 6(c)). These veins are centimetric-sized and have sigmoidal shapes. The second area observed in the footwall covers around 15-20 m between thefirst area and the fault core and is dominated by randomly oriented calcite veins defining a dilational mosaic to chaotic breccia [52] (Figure 6(d)). Calcite cement Figure 8(d) (approx.) Pressure-solution seam 1 cm Micritic matrix (a) (a) 0.5 mm (b) (b) 0.5 mm (c) (c)
Figure 7: Fault core images. (a) Hand sample photograph of the foliated cataclasite showing S-C shear lenses (lithons) of grey host rock micritic limestone and calcite, bounded by dissolution seams or stylolites. Detail of the calcite cement can be found in Figure 8(d). (b, c) Optical microphotographs of the foliated cataclasite matrix with the presence of reddish clay minerals concentrated along pressure solution surfaces (yellow arrow).
By contrast, in the hanging wall, the damage zone is nar-rower, only concentrated in the 15-20 meters near the fault core (Figure 6(e)), and it is defined by randomly oriented cal-cite veins defining an incipient crackle breccia (proto-brec-cia) [52] (Figure 6(f)). Fracture density is lower than within the footwall damage zone.
4.3. Calcite Cements of Veins and Breccias. The damage zones in the footwall and hanging wall not only differ in the type and distribution of fracture systems, as previously described, but also they also show different fracture-filling calcite cements, characterized by distinct petrological and geochem-ical features.
In the footwall, three calcite cement generations (Cc1 to Cc3) have been observed filling the fracture systems F1 to F3 and two of those calcite cements (Cc1 and Cc2) are also present in the mosaic to chaotic breccia (randomly oriented fractures).
Calcite cement Cc1 exhibits a milky to slightly brownish color in hand sample and consists of up to 1 mm-sized anhe-dral crystals showing mechanical twinning and featuring a blocky to elongated blocky texture, in which crystals grow syntaxially. This cement shows a dark to light orange catho-doluminescence (Figure 8(a)). Calcite Cc1 precipitated in fractures F1 and in the mosaic to chaotic breccia of the footwall.
Cc2 displays a white to translucent aspect in hand sam-ple. It is formed of anhedral to subhedral calcite crystals, ranging in size from approximately 0.2 to 5 mm, with a blocky to elongated blocky texture. The elongated blocky Cc2 cement grows syntaxially from the fracture walls (Figures 8(a) and 8(b)). Crystals present abundant twin planes and show a nonluminescent to bright orange concen-tric zonation under cathodoluminescence in which the zon-ing pattern generally coincides with the crystal growth (Figure 8(b)). Calcite Cc2 precipitated in fractures F2 as well as in fractures F1 and in the mosaic to chaotic breccia of the footwall after Cc1.
Cc3 exhibits a milky appearance in hand sample and is constituted of up to 0.5 mm anhedral blocky, locally elon-gated crystals. It has mechanical twinning and presents a dull orange luminescence (Figure 8(c)). Cc3 precipitated in frac-tures F3.
On the other hand, in the hanging wall and in the fault core, only one calcite cement (Cc4) is observed. Cc4 precipi-tated in the main fault plane and in randomly oriented frac-tures. This cement has a milky aspect in hand sample and is characterized by up to 1 mm anhedral crystals with a nonlu-minescent to dark brown luminescence (Figure 8(d)). 4.4. Oxygen and Carbon Isotopes. Theδ18O andδ13C isotopic composition of the calcite cements Cc1 to Cc4, adjacent host rocks, and fault rocks is summarized in Table 1 and pre-sented in Figure 9. The calcite cement Cc0 in the interparticle porosity of the grainstone from the Collada Gassó Formation (footwall) has δ18O values between -7.2 and -6.7‰VPDB andδ13C values between -0.5 and +0.7‰VPDB. The micrite matrix of the wackestone from the Santa Fe Formation (hanging wall) showsδ18O values between -6.2 and -5.8‰
VPDB and δ13C values between +2.1 and +2.2‰VPDB. The carbonate micritic matrix from the cataclasite yields δ18O values between -7.1 and -6‰VPDB and δ13C values between +2.3 and +3‰VPDB.
The calcite cements Cc1 to Cc4 exhibit a wider range of values (Figure 9). Cc1 hasδ18O values ranging between -8.2 and -6.5‰VPDB and δ13C values between -2 and -1.5‰ VPDB. Cc2 is characterized by δ18O values between -8.2 and -5.4‰VPDB and δ13C values between -6.3 and -3.3‰ VPDB. Cc3 shows δ18O values between -13 and -11.7‰ VPDB and δ13C values between -3.2 and -1.9‰VPDB and Cc4 has δ18O values between -13.1 and -11.9‰VPDB and δ13C values between -0.6 and +2.4‰VPDB. Calcite cements precipitated in the footwall (Cc1, Cc2, and Cc3) exhibit neg-ativeδ13C isotopic values, whilst the calcite cement precipi-tated within the fault plane and hanging wall (Cc4) displays heavier δ13C values (Figure 9(a)). In addition, the δ18O values also exhibit two different trends within the four calcite cements: Cc1 and Cc2 showδ18O values similar to those of Cc0 and host rocks (Figures 9(a) and 9(b)), whereas Cc3 and Cc4 have lighterδ18O values with respect to the host car-bonate values (Figures 9(a) and 9(b)).
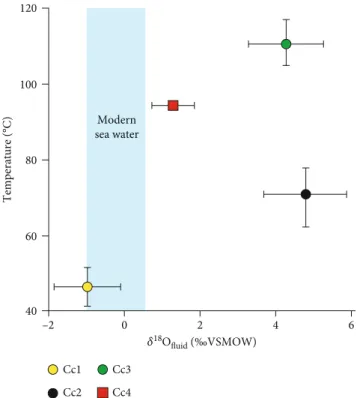
4.5. Clumped Isotopes. Temperatures in°C andδ18Ofluidin‰ VSMOW of the vein-formingfluids are calculated from the measured Δ47 using the formula of [54, 55], respectively
(Table 1 and Figure 10). The Δ47 value for Cc1 ranges
between 0.619 and 0.642, which translates into temperatures of 42–51°C andδ18Ofluidof -1.8 to -0.1‰VSMOW. For Cc2, Δ47 is between 0.562 and 0.589, implying temperatures
between 64 and 78°C and δ18O
fluid between +3.7 and +5.9‰VSMOW. For Cc3, Δ47 varies between 0.498 and
0.515, which translates to temperatures between 105 and 117°C and δ18Ofluid between +3.2 and +5.5‰VSMOW. Finally, Δ47 values of Cc4, between 0.53 and 0.535, imply
temperatures of 93 to 96°C and δ18Ofluidbetween +0.7 and +1.9‰VSMOW. In the footwall, the calculated temperatures progressively increase from Cc1 to Cc3 and theδ18Ofluidis lighter in Cc1, whilst Cc2 and Cc3 have a similar value. 4.6. Strontium Isotopes. A selected number of samples from each calcite cement generation (Cc0 to Cc4) and related host rocks were analyzed for Sr isotopic composition (Table 1 and Figure 11). Cc0 (in the footwall host rocks) has a 87Sr/86Sr ratio of 0.707606, whereas host rocks from the hanging wall have a 87Sr/86Sr ratio of 0.707718. These values fall within the range of values expected for Upper Cretaceous marine carbonates [56] (Figure 11(b)).
The calcite cements in the footwall exhibit higher 87Sr/86Sr ratios with respect to the calcite cement (Cc0) cementing their adjacent host rock (Figure 11(a)). This ratio is 0.707707 for Cc1, ranges from 0.707695 to 0.707699 for Cc2, and is 0.707698 for Cc3. By contrast, the calcite cement Cc4 has a 87Sr/86Sr ratio similar to its adjacent host car-bonate in the case of the crackle proto-breccia veins located in the hanging wall (0.707715) and more radiogenic than the host rock in the case of the fault plane (0.707771) (Figure 11(a)).
4.7. Elemental Composition. The elemental composition (Ca, Mg, Fe, Mn, and Sr), including rare earth elements (REE) and yttrium (Y), was measured for each calcite cement generation
and their host carbonates and the results are presented in Tables 2 and 3 and in Figure 12. In general, the trace element compositions widely vary depending on the calcite cement,
F1: Cc1 + Cc2
F2: Cc2
F2: Cc2 and F3: Cc3
Thrust plane: Cc4
Hanging wall and fault core
Footwall (a) (b) (c) (d) 0.5 mm 0.5 mm 0.5 mm 0.5 mm 0.5 mm 0.5 mm 0.5 mm 0.5 mm
Figure 8: Paired optical and CL microphotographs from calcite cements precipitated within the fault core and fault damage zone of the studied thrust. (a) Fracture F1 cemented by calcite cements Cc1 and Cc2. (b) Calcite cement Cc2, with its characteristic CL zonation, filling a fracture F2. (c) Cc3 filling a F3 fracture, postdating a fracture F2 filled with Cc2. (d) Cc4 in the main fault plane.
whilst the REY (REE and Y) pattern in the four cements fol-lows a trend comparable to that of the adjacent host rock (Figure 12(c)).
In the footwall, the calcite cements Cc1 and Cc2 are char-acterized by low Mg and Sr contents, intermediate Mn, and variable Fe concentrations, whereas Cc3 has high Mn and Fe contents, intermediate Mg values, and variable-high Sr concentrations (Figure 12(a)). The REY concentration of these cements (Cc1 to Cc3) is lower compared to that of the cement within the host rock (Cc0), but follows a similar flat trend, with a slight negative Ce anomaly (Figures 12(b) and 12(c)) and a slight positive Y anomaly (except for Cc2 that may exhibit either a positive or negative Ce anomaly) (Figure 12(c)).
In the fault core and hanging wall, Cc4 exhibits high Mg and Sr concentrations, intermediate Fe values, and low Mn contents. The REY pattern of Cc4 is also flat with a better defined negative Ce anomaly and a positive Y anomaly,
which are also present in the hanging wall host rock. The REY concentrations are lower in cement Cc4 than in its adja-cent host rocks, except for the calcite in the fault plane that exhibits higher concentrations (Figure 12(c)).
Mg/Ca and Sr/Ca molar ratios of the parentfluids that precipitated the calcite cements were calculated using the for-mula of [57] for low temperature (25–40°C) and for higher temperature (90–100°C) of precipitation using distribution coefficients (KMg= 0:012 at 25°C [58], KMg= 0:1163 at 90°C
[59], KSr= 0:054 at 25°C [60], and KSr= 0:08 at 100°C [61]).
The obtained molar ratios are presented in Table 2.
4.8. Neodymium Isotopes. Nine representative samples from calcite cements and related host rocks were also analyzed for Nd isotopic composition. However, although the Nd con-centration is above the detection limit for all the analyzed samples (Table 3), the143Nd/144Nd ratio could not be mea-sured. This is attributed to both the low Nd concentration
Table 1: δ18O,δ13C, and87Sr/86Sr isotopic signature of the calcite cements, fault rocks, and host rocks. TheΔ
47,δ18Ofluid, and precipitation
temperatures obtained from clumped isotopes are also included. Fw means footwall and Hw means hanging wall.
Sample Fracture Cement δ18O‰VPDB δ13C‰VPDB 87Sr/86Sr Δ47 δ18Ofluid‰VSMOW T (°C)
Bx1B F2 Cc1 -8.2 -1.7 0.707707 0.619/0.642 -1.8 to -0.1 42 to 51 Bx 3 F1 Cc1 -7.3 -1.8 Bx36.I Breccia (Fw) Cc1 -7.6 -2 Bx36.IV Breccia (Fw) Cc1 -7.4 -1.6 Bx36.V Breccia (Fw) Cc1 -6.5 -1.5 Bx3.III F1 Cc2 -8.2 -3.7 Bx1A.I F2 Cc2 -7 -4.6 0.707699 0.562/0.589 +3.7 to +5.9 64 to 78 Bx1B.II F2 Cc2 -6.3 -4.6 Bx3.II F1 Cc2 -7 -3.3 Bx36.II Breccia (Fw) Cc2 -7.8 -5.6 0.707695 Bx36.III Breccia (Fw) Cc2 -7.2 -6.3 Bx35 F2 Cc2 -5.4 -4 0.707765 Bx1A.II F3 Cc3 -13 -1.9 Bx2A F3 Cc3 -12.1 -2.9 0.707698 0.498/0.515 +3.2 to +5.5 105 to 117 Bx2B F3 Cc3 -11.9 -2.8 Bx4 F3 Cc3 -11.7 -3.2 Bx5 Thrust plane Cc4 -12.9 +0.4 0.707771 0.53/0.535 +0.7 to +1.9 93 to 96 Bx6 Breccia (Hw) Cc4 -12.3 +2.4 Bx7.I Breccia (Hw) Cc4 -13.1 +0.4 0.707715 Bx7.II Breccia (Hw) Cc4 -11.9 +0.9 Bx 8 Breccia (Hw) Cc4 -12.3 -0.6 Bx66.C Slip plane Cc4 -12 +1.6 Bx1.HR Host rock (Fw) Cc0 -7.2 -0.5
Bx2A.HR Host rock (Fw) Cc0 -6.7 +0.7 0.707606 Bx3.HR Host rock (Fw) Cc0 -7 +0.1
Bx7 Host rock (Hw) -5.8 +2.2
Bx8 Host rock (Hw) -6.2 +2.1 0.707718 Bx6.I Fault rock (matrix) -6.9 +2.9
Bx6.II Fault rock (matrix) -7.1 +3 Bx66 Fault rock (matrix) -6.6 +2.6 Bx67 Fault rock (matrix) -6 +2.3
in the samples, ranging between 0.5 and around 10 ppm (Table 3), and the scarce quantity of sample that was possible to collect, generally around 30 mg, which was not enough for a dynamic multicollection method through 160 cycles at a stable intensity of 1 V.
5. Discussion
5.1. Dissolution versus Precipitation Zones. The studied fault zone has different brittle structures accommodating defor-mation both in the fault core and in the damage zone. Within the fault core, the presence of tectonic stylolites and S-C structures evidences processes of pressure solution and/or frictional sliding [54, 55]. Such processes are associated with contractional stress concentration and slip accommodation imposed by the advancing thrust [64, 65]. By contrast, within the damage zone, the widespread presence of veins represents dilational sites where calcite precipitated [66, 67]. The mech-anism of calcite precipitation was likely induced by the rapid fluid pressure drop due to fluid trapping in the fractures developed in the footwall and hanging wall [10, 66, 68, 69]. The repartition of such structures, stylolites, S-C foliation, and veins, and therefore of zones of dissolution and zones of precipitation, is the result of a heterogeneous distribution of stress and the variation in deformation intensity across the fault zone [54].
5.2. Structural Context of Fracturing and Veining. The main stress orientations responsible for the development of the studied thrust system have been calculated plotting the main plane orientation and related slickenlines (Figure 6(e)). The estimated stressfield shows a SSE transport direction, com-patible with the N-S to NNW-SSE shortening direction reported in the Pyrenees [28, 30, 39], and a vertical minimum principal stress (σv=σ3), characteristic of compressional
regimes [9, 10]. The studied vein systems are interpreted as developed during the thrust activity under the same com-pressional regime [8, 42, 70]. The synchronicity between Cc4 Cretaceous marine limestones –10 –12 –8 –6 –4 Cc1 Cc2 Cc3 𝛿18O‰VPDB 𝛿 13C ‰ VPDB +2 0 –2 –4 –6
Interparticle cement (Cc0) in the footwall Host rocks in the hanging wall
Fault rock (a) 𝛿18O cements ‰VPDB 𝛿 18O host rocks ‰ VPDB –12 –10 –8 –6 –5 –6 –7 Cc4 Cc3 Cc1 + Cc2 Equilibrium (b)
Figure 9: (a) Crossplot showing the δ18O andδ13C compositions of the calcite cements, host rocks, and fault rocks (carbonate matrix from
the cataclasite). Cretaceous marine limestone values (green box) are from [53]. (b)δ18O values of the calcite cements versusδ18O values of the related host rocks.
Modern sea water Cc1 Cc2 Cc3 Cc4 𝛿18O fluid (‰VSMOW) –2 0 2 4 6 120 100 80 60 40 Figure 10: Temperatures (°C) vs.δ18O
fluid(‰VSMOW) calculated
thrusting and veining is supported by the exclusive presence of veins in the damage zone as well as by the gradual increase in vein density and slight change in strike when approaching the main thrust plane. However, the steeply dipping orienta-tion of F1 and F2 with respect to the subhorizontalσ1axis
differs with theoretical models that describe the formation
offlat-lying extensional fractures that open in the σ3
verti-cal direction (i.e., oriented parallel to theσ1axis) [9, 10, 13,
68, 71]. Despite this apparent discrepancy, the presence of the same calcite cements (Cc1 and Cc2) in F1-F2 fractures and in the mosaic to chaotic breccia developed along the fault plane corroborates the synchronicity between thrusting and 0.707750 Cc2 Cc4 Cc1 0.707700 0.707650 87Sr/ 86Sr 0.707600 200 400 600 800 1000 Cc3 Sr (ppm) Cc1 Cc2 Cc3 Cc4
Interparticle cementt (Cc0) in the footwall Host rock in the hanging wall
(a) 0.7085 0.7080 0.7075 0.7070 20
Olig. Eocene Pal. Upper Cretaceous Lower Cretaceous
Age (Ma) Jurassic Tr. 200 100 87 Sr /86 Sr Cc1 Cc2 Cc3 Cc4
Interparticle cement (Cc0) in the footwall Host rock in the hanging wall
(b)
Figure 11: (a)87Sr/86Sr isotopic ratios of calcite cements and host carbonates plotted against the Sr content. (b)87Sr/86Sr ratios compared with
fracturing. In the case of conjugated fracture systems F3, their bisector angle indicates a subhorizontalσ1 and a
sub-vertical σ3, and therefore, their formation is compatible
with the prevailing stress field associated with thrusting (σv=σ3).
Two mechanisms, a local variation of the stress axes as well as highfluid pressure conditions, are invoked to explain the formation of the steeply dipping F1 and F2 fractures in relation to the low angle reverse fault [72–74]. In the first case, the remote stressfields could have varied locally within a constant far-field compressional regime to become prop-erly oriented for the development of these fractures [71, 72, 75]. Such a local variation of the magnitude and orientation of the remote stressfields is attributed to the formation of a process zone at the front of the fault tip during thrust (slip plane) propagation [71, 76]. This occurs,firstly, because the fault tip acts as a stress concentrator amplifying the magni-tude of the remote stress [76] and, secondly, because the main compressive stress (σ1) exhibits different angles with
the fault in compressive quadrants with respect to dilational quadrants in propagating faults [71, 76].
Several observations, which are described below, indicate that the formation of the studied fractures occurred under highfluid pressure conditions, and therefore, it is associated with a hydraulic (over)pressure mechanism. Fluid overpres-sure may explain the high concentration of systematically oriented extensional (F1, F2) and extensional-shear (F3) veins, as well as the absence of any structural orientation of veins in the breccias [77]. Comparable fracture systems (sys-tematic arrays of extensional and extensional-shear frac-tures) are expected to develop in compressional settings when the tensile overpressure condition is achieved, that is, when the porefluid pressure exceeds the least compressive stress (Pf>σ3) [9, 10, 78]. Such afluid pressure is common
during the propagation of thrust faults in compressional regimes [9, 12, 67, 79] and is attributed to the following: (i) the constraint stress field around the fault tip may generate overpressure of a confined fluid [80, 81], (ii) the low dip of
Table 2: Elemental composition (Ca, Mg, Fe, Mn, and Sr) of the different calcite cements (Cc1 to Cc4), the interparticle cement Cc0 in the footwall host rocks (FW), and the hanging wall rocks (HW). The calculated Mg/Ca and Sr/Ca molar ratios of the parentfluid using the distribution coefficient equation [57] are also shown.
Sample Ca (ppm) Mg (ppm) Fe (ppm) Mn (ppm) Sr (ppm) Mg/Ca low T Mg/Ca high T Sr/Ca low T Sr/Ca high T Cc1 37236 859.7 2518.8 236.8 239 0.317 0.033 0.0049 0.0037 Cc2 378096 921.1 1249.4 222.3 216.2 0.335 0.035 0.0044 0.0033 Cc2 385024 741.0 1188.8 151.5 219.5 0.264 0.027 0.0043 0.0033 Cc2 393269 865.9 564.1 86.6 270.7 0.303 0.031 0.0052 0.0039 Cc3 387653 1912.4 2967.2 380.5 906.8 0.678 0.070 0.0178 0.0134 Cc3 300362 1997.7 2704.6 409.3 548.1 0.914 0.094 0.0139 0.0104 Cc3 350768 1397.6 2997.7 661.1 356.1 0.548 0.056 0.0077 0.0058 Cc4 322604 3637.8 2345.2 97.3 699.5 1.550 0.160 0.0165 0.0124 Cc4 366243 1908.1 1658.3 80.3 623.6 0.716 0.074 0.0130 0.0097 Cc4 346495 1784.2 1298.2 65.2 625.3 0.708 0.073 0.0138 0.0103 FW 298763 3376.3 3248.8 345.6 340.8 1.553 0.160 0.0087 0.0065 HW 321638 2968.0 980.1 68.8 468.9 1.268 0.131 0.0111 0.0083 Table 3: REE and Y contents of the different calcite cements (Cc1 to Cc4), the interparticle cement Cc0 from the footwall (FW), and the host rocks from the hanging wall (HW). Values are given in ppm.∗DL: detection limit.
Sample La Ce Pr Nd Sm Eu Gd Tb Dy Y Ho Er Tm Yb Lu DL∗ 0.21 0.32 0.04 0.15 0.03 0.01 0.02 0.003 0.02 0.2 0.003 0.01 0.002 0.01 0.01 Cc1 7.13 13.46 1.81 6.01 1.38 0.26 1.35 0.19 1.05 7.04 0.17 0.45 0.08 0.37 0.06 Cc2 3.03 9.96 0.85 3.00 0.75 0.14 0.66 0.08 0.43 3.31 0.07 0.19 0.03 0.16 0.03 Cc2 3.48 4.35 1.07 3.81 0.95 0.20 0.88 0.13 0.71 5.43 0.12 0.35 0.06 0.30 0.05 Cc2 0.81 1.26 0.17 0.59 0.23 0.04 0.17 0.02 0.15 1.29 0.03 0.07 0.01 0.06 <LD Cc3 6.15 10.73 1.64 5.77 1.36 0.26 1.21 0.17 0.92 6.53 0.15 0.39 0.06 0.31 0.05 Cc3 5.22 9.19 1.22 4.38 0.95 0.19 0.96 0.13 0.72 5.44 0.12 0.32 0.05 0.24 0.04 Cc3 1.31 2.38 0.38 1.45 0.37 0.08 0.33 0.04 0.25 2.37 0.05 0.13 0.02 0.10 0.02 Cc4 2.73 6.03 0.86 2.89 0.69 0.13 0.58 0.08 0.43 3.35 0.07 0.19 0.03 0.15 0.02 Cc4 0.78 1.05 0.17 0.58 0.24 0.04 0.14 0.02 0.14 1.87 0.03 0.09 0.02 0.08 <LD Cc4 2.08 1.84 0.53 1.82 0.44 0.08 0.36 0.05 0.25 2.45 0.05 0.14 0.03 0.13 0.02 Cc0 9.83 23.27 3.04 10.56 2.44 0.49 2.16 0.28 1.52 8.70 0.22 0.61 0.11 0.51 0.08 HW 2.39 3.52 0.52 1.75 0.41 0.07 0.36 0.05 0.33 3.23 0.06 0.18 0.03 0.17 0.03
3000 2000 ppm 1000 Mg Fe 800 600 ppm 400 200 Mn Sr Cc1 Cc2 Cc3 Cc4
Footwall (Cc0) Hanging wall
(a) IIIa IIb I IV IIa IIIb 0.9 1 1.1 1.2 Pr/Pr⁎ 1.3 1.4 1.5 0.2 0.6 1 Ce/Ce ⁎ Cc1 Cc2 Cc3 Cc4
Footwall (Cc0) Hanging wall
(b) Cc4 Fw (Cc0) Hw 1 Ce 0.1 0.01 PAAS-normalized REY La Ce Pr Nd Sm Eu Gd Tb Dy Y Ho Er Tm Yb Lu Y Cc1 Cc2 Cc3 (c)
Figure 12: (a) Elemental composition (Mg, Fe, Mn, and Sr) in ppm of calcite cements and host rocks. Bars indicate maximum, minimum, and average composition. (b) PAAS-normalized Ce/Ce∗vs. Pr/Pr∗crossplot showing the Ce and Pr anomalies of calcite cements and host rocks using the method of [62] modified by [63]. Field I: no anomaly. Field IIa: positive La anomaly and no Ce anomaly. Field IIb: negative La anomaly and no Ce anomaly. Field IIIa: positive Ce anomaly. Field IIIb: negative Ce anomaly. Field IV: positive Ce and La anomalies. (c) PAAS-normalized rare elements and yttrium (REY) patterns of calcite cements and host rocks.
thrusts prevents verticalflow [14, 68], and (iii) it is because of sediment compaction induced by loading during thrust sheet emplacement [77, 81].
5.3. Fluid History and Pathways. The widespread presence of calcite cements in the different fracture sets indicates that these structures themselves were traps forfluids migrating during thrusting. Field observations based mainly on the macroscopic vein features and crosscutting relationships between them together with the above presented petrological and geochemical data evidence the formation of four calcite cementation phases (Cc1 to Cc4) that record the evolution of thefluid system during the thrust activity. Since the foot-wall and hanging foot-wall exhibit different fracture systems and different calcite cements, the fluid system was compartmen-talized [26, 27, 82, 83].
5.3.1. Fluid System in the Footwall. The evolution of thefluid system in the footwall during thrusting is inferred from the geochemical data of calcite cements Cc1, Cc2, and Cc3.
Calcite cement Cc1 is observed within fractures F1 and within the mosaic to chaotic breccia located in the footwall. This cement hasδ18O (-8.2 to -6.5‰VPDB) and δ13C values (-2 to -1.5‰VPDB) similar or slightly more depleted with respect to those of the interparticle calcite cement (Cc0) in the adjacent host rocks (Figures 9(a) and 9(b)). This fact, together with the observed positive Y anomaly in both Cc1 and Cc0, indicates buffering of the vein-forming fluids by the adjacent host carbonates due to fluid-rock interaction [84]. The fluid-rock interaction is also recorded in the δ18O
fluid obtained from clumped isotopes, yielding values between -1.8 and -0.1‰VSMOW. These values may result from interaction between meteoric waters, which have typi-cally negative δ18O values, and marine carbonates, with δ18O values around 0‰PDB [64]. This fact is supported by the calculated Mg/Ca and Sr/Ca molar ratios, indicating the involvement of meteoric fluids, and the diluted elemental composition in Cc1 with respect to Cc0, showing lower REY concentration and lower Mg, Mn, and Sr contents (Figure 12(a)). Likewise, the87Sr/86Sr ratio of Cc1 is slightly more radiogenic than Cc0 but is still between the ranges of Cretaceous marine carbonates (Figure 11). The homoge-neous orange luminescence of Cc1 is interpreted as constant precipitation rates during a single precipitation event, and the presence of a negative Ce anomaly suggests precipitation in an oxic environment [84] (Figures 12(b) and 12(c)). Finally, the temperature of Cc1, also obtained from clumped isotope thermometry, ranges between 42 and 51°C. The pres-ence of meteoricfluids and the relatively low temperatures could indicate shallow burial depths, probably less than 1 km if we consider a normal geothermal gradient of 25– 30°C/km and a surface temperature of 20°C. Therefore, Cc1 precipitated from meteoricfluids (Figure 13(a)) with a com-position strongly buffered by the Cretaceous host carbonates. Calcite cement Cc2 is found in fractures F1 and F2 and within the mosaic to chaotic breccia from the footwall. This cement has similar87Sr/86Sr ratios andδ18O values to Cc1 but precipitated at higher temperatures (between 64 and 78°C) and from heavier δ18Ofluid(between +3.7 and +5.9‰
VSMOW). These higher temperatures and the δ18Ofluid imply hot formation waters. However, the low δ13C values (Figure 9), the diluted Mg, Sr, and REY concentrations (Figure 12), and the calculated Mg/Ca and Sr/Ca molar ratios of Cc2 reveal the involvement of meteoric fluids with increasing influence of organic-derived carbon [85– 89] (Figure 12(b)). The CL zonation of Cc2, alternating between non- and bright luminescent zones, the presence of positive and negative Ce anomalies (Figures 12(b) and 12(c)), and the oscillations in the Fe and Mn contents (Figure 12(a)) indicate oxidizing-reducingfluctuation, typi-cal of the meteoric environment [6, 90–93]. These facts indi-cate that Cc2 precipitated from formation fluids that likely evolved from heated meteoric waters during the development of the second fracturing event (F2). The evolution of these fluids probably involved water-rock interactions during pro-gressive increase in burial depths and temperatures linked to thrust sheet emplacement [94–96].
Calcite cement Cc3, occluding fractures F3, shows an 87Sr/86Sr ratio similar to cements Cc1 and Cc2 (Figure 11), δ13C within the same range of values of Cc2 (Figure 9(a)), and a lighter δ18O than the previous cement generations and the adjacent host carbonates (Figures 9(a) and 9(b)). Such depletion is related to hotter precipitation conditions (between 105 and 117°C). On the other hand, the δ18Ofluid (between +3.2 and +5.2‰VSMOW), the high Sr, Mn, and Fe contents (Figure 12(a)), and the calculated Mg/Ca and Sr/Ca molar ratios for the vein-forming fluids are within the range of formation waters [57, 87, 95]. The homogeneous bright-orange luminescence points to complete precipitation of Cc3 during a single precipitation event [97], and the pres-ence of a negative Ce anomaly indicates oxic precipitation conditions [84] (Figure 12(b)).
In conclusion, the progressive depletion inδ18O values from Cc1 to Cc3, as well as the continuous increase in precip-itation temperatures and enrichment inδ18Ofluidand in the elemental composition, evidences a progressive change in the fluid regime during ongoing deformation. This change may result from a continuous shift in thefluid composition, due to the evolution of the meteoric waters, or from a pro-gressive change in the fluid origin, from percolation of diluted meteoric waters to the upflow of hotter formation fluids. The evolution of the fluid system is also attested by the disequilibrium between Cc3 and its adjacent host rocks (Figure 9(b)) and may be indicative of a continuous opening of thefluid system, which is in turn attributed to the increase in fracture density and superposition of different fracturing events [4, 98–102]. Previous contributions reported the rela-tionships between folding, fracturing, andfluid migration in the eastern part of the Sant Corneli-Bóixols anticline (around the Coll de Nargó area, Figure 1(b)) [37]. During the latest stages of deformation in the frontal part of the anticline, these authors also reported a change in thefluid origin and compo-sition, that is, from percolation of meteoric waters, circulat-ing at approximately 40°C, to migration of hotter formation fluids, at temperatures around 90°C [103]. Consequently, the comparison between both studies suggests a common fluid behavior during the latest-folding to postfolding stages of deformation in the whole anticline.
Process zone deformation
Fractures F1 and mosaic to chaotic breccia. Calcite cement Cc1
Process zone deformation
Fractures F2 and mosaic to chaotic breccia. Calcite cement Cc2 Remote stress fields
reorientation Process zone F1 𝜎1 Infiltration at high structural reliefs Studied thrust 𝜎1 𝜎3 𝜎3 N N Progressive evolution of meteoric fluids ? 𝜎1: NNW - SSE 𝜎3: WSW - ENE Zoom 3D zoom Process zone 𝜎3 𝜎3 𝜎1 𝜎1 F1 F2 𝜎1: NNW - SSE 𝜎3: WSW - ENE
Far-field stress regime:
Process zone deformation
Fault tip
Hanging wall
Crackle proto-breccia. Calcite cement Cc4
Bedding
Thrust emplacement Footwall
Fractures F3. Calcite cement Cc3
Meteoric fluids
Mixed/evolved fluids
Formation fluids
Far-field stress regime:
1. Fluids migrating in the footwall block 2. Fluids drained along the fault core and towards the hanging wall
Thrust fault Thrust fault F1 𝜎1: NNW - SSE 𝜎3: WSW - ENE 𝜎3 𝜎3 𝜎1 𝜎1 F3 F2 𝜎1 𝜎1 𝜎3 𝜎3 F2 F3 Fault core N (a) (b) (c) F1
Figure 13: Fluid flow model during the evolution of the studied thrust (not to scale) showing the relationships between synkinematic fracture development, the stress state at each deformation phase, and the involvedfluid flow event. (a) During initial fault growth, deformation was concentrated in the process zone (around the fault tip) allowing the formation of fractures F1 and randomly oriented fractures (mosaic to chaotic breccia). During this episode, meteoricfluids infiltrated at high structural reliefs, warmed at depth, and then migrated through diffused deformation around the fault tip. (b) During progressive deformation, new fractures develop and meteoric fluids evolved at increasing depths and temperatures. During these two initial fracturing events (F1-F2), the remote stressfield varied locally within the process zone to generate steeply dipping fractures. (c) As the thrust developed, fractures F3 were formed in the footwall damage zone. The orientation of these fractures reflects the far-field stress regime unaltered by faulting. The fluid involved in this stage evidences the continuous increase in precipitation temperatures due to burial during thrust emplacement. From this stage, the thrust drainedfluids that only infiltrated in the hanging wall. These fluids were likely expelled from underlying Cretaceous carbonates due to rock compaction during thrusting.
5.3.2. Fluid System in the Hanging Wall. Calcite cement Cc4 precipitated within the main fault plane, within the fault core, and within the randomly oriented fractures (crackle proto-breccia) located in the hanging wall. The similarity between δ13C values in Cc4 and its host carbonates, together with the high Mg contents and the REY pattern showing a well-defined negative Ce anomaly and a positive Y anomaly, similar to that of the host rocks, indicates buffering of the precipitating fluid by the hanging wall carbonates (Figures 9 and 12). This buffered composition of the fluids is also recorded in theδ18Ofluidobtained from clumped iso-topes and yielding values between +0.7 and +1.9‰VSMOW. However, the depletion inδ18O values in Cc4 in relation to the adjacent rocks suggests that the system was opened to advection of the vein-formingfluid (Figures 9(a) and 9(b)). The Mg/Ca and Sr/Ca molar ratios calculated for thefluid that precipitated Cc4 reveal the presence of formation waters, which precipitated at temperatures between 93 and 96°C (according to clumped isotope thermometry). The87Sr/86Sr ratio of Cc4, similar to that of the hanging wall host rock (0.707718) in the crackle proto-breccia (0.707715), but more radiogenic in the fault plane (0.707771) (Figure 11), reveals a channelized ascending fluid migrating through the thrust plane towards the hanging wall, where it progressively increased the fluid-rock interaction. Cretaceous evaporated seawater is the most probable source for these formation fluids, if we take into account that (i) Cretaceous carbonates are broadly present around and underlying the studied thrust, (ii) the87Sr/86Sr ratios of Cc4 are consistent with Cre-taceous seawater and theδ18Ofluidis slightly more enriched with respect to marine values (Figure 10), and (iii) during the Late Cretaceous, there was a transition from marine to lagoonal and thus more restricted and evaporative conditions [104]. Upward migration of Cretaceous connate seawater was also reported during the postfolding stages of evolution in the eastern part of the Sant Corneli-Bóixols anticline [37]. 5.4. Thrust Zone Evolution. The successive deformation stages, associated with different fracture systems, record an episodic evolution of the studied thrust zone. We interpret this evolution to result from an upward propagation of the fault tip leading to distributed deformation within the pro-cess zone before propagation of the fault [71, 89, 105, 106].
During initial fault growth, deformation at the fault tip, i.e., within the process zone, was dominated by concentration of dilatant (extensional) fracturing, giving rise to fractures F1 and the mosaic to chaotic breccia from the footwall (Figure 13(a)). Thefluid associated with this initial deforma-tion stage responsible for precipitadeforma-tion of calcite cement Cc1 was a host-rock buffered meteoric fluid. Meteoric fluids probably infiltrated the system on high structural reliefs that were likely elevated during growth of the Sant Corneli-Bóixols anticline (Figure 13(a)). Thesefluids warmed up to ~50°C at depth by a normal geothermal gradient and then migrated through diffuse deformation developed in the pro-cess zone before the growth and propagation of the thrust slip plane (Figure 13(a)) [71, 89, 105]. As deformation continued, new dilatant fractures F2 developed, and F1 fractures reo-pened and randomly oriented fractures from the breccia
con-tinued forming. This synchronicity is evidenced by the presence of the same calcite cement (Cc2) in the aforemen-tioned fractures. The secondfluid flow event, associated with the second deformation stage, was characterized by the pro-gressive evolution of meteoricfluids due to water-rock inter-actions at increasing depths and temperatures (Figure 13(b)). During these two initial stages of deformation, the remote stressfields varied locally in the process zone, allowing for the formation of steeply dipping fractures (F1 and F2) (Figures 13(a) and 13(b)).
Finally, the thrust slip plane propagated through the process zone. Frictional processes occurred along the thrust surface as well as the progressive weakening of the fault zone, which led to the formation of the foliated cataclasite, charac-terized by S-C shear fabric, pressure solution seams, calcite mineralization, and carbonate fine-grained matrix. This micritic matrix is petrographically similar to that of the hang-ing wall protolith (Figures 4(c) and 7(b) and 7(c)) and displays comparable isotopic composition (Figure 9). These observations indicate that the cataclasite matrix derived from the hanging wall carbonates. During this period of thrust sheet emplacement, fractures F3 developed. We interpret that the orientation of these fractures represents the far-field stress regime unaltered by faulting (Figure 13(c)). The calcite cement Cc3, precipitated in fractures F3, reflects the presence of formationfluids and the progressive increase in precipitation temperatures, up to ~117°C, which could indi-cate progressive burial during fault growth from calcite cement Cc1 to Cc3 [107].
Later, the thrust acted as a preferential pathway forfluids that only infiltrated in the hanging wall block (Figure 13(c)) as indicated by the presence of the same calcite cement (Cc4) along the thrust slip plane, in the fault core and within the crackle proto-breccia from the hanging wall. Thus, this observation corroborates the compartmentalization of the fluid system. As proposed in other settings where faults compartmentalize fluid flow between the footwall and hanging wall, the presence of veins without a preferred structural orientation (i.e., randomly oriented veins) is indicative of overpressuredfluid migrating during deforma-tion. Pressured fluids were likely expelled from Cretaceous carbonates due to sediment compaction during thrust sheet emplacement [77] (Figure 13(c)).
The interpreted evolution of the studied fault zone is similar to models already proposed in other extensional set-tings during upward propagation of normal faults deforming carbonate rocks [71, 80, 89, 105, 108, 109]. Therefore, the comparison between these studies allows us to provide insights into deformation processes and mechanisms related to propagation of faults in different geological settings. Inter-estingly, all these contributions reported an initial stage of fault nucleation related to the development of a process zone (in the fault tip) before individualization of the fault plane. This period was characterized by the formation of hydraulic extension fracturing and brecciation and the presence of a fluid in chemical equilibrium with the host rocks. Finally, the progressive deformation resulted in the propagation of the fault (slip plane) through the process zone and the circu-lation of external fluids along the main slip surfaces (i.e.,
longitudinalfluid migration). These studies also reported an evolution of the fracture connectivity, a continuous opening of the fluid regime, and a progressive change in the fluid composition and origin during the evolution of the fault zone [80, 89, 105].
5.5. Structural Permeability: Thrust Sealing Capability and Fluid Pressuring. The petrology and geochemistry of the studied calcite cements indicate that the thrust separates two compartments with different deformation and fluid flow patterns. It is therefore likely that the thrust acted as a trans-versal barrier forfluids migrating between the footwall and hanging wall. The barrier role of the thrust is attributed (i) to the poor permeability of the foliated cataclasite and its micritic carbonate matrix with concentration of clay min-erals associated with pressure-solution surfaces and (ii) to the nonporous character of the hanging wall carbonates (i.e., wackestones). In the latter case, although it has not been measured, the permeability is likely lower in the hanging wall wackestones with respect to the footwall grainstones. There-fore, the thrust acted as a transversal barrier and a longitudi-nal drain fromfluids [15].
Additionally, considering the footwall damage zone as a high fractured compartment, its structural permeability is qualitatively evaluated. In this compartment, systematically oriented fractures (F1 to F3) were cemented by three genera-tions of calcite cement (Cc1 to Cc3) and the randomly ori-ented fractures were cemori-ented by Cc1 and Cc2. This evidences that the structural permeability was transient and that successive episodes of fracturing added new pathways tofluids that were rapidly occluded by calcite precipitation and sealing [18, 70]. According to theoretical models, the presence of existing fractures appropriately oriented for reac-tivation prevents the formation of new fracturing events [10]. Therefore, a new fracturing episode developed when the pre-vious fracture system regained cohesive strength by calcite precipitation [10]. The fact that the calcite cements Cc1 to Cc3 vary geochemically through time demonstrate that the fluid pathways, path lengths (associated with different frac-ture sizes), and the extent offluid-rock interaction changed during the thrust nucleation (process zone development) and growth (thrust slip plane propagation), which has been corroborated by the different fluid compositions and temper-atures obtained from clumped isotopes. In the same location, a previous study [42] documented the distribution of frac-tures developed in the footwall and discussed the permeabil-ity properties of the footwall damage zone in terms of porosity creation and occluding processes based on struc-tural analysis and crosscutting relationships between veins. These authors also concluded that the footwall damage zone had to be considered as a low-quality reservoir analogue because any porosity developed during fracturing was rapidly sealed by cementation processes [42].
The comparison between the above described scenario and the model proposed in the Oman Mountains [26] high-lights thatfluid behavior during thrusting greatly varies in different geological settings. In particular, the analysis of cal-cite cements precipitated across the fault zone in both studies reveals that the thrust faults acted as transversal barriers to
fluid migration but were preferential paths for channelized fluids along the thrust planes (longitudinal drains). In the studied outcrop,fluids in the footwall did not reach the hang-ing wall because of the impermeable fault core rock (foliated cataclasite) and a different fluid migrated upwards along the thrust plane and towards the hanging wall. By contrast, in the outcrop of Oman [26],fluids migrated along the thrust fault and towards the footwall, the only block in which syntectonic fractures developed. Our contribution and that of [26] high-light the importance of a good understanding of the timing of fracturing and the associatedfluids in order to characterize the hydraulic behavior of a fault zone.
6. Conclusions
The studied thrust displaces a subvertical Upper Cretaceous carbonate succession located in the southern limb of the Sant Corneli-Bóixols anticline, in the Southern Pyrenees. Struc-tural data together with petrological and geochemical analy-ses of synkinematic calcite veins developed within the fault zone constrain the evolution of the structural permeability and the thrust sealing capability and provide insights into the paleofluid system at the time of thrusting:
(i) The heterogeneous distribution of deformation mechanisms across the thrust zone resulted in strong host rock dissolution within the fault core and calcite precipitation in veins within the damage zone
(ii) The evolution of the thrust zone resulted from the upward propagation of the fault tip, producing dis-tributed deformation in the process zone and subse-quent propagation of the fault (slip plane), similar to the models already proposed for normal faults deforming carbonate rocks. During this evolution, the different deformation and fluid flow histories in the footwall and hanging wall indicate that the fault core acted as a transversal barrier due to its low per-meability associated with the foliated cataclasite arrangement and matrix cementation. In the foot-wall, three systematically oriented fracture systems (F1 to F3) and randomly oriented fractures devel-oped during progressive deformation. The structural permeability in the footwall damage zone was tran-sient, and successive episodes of fracturing added new pathways to fluids but were rapidly occluded by calcite precipitation. By contrast, in the hanging wall, only randomly oriented fractures are present (iii) Three calcite cements (Cc1 to Cc3) precipitated
within the fracture systems developed in the foot-wall. The petrology and geochemistry of Cc1 to Cc3 reveal a progressive change in thefluid origin and/or composition from percolation of meteoric fluids at temperatures between 42 and 51°C to upward migration of hotter formation waters at temperatures between 105 and 117°C. On the other hand, only one calcite cement (Cc4) precipitated in the hanging wall and in the fault core from hot
![Figure 2: Chronostratigraphic diagram showing the main stratigraphic sequences and their related tectonic event [41]](https://thumb-eu.123doks.com/thumbv2/123doknet/14758813.583948/6.899.115.785.105.945/figure-chronostratigraphic-diagram-showing-stratigraphic-sequences-related-tectonic.webp)