Development of a To-Scale Fluid Mixing Visualization Process for Analysis of
Cold-Flow Mixing
by
Kathryn K. Wopat
Submitted to the
Department of Mechanical Engineering
in Partial Fulfillment of the Requirements for the Degree of Bachelor of Science in Mechanical Engineering
at the
Massachusetts Institute of Technology
June 2015
MASSACHS77 I NSTTI ITE
OF fECHNOLOWLY
JUN 2 4 2015
LIBRARIES
C 2015 Massachusetts Institute of Technology. All rights reserved.
Signature of Author:
Certified by:
Signature redacted
De artment ofdMechanical Engineering May 15, 2015
Signature redacted
Dr. Alexander H. Slocum Pappalardo Professor of Mechanical Engineering Thesis Supervisor
Signature redacted
Accepted by:
Anette Hosoi Professor of Mechanical Engineering Undergraduate Officer
Development of a To-Scale Fluid Mixing Visualization Process for Analysis of
Cold-Flow Mixing
by
Kathryn K. Wopat
Submitted to the Department of Mechanical Engineering on May 15, 2015 in Partial Fulfillment of the
Requirements for the Degree of
Bachelor of Science in Mechanical Engineering
Abstract
Torrefaction is a process by which low energy density biomass is converted to a higher energy density biofuel, called char. Small-scale torrefaction systems are a promising technology for developing countries where large amounts of biomass go underutilized due to inaccessibility and transportation costs. A by-product of torrefaction is volatile gas, thus, a system may be built to harness this otherwise wasted energy and use it to power the treatment of biomass. An efficient fuel-mixer and combustor system which recycles this volatile gas is central to the overall torrefaction system efficiency. In order to analyze the mixing efficiency in a swirl-type mixer such as the design proposed for the small-scale torrefaction system, a project was designed to visualize mixing in an annular mixer. A to-scale cold-mixing system was constructed from two cylinders, three pump systems, as well as an imaging system using a retrofitted green laser. The final model is a tested and proven system for flow imaging of two cold flows within a to-scale fuel-mixer.
Thesis Supervisor: Dr. Alexander H. Slocum
Acknowledgements
The author would like to thank the many professors, graduate students, classmates, and friends who supported her during her thesis research. She would like to extend a special thank you to Dr.
Alex Slocum and Dr. Ahmed Ghoniem who co-sponsored the project as well as Kevin Kung for supervising the thesis work. She would also like to thank Pat McAtamney, Dr. Daniel
Braunstein, and Ken Stone for the use of shop resources and for their assistance with the design and fabrication of the experimental set-up. In addition, the author would like to thank James Bales at the MIT Edgerton Imaging Lab for sharing his time and knowledge which helped tremendously with the completion of this project. Lastly, she would like to acknowledge the
coaching staff and her teammates of the MIT Softball Team for their endless support and humor throughout the writing of this thesis.
Table of Contents Abstract
Acknowledgements Table of Contents 1. Introduction
1.1. Torrefaction: Converting Biomass to Char
1.2. Design Concept: A Decentralized Torrefaction System 1.3. Swirl Mixing System
2. Design of Fluid Mixing Visualization System 2.1. Swirl Mixer Design Overview
2.1.1. Swirl Mixer Overview
2.1.2. Flow Visualization Techniques Overview 2.2. Swirl Mixer Design for Visualization
2.2.1. Swirl Mixer Design Iterations 2.2.2. Fluid Pump Design
2.3. Fluid Flow Mixing Visualization 2.3.1. Flow Imaging Set-Up 2.3.2. Fluid Flow Parameters
2.3.2.1. Primary Air Inlets 2.3.2.2. Primary Mist Inlets
2.3.2.3. Secondary (Counter-Swirl) Air Inlets 2.3.3. Laser Line and Camera Set-up
2.3.4. Flow Imaging Methods
2.3.4.1. Birds-Eye Section View Method 2.3.4.2. Vertical Section View Method
3. Discussion and Results 3.1. Image Collection
3.1.1. Birds-Eye Section View 3.1.2. Vertical Section View 3.2. Image Analysis
3.3. Discussion
3.3.1. Observations of Camera Settings Effects
3.3.2. Observations of Laser Line Intensity and Scattering 4. Conclusions & Next Steps
1. Introduction
1.1 Torrefaction: Converting Biomass to Char
Biomass is an abundant, low-density energy resource available in many developing areas of the world. It is estimated, that 10 exajoules of biomass go unutilized each year in Sub-Saharan Africa and India. This equates to a lost potential equal to 18% of the energy needs of the 2.5 billion people in both sub-continents, or in other terms, a missed economic opportunity equal to $120 billion USD. There are many proposed solutions for converting this wasted biomass to usable energy, other types of fuel, and reusable agricultural products. One of these processes is called torrefaction, a process which converts biomass waste to higher energy density biofuel called char. In particular, small-scale and on-site torrefaction is an ideal solution because it eliminates many of the environmental hazards of biomass while converting it to an easily transportable and storable biofuel.
Torrefaction is a process of converting low energy density biomass and agricultural waste into char, a high-carbon density biofuel, which may be used as a fuel or fertilizer. The multi-step process shown in Figure 1 begins with untreated biomass, typically some type of cellulose-based agro residue like wood or manure. The biomass is heated at temperatures of 250-300 degrees
Celsius in a oxygen environment, which simultaneously drives out moisture and low-calorific components in the biomass. [1] According to a business case presented by Kevin Kung, a PhD thesis candidate at MIT and Tata fellow working on small-scale torrefaction solutions, the low-calorific particulates including smoke and volatile gases are automatically incinerated at these high temperatures, releasing heat as well as eliminating toxic particulates and smoke, which would otherwise be released into the atmosphere during incineration of the biomass. The remaining char can be used as a biofuel or a as a fertilizer for agricultural purposes.
BASIC TORREFACTION PRINCIPLE
Untreated Torgas Torrefied
Biomass Biomass
Figure 1: This diagram shows a simple process flow of a torrefaction system which treats biomass to create the torrefied biofuel, char. [1]
1.2 Design Concept: A Decentralized Torrefaction System
As previously stated, biomass often goes underutilized due to lack of transportability and inaccessibility of torrefaction systems. If small-scale torrefaction systems can be designed for on-site biomass-to-char conversion, the need for transportation will be eliminated. Char produced on-site can then be used in energy or agricultural applications in areas which are too remote to offset the transportation costs of biomass.
Torrefaction of biomass produces char and volatile gas called syngas, or torgas as it is also known. During the torrefaction process, these volatile gases can be combusted, releasing heat to drive the treatment of more biomass. Since the energy produced by combusting these volatile gases is greater than the energy needs for the thermal treatment of biomass, small-scale
torrefaction systems can be designed such that external fuel and energy is not required to drive the system. This autothermal system relies on the efficiency of fuel combustion to generate enough energy for torrefaction.'
In order for combustion to occur, first, air must be mixed into the syngas by-product produced during torrefaction. Since combustion must occur at an adequate rate to supply the energy necessary to maintain the correct temperature for torrefaction, fuel-air mixing efficiency must also keep up with the rate of combustion. Therefore, design of a an efficient fuel-mixing and combustion method is central to the performance of the overall torrefaction system.
1.3 Swirl Mixing System
To achieve the proper fuel-air mixture for combustion as well as the. required fuel-air mixing rate, a swirl-mixer was designed to take in gaseous fuel from biomass torrefaction and oxygen from air, seen in Figures 2 & 3. The swirl mixer takes in fuel from the torrefaction chamber and air from the outside atmosphere and mixes the two gases in an annular mixing chamber. The gases are injected into the chamber via primary inlets at the base of the cylinders. Due to momentum and thermal conditions of the gases, the gases swirl and rise through the annular chamber as time goes on. To induce further turbulence, and thus improve the rate of mixing, a secondary set of air inlets is located 6 inches above the first set of inlets and is angled in the opposite direction of the primary inlets to counter-swirl the flow. In order to understand the mixing dynamics, time-scale, and overall efficiency within the swirl-mixer the following project was designed.
1 Numbers and facts in this section are taken from the business case presented by Kevin Kung for a small-scale torrefaction system.
Figures 2 & 3: Figure 2 on the left shows a top view of the proposed swirl mixer. Figure 3 on the right shows an isometric view of the mixer with the locations of the air inlets to the mixing chamber. [1 ]The images shown above are the work of Kevin Kung, and not the authors own drawings.
2. Design of Fluid Mixing Visualization System
2.1 Swirl Mixer and Visualization Method Overview
The scope of this project included development of the to-scale combustor model as well as the imaging methods used for flow analysis. Several design iterations of the mixing chamber were created before the final model was decided upon and built. The imaging techniques are informed by particle image velocimetry (PIV) methods as well as laser spectroscopy methods. The to-scale combustor is designed to be compatible with multiple imaging techniques, allowing for a robust analysis of the fluid flow as well as a critical review of the effectiveness of imaging technologies for this application.
2.1.1 Swirl Mixer Overview
To understand the gas mixing dynamics within the fuel-mixing chamber, a set-up was designed to-scale of the proposed fuel-mixing chamber. The shape of the fuel mixing chamber is
composed of two concentric, multi-paneled cylinders, oriented vertically, with gas inlets located at two levels, as shown in Figures 2 & 3. The primary inlets located closest to the bottom of the cylinders let air and fuel into the mixing chamber. The entry angle and gas pressure of the fluid
inlets is variable, such that an optimal mixing condition can be established through observation and control of these two parameters. Additionally, the second level of inlets located 6 inches
above the primary inlets inject air to counter-swirl the flow, creating additional turbulence to promote mixing. The angle of the secondary inlets is also optimized to achieve quicker fluid
2.1.2 Flow Visualization Techniques Overview
Flow visualization techniques were developed and tested to analyze flow mixing parameters. The different techniques used laser light and various image analysis processes to describe the fluid mixing within the annular chamber. The set-up used a 5 milli-Watt green laser and a high-definition digital single lens reflex (DSLR) camera to take images for analysis. The different imaging set-ups are described in detail in Section 2.3.
2.2 Swirl Mixer Design for Visualization
The swirl mixer is constructed of two concentric cylindrical tubes as shown in Figures 4 & 5. The inner cylinder has an average outer diameter of 6.275 inches and the outer cylinder has an outer diameter of 12 inches. Each cylinder is 30 inches in height and is oriented vertically. There are two rows of inlets on the outer cylinder: the first row of inlets are 1 inch in diameter and have their centers located 4 inches above the bottom edge of the cylinder; the second row of inlets are
1.5 inches in diameter and their centers are located 10 inches above the lower edge of the
cylinder. There are 4 primary air inlets on the outer cylinder, and 8 secondary inlets. On the inner cylinder, there are 4 primary fuel inlets, and no secondary inlets for counter-swirl.
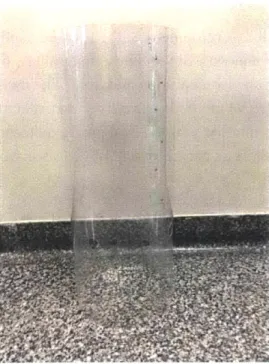
Figure 4: The outer cylinder is constructed out of 1/16-inch PETG bent into a circle and held in shape with pop rivets. There are four 1-inch diameter primary inlets and eight 1-1/2-inch
secondary inlets waterjetted in the part. Please note that the design pictured here has 8 primary inlets and 4 secondary inlets. For imaging, only 4 of the primary inlets are used. The remaining
primary inlets are taped over to avoid flow disturbance due to the presence of extra holes. The remaining secondary inlets were machined at a later date than when the photo was acquired.
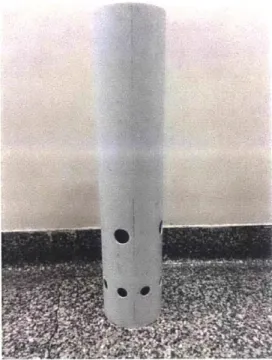
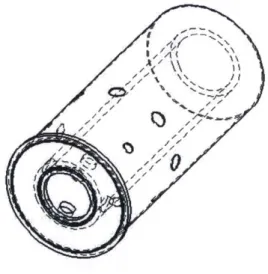
Figure 5: The inner cylinder is constructed out of 6-inch PVC sewer pipe. There are four 1-inch primary inlets located at the base of the PVC cylinder. Please note that the design pictured here has 8 primary inlets and 4 secondary inlets. For imaging, only 4 of the primary inlets are used and the remaining primary and secondary inlets are taped over to avoid flow disturbance due to the presence of extra holes.
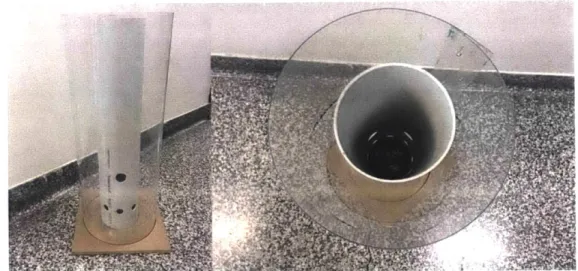
The two cylinders are aligned concentrically on an alignment piece made of medium-density fiberboard (MDF) as seen in Figure 6. An image of the assembled swirl mixer is shown in Figure 7.
Figure 6: The base for cylinder alignment consists is machined out of 5/8-inch MDF. The channels are is 3/8-inch deep and the hollow center allows air lines to be routed to the inlets on
the PVC inner cylinder. The inner channel is -inch wide with an inner diameter of 6 inches, and the outer diameter is 1/8-inch wide with an inner diameter of 12 inches.
Figure 7: These images show a side view and a top view of the nested cylinders which were machined for this project. The cylinders are press fit into the grooves that are cut into the MDF to prevent cylinder movement during imaging processes.
In order to achieve the desired flow entry angle, each inlet is fitted with a male-to-barbed adapter. Rubber tubing connects to the barbed end of the adapter, which routes air through the inlets. Street elbows, like the example shown in Figure 8, are attached to the male end of the adapter to alter the angle of gas entry into the annular chamber.
Figure 8: 90-degree and 45-degree street elbows are connected to the inlets to direct flow in the swirl mixer.
2.2.1 Swirl Mixer Design Iterations
Several design options were considered before deciding on the final experimental set-up. The actual shape of the fuel mixer prototype for the torrefaction system is shown in Figures 2 & 3. This iteration uses a paneled design for both inner and outer cylinders. In the actual construction, the fuel mixer will be made out of brick or ceramic which will be able to stand the high
temperatures of the torrefaction system, however, for the purposes of flow visualization, affordable, transparent, and readily available materials were selected.
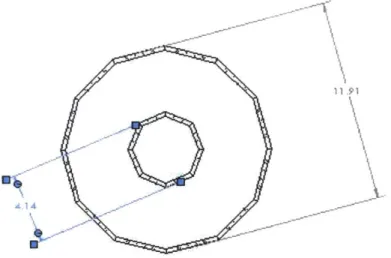
The first design iteration is shown in Figure 9. This design includes a 12-paneled outer cylinder and an 8-paneled inner cylinder made out of 1/4-inch Plexiglas. Additionally, this design
includes multiple sets of panels with inlets oriented at 30-degree, 45-degree, and 60-degree angles to examine different entry angles for gas in the cylinder.
Figure 9: The primary design was based on the sketches of the actual torrefaction combustor. The design was made up of two nested polygons- an outer dodecagon and an inner octagon. This iteration was decided against because of the machining complexity and time constraints of make so many parts.
The next iteration of this design included fewer machined panels on the outer cylinder; an 8-panel design was developed in place of the original dodecagonal design. Additionally, the inner cylinder was modified to use a 6-inch section of PVC pipe, for ease of machining. The modified design is shown in Figure 10.
Figure 10: This iteration simplified the previous design to include less panels to be machined. However, this design was also deemed still too complex and time consuming to warrant further pursuit.
The final design for the swirl mixer was selected for fidelity to the original design of the fuel mixing chamber proposed for the waste-to-char application as well as machinability given resources. Instead of using the multi-paneled outer cylinder design, a solution which minimized
machine time was devised. Instead of machining 8 individual panels, a thin (1/16-inch) sheet of PETG was bent into a cylinder and secured by adhesive and pop-rivets to create the correct shape and size of the outer cylinder. The bottom edge of the cylinder was then anchored into a channel milled out of a sheet of MDF. The final drawing of the assembled design is shown in Figure 11
and an image of the finished mixing chamber is shown in Figure 7.
Figure 11: The final design consists of two nested cylinders which are concentrically aligned on an MDF base. The outer cylinder is a flexible sheet of 1/16 PETG that has been bent into a cylindrical shape and held with pop rivets.
2.2.2 Fluid Pump Design
The fluid pump design is comprised of three separate gas-pumping systems. One system pumps air to the primary inlets on larger cylinder, another system delivers mist to the inlets on the inner cylinder, and the last system pumps air to the secondary counter-swirl inlets. The construction of the pump systems uses flexible rubber tubing and adapters as necessary. All tube-to-adapter
connections are secured with hose clamps to minimize leaks and increase the pressure that the system can handle. The pump system is described in greater detail in Section 2.3.2.
2.3 Fluid Flow Mixing Visualization 2.3.1 Flow Imaging Set-Up
The flow imaging set-up was constructed using a 5 milli-Watt green laser beam which was modified using a cylindrical lens to create a laser line. In a darkened room, the laser line was aimed at different heights of the annular mixing chamber. Depending on which of the imaging methods was to be used, the laser line illuminated different sections of the flow. The DSLR camera was focused at the same height as the laser beam or laser line and images of the air and humidified air interface are taken as regular time intervals. Images taken by the DSLR are then analyzed to describe moisture content and mixing in the annular tank.
2.3.2 Fluid Flow Parameters
Three separate pump systems were designed to deliver air to the inlets. One system provides air to the primary (bottom row) inlets on the outer cylinder, another system pumps mist to the primary inlets on the inner cylinder, and the final system pumps air through the secondary (counter-swirl) inlets on the outer cylinder.
2.3.2.1 Primary Air Inlets
There are four primary air inlets on the outer clear cylinder with diameter one inch located with their centers four inches above the bottom edge of the cylinder. To insure that the flow velocity is equal at each of the air inlets, a flow-splitting design was created to route air from a single air cylinder to the four inlets. The flow-splitting design first steps tube size from 1/2-inch regulator outlet to a 1-inch tube via a reducing tube adapter. Next, the flow is split once (into two streams) using a 1-inch diameter wye adapter, and then each of the two new streams is split again using a 1-inch wye adapter like the one shown in Figure 14. Once the flows have been split, the result is four (4) 1-inch diameter tubes each with the same flow velocity. The air enters the cylinder via a barbed-to-male adapter attached at the end of each tube. The male end of each adapter protrudes into the annular mixer and can be fitted with a street elbow to alter the angle of the air stream. All connections are reinforced via hose clamps at tube-to-adapter connections. A schematic of the flow-splitting is shown in Figure 15 and an image of the tube-to-inlet connection is shown in Figure 16.
Regulator
Wye adapter To inlets on cylinder
%-inch tubing
1-inch tubing Y2-1 inch Reducing
connector
Figure 15: A schematic of the air line splitting for the primary air inlets.
4 primary inlets connected to rubber hose
Figure 16: The rubber tubing is connected to the barbed side of the connector and secured with a 1-inch hose clamp.
In order to calculate the flow velocity at the outlets, the Darcy-Weisbach equation (Equation 1) must be applied at each step of the flow-splitter to account for head loss in each of the tubes and the continuity principle (Equation 2) must be applied at each step of the flow-splitter to account for pressure losses at the reducing adapter and at each of the wye adapters.
L pu2
Ap =fd *-*D 2
Equation 1: The Darcy-Weisbach: Where Ap is the change in pressure, which is dependent on
L
fd, the Darcy factor (a coefficient of laminar or turbulent flow), , the length to diameter ratio of
Q
= A1 * ul= A2 * U2Equation 2: Continuity states that volumetric flow rate,
Q, is dependent on A, the
cross-sectional area of the tube, and u, the mean velocity of the fluid. As the flow is reduced and split, this equation must be applied over again to the flow to calculate mean velocity from initial volumetric flow rate.
However, due to the amount of variability in the system, it is difficult to calculate the exact pressure at the air cylinder regulator that is necessary to achieve a desired flow velocity at the four inlets. To be certain that the flow velocity at each of the air inlets is close to the expected experimental value, an anemometer is used to directly measure the flow rate at each outlet. Once it is confirmed that the flow velocity is uniform for all four outlets, the pressure at the air
cylinder regulator can be adjusted to achieve desired flow velocity, based on the readings from the anemometer at a single inlet.
2.3.2.2 Primary Mist Inlets
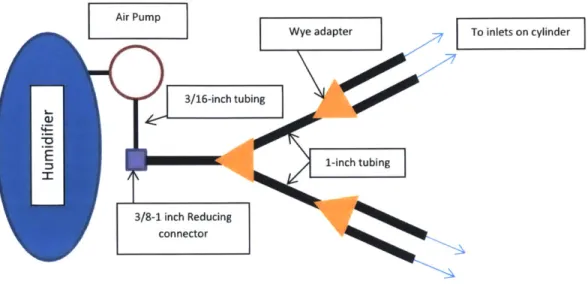
The humidified air is pumped from the inlets on the inner cylinder into the annular mixer via an air pump connected to a humidifier. The intake for the air pump is connected to the humidifier, thus pumping humidified air to the mist inlets (see the schematic in Figure 17). The flow-splitter design for the primary mist inlets is identical to the flow splitter for the air inlets; the flow is first stepped from a -inch diameter up to a 1-inch diameter via a reducing adapter, then the flow is split twice using 1-inch wye adapters. The end result is four (4) 1-inch diameter tubes of equal flow velocity connected to the cylinder via barbed-to-male adapters which are shown inserted in place in the inner cylinder in Figure 18. The assembled tubing system is shown in Figure 19. Unlike the air cylinder, there is no regulator attached to the pump. Thus, flow rate at the mist
inlets is dictated by the volumetric flow from the pump, head losses, entry, and exit losses in the pipes and flow-splitters. Once again, due to the imperfections in the system it is difficult to calculate using Equations 1 & 2 what the flow velocity will be a the mist inlets. Thus, an anemometer is used to measure flow rate directly. In future iterations, a flow regulator and, if necessary, a second pump will be integrated into the primary mist inlet design in order to control mist flow velocity. The male end of each adapter protrudes into the annular mixer and can be fitted with a street elbow to alter the angle of the mist stream.
Air Pump
Wye adapter To inlets on cylinder
3/16-inch tubing
E 1-inch tubing
3/8-1 inch Reducing connector
Figure 17: Schematic of the mist pump system that pumps mist to the inlets on the inner
cylinder.
Figure 18: Inlets on the inner cylinder are shown in place. Please note that there are 8 holes in the primary row of inlets. Only 4 inlets are used on the primary row during flow mixing and the others are covered to prevent air from escaping the mixer. The inlets in the secondary row are also covered as they are not used during fluid mixing.
Figure 19: The assembled tubing for the mist inlets is shown laid out to show the connections (right) and assembled in the inner cylinder (left).
2.3.2.3 Secondary (Counter-swirl) Air Inlets
There are 8 secondary (counter-swirl) air inlets on the outer cylinder. The inlets are 1-1/2 inches in diameter with their centers located 10 inches above the bottom edge of the cylinder. Air is provided to the inlets from a second air cylinder fitted with a regulator. The tubing set-up for the counter-swirl inlets is similar to the set-up for the primary air inlets and the mist inlets. The tube diameter is again expanded from 2 inch at the regulator outlet to 1 inch tubing using a reducing
adapter. Since there are 8 inlets for the secondary air (instead of 4 as in the case of the mist and the primary air inlets), the stream from the regulator is split three times using 1-inch wyes, resulting in 8 tubes of equal flow rate. The 8 different streams are then connected to 1-inch barbed-to-male adapters which are then connected to 1-inch to 1-1/2 inch reducing adapters which are connected to the inlets on the outer cylinder. The design choices for this system were motivated by cost of tubing, wye connectors, and reducing adapters. A full schematic of the counter-swirl pump design is shown in Figure 20. The rubber hose and outer cylinder assembly
is shown in Figure 21. Both inner and outer cylinders with the pump tubing are shown in Figure 22.
Regulat
Wye adapter
%-inch tubing
1-inch tubing
Y2-1 inch Reducing connector
7-7
To secondary inlets, fitted with
1-inch to 1-1/2-inch adapters
Figure 20:The flow from the air cylinder is split into 8 air lines which connect to 1-1/2-inch diameter air inlets on the outer cylinder of the mixer.
Figure 21: The assembled inlet system for the primary and secondary outlets for the outer cylinder is shown here.
L. a) C U
Figure 22:The complete hose assembly for all inlets is shown here. The outer cylinder shows some warping due to the weight and position of the hose. Since the outer cylinder is pliable, a structural ring will be added to the design to maintain a cylindrical shape.
2.3.3 Laser Line and Camera Set-up
For flow imaging, a laser line and DSLR camera were used. The laser used for this purpose is a GLX Green 5 milli-Watt (mW) Tactical Laser Sight manufactured by Barska shown in Figure
23, that is modified using the optics from a cheap Black & Decker laser level shown in Figure 24.
Figure 23: A Barska GLX green 5mW Tactical Laser Sight was used as the light source for the laser line.
Figure 24: The laser line optics were taken from a cheap Black & Decker laser level and
retrofitted on the higher-powered green laser to create a sheet of light rather than a point of light. The optical lens from the laser level spreads the 5mW laser beam into a laser line as seen in Figure 25.
Figure 25: On the left, is the unmodified laser dot produced by the laser sight; on the right is the line generated by the laser once it is fitted with the optics taken from the laser level.
The light intensity of the laser beam is related to the power provided by the laser and the area that the laser is projected on by conservation of energy, as shown in Equation 3.
Equation 3: Power as a function of light intensity over a differential area element. Where P is the power of the source, I is intensity, and dA is a differential area element of a closed surface -the area where -the laser light from -the beam hits.
For the purposes of this project, it is important that light intensity is approximately uniform over the imaging area as not to overexpose certain areas of the flow and underexpose others, as this will lead to inaccurate analysis of mixing scales. The image analysis method will be discussed in
greater detail in Section 3.1. Light from the 5 mW laser is assumed to be collimated, meaning the rays of light are parallel to each other. In order to create the laser line (also called a laser sheet) necessary for imaging, the light is de-collimated using a cylindrical lens. A schematic of the beam-lens interaction is depicted in Figure 26.
cylindrical lens
collimated light de-collimated
light
Figure 26: The collimated light interacts with the curved surface of the cylindrical lens spreading the light into a line, with the a sheet thickness equal to the diameter of the original laser beam.
The cylindrical lens spreads the laser such that the laser is much brighter in the middle and dimmer near the edges of the line (see Figure 27 for a schematic of this phenomenon), while the energy distribution along the height of the line is the same as the energy distribution of the
original laser beam, which Gaussian. Therefore, light intensity is dependent upon the curvature of the cylindrical lens as well as an object's distance from the lens. For the purposes of flow imaging, the line laser was placed 2 inches from the outer wall of the cylinder for all
measurements, assuming uniform light intensity over a 3-inch wide imaging area. It was visually confirmed that this was a reasonable assumption. The flow imaging process is discussed in greater detail in Section 2.3.4.
Figure 27: The laser brightness variation is much more pronounced along the length of the line than in the direction of line thickness. This is due to the properties of the cylindrical lens.
A Nikon D7 100 digital single lens reflex (DSLR) camera was used to take images of flow mixing in the annular chamber. By altering shutter speed and aperture size the type of image captured by the camera could be adjusted and optimized for the needs of image analysis. Shutter
speed and aperture size both affect how much light is let in through the lens to the camera light sensor, thus affecting the brightness and contrast in the final image. The longer the shutter speed, the longer light has to reach the camera sensor. Likewise, the larger the aperture, the larger the
amount of light let in to the light sensor. However, long shutter speeds mean that the particles in the system being imaged will move over the amount of time that the shutter is open. Therefore, longer exposure times (due to longer shutter speed) will be blurrier than shorter exposure times due to the movement of particles. For the purposes of this project, it is not critical to know exactly where a particle is located in time or what the velocity of a particle is at a given time, as in particle image velocimetry (PIV), so slower shutter speeds are acceptable. The advantage for slower shutter speeds in this case, is that a brighter picture of flow mixing may be captured, creating a clearer image for analysis. In order to ensure consistency of light analysis techniques used for analysis, the shutter speed is the same length for all images taken using a given method. The laser, camera, and mixer set-up for imaging is shown in Figure 28.
Figure 28: This image shows the set-up for the birds-eye view method discussed in Section 2.3.3.1. The camera is positioned looking down at a cross-section of the flow mixing, while the laser illuminates a slice of the flow. In this set-up, the inner cylinder is not in place in the mixer, as it was a set-up for test images. However, the laser and camera position will remain as pictured here for image collection using the final assembly.
2.3.4 Flow Imaging Methods
Multiple flow imaging methods were employed over the course of this project to analyze flow mixing in two dimensions: the radial dimension and the vertical dimension. In the radial
dimension, the mist and air flows are initially concentrated at the mist and air inlets. As the flows mix and diffuse over time, a gradient of mixing appears between the inner and outer walls of the cylinders. As mixing progresses over time, the slightly warmer mist swirls to the top of the cylinder, thus creating a diffusion gradient in the vertical direction as well. The mixing that takes place due to diffusion over time can be imaged in both radial and vertical directions using two different laser light set-ups.
2.3.4.1 Birds-Eye Section View Method
Fuel mixing in the annular mixer is simulated by mixing air and humidified air (mist) flows. Images of flow mixing are captured by focusing a DSLR camera a plane of laser light, which illuminates a thin cross-section of the annulus as shown in Figure 29. The rest of the room is kept darkened so that light scattered when the laser interacts with the mist will show up in the DSLR image. High-resolution images of the flow show the mixing interface between the air and humidified air. Images are taken at different heights of the cylinder to analyze how the flow develops in the annulus over time. A schematic of the DSLR and laser set-up are shown in Figure 30.
outer cylinder
inner
cylinder fr htor
Figure 29: This figure shows what the camera sees when it looks down at the cylinder. The area between the two circles is the area of mixing and the green light is the specific area of the
cylinder being imaged. It is assumed that due to radial symmetry it is not necessary to image the entire cross section at one time.
-o.
- - laser ' fh s rce
Figure 30: This schematic shows a side view of the imaging set-up for the birds-eye view method.
2.3.4.2 Vertical Section View Method
In this method, the set-up is such that a radial line of the flow is illuminated by the laser, rather than a plane as shown in the schematic in Figure 31. The laser line set up is the same as in the section view method, but the laser line is rotated 90 degrees, so it is oriented vertically. Instead of imaging the flow from above as in the section view method, the image is perpendicular to the laser sheet projection. Then, a picture of the flow is taken with the high-resolution DSLR camera. Since there is non-uniform humidity in the chamber, the laser line shows relative
humidity between the bottom and the top of the frame, as well as the amount of mixing between
the walls of the cylinders. By analyzing the relative amount of reflected light at different radii
and heights of the mixer, the mixing efficiency can be analyzed.
U
S)a
Figure 31: This schematic shows the imaging area between the two cylindrical columns in the vertical section method as viewed through the camera. The green highlighted area between the two cylinders is the area which is being imaged for analysis.
3. Discussion and Results 3.1 Image Collection
Due to time constraints, images with the air and mist inlet system were not taken during the course of this project. The images collected were obtained using incense as the particle source, rather than humidified air. These images show that the set-up devised for the fluid mixing
imaging process works according to design, but also highlights a few areas of concern which will be discussed in further detail in Section 3.3. The camera settings were varied and are listed with each image.
3.1.1 Birds-eye Section View
Sample images of the birds-eye section view are shown in Figures 32 & 33. To create the particles for image analysis, a stick of incense was lit and placed inside the larger diameter cylinder. Test images were taken and camera settings for each image were recorded for comparison of image quality during analysis.
Figure 32: This figure shows a common issue during the imaging process, in which images were out of focus due to the quickly evolving nature of the system. In the next image, a yardstick is used to create a spot for the camera to focus on which is the same height as the laser line.
Figure 33: In this image, a yardstick was placed inside the cylinder to create a point for the camera to focus on. This bright line is where the laser line hits the yard stick. This ensures that the camera is focused at the same height as the incident laser line.
3.1.2 Vertical Section View
Sample images of the vertical section view are shown in Figures 34 & 35. As in the birds-eye section view images, incense was used to create the particles for imaging. Camera settings for each image were recorded for comparison of image quality during analysis.
Figure 34: This image shows the vertical diffusion of smoke from the incense between the inner and outer cylinder walls. Reflections from the lighting in another area of the room can also been seen on the outer cylinder wall. Careful consideration of external light sources must be taken into account to acquire the best images for analysis, such that noise in the images is minimized.
Figure 35: This image is another view of the smoke diffusing vertically between the two cylinders. The shutter speed is increased in this picture, resulting in blurrier, less defined shapes of the smoke particle trace. Again, there is a reflection on the outer cylinder from an external light source.
Table 1 shows the shutter speed settings for each image. Aperture, focal lens diameter, and ISO remained consistent across all images. The aperture was: f-1.8, focal lens diameter: 50 mm, and ISO:1600.
Figure Number Shutter Speed (seconds)
32 1/30
33 1/15
34 1/15
35 1/5
Table 1: This table lists the shutter speed settings for the pictures collected during testing. Shorter shutter speeds correlated to less blurry images, however, longer shutter speeds correlate to brighter images.
3.2 Image Analysis
In order to quantify the amount of mixing shown in Figures 32 -35, the image analysis software ImageJ was used. The following steps show the procedure for extracting light intensity data from the image. In future work, images will be taken alongside humidity measurements and humidity
Light Intensity Analysis with ImageJ Procdedure: 1. Open ImageJ:
ImageJ can be downloaded for free online at: http://imagej.nih.gov/ij/. Once ImageJ is installed, open the image for analysis by clicking File-+Open and selecting your image. The image analyzed in this procedure is shown in Figure 36.
Figure 36: The vertical section view image pictured here was chosen as a representative image for analysis.
2. Set image scale using a known distance in the set-up:
First, draw a horizontal line between the inner and outer cylinder walls. Next, click Analyze-+Set Scale and type in the distance between the inner and outer cylinder walls (5.75 inches) into the known distance field as shown in Figure 37. This will set up an accurate pixel to distance ratio for the rest of the analysis.
3. Measuring Light Intensity:
Light intensity may be analyzed over the entire image or over a specific area of the image using ImageJ. Due to reflections on the cylinders in the picture, it makes more sense to choose a smaller area within the image for analysis. To measure intensity, first select the area by drawing a square around the desired size part of the image for analysis, being sure to truncate any external reflections. Next, click Analyze-+Plot Profile. This will generate a plot of the gray value in the image between the two cylinder walls. The result is shown in Figure 38. Because gray value is summed over the height of the rectangle, it
is important that the area analyzed for light intensity is the same size across all measurements- put another way, the rectangle dimensions should not change during
analysis.
Side View DSCi0AJPG (16.7%)
100
50
0 1 2 3 4 5
Distance (in) Lisi-i Save ICoPY I X-1.256, Y-12.9
Figure 38: The plot of gray value versus radius in between the wall of the inner cylinder and outer cylinder shows some aberrations where there is external light reflected off the outer cylinder wall- as shown by the bump between 4 and 5 inches.
4. Data Extraction:
To draw a useful comparison of gray values at different heights and radii of the mixer, image data can be extracted from ImageJ by clicking the List feature at the bottom left of
the profile plot shown in Figure 38. This shows a list of the values which can then be copied and saved elsewhere, and plotted against other gray values in the cylinder. 3.3 Discussion
3.3.1 Observations of Camera Settings Effects
Though no images were taken for analysis, a proof of concept was established using the laser line set-up to quantify mist and air mixing. Important considerations should be made in future
research regarding image quality. Since time scale and intensity both affect the mixing of the fluids, all measurements must be taken with the same camera settings and shutter speed. The ideal settings for the camera are: focal lens diameter: 50 mm, ISO: 1600, shutter speed: 0.5 seconds, and aperture: f-1.8.
3.3.2 Observations of Laser Line Intensity and Scattering
To insure the integrity of images for analysis, careful observation of laser line attenuation should be considered. As the line of laser light passes through more and more mist, the line is scattered such that the plane of particles being imaged increases over distance. A schematic of this phenomenon is shown in Figure 39.
CU -0
CU
3
0
Figure 39:After light enters the scattering.
"""
U
S
annular chamber, it interacts with the humidified air causing
If the scattering is appreciably larger at different heights of the cylinder or radii of the cylinder it could skew results of the image analysis. In future imaging processes, it should be confirmed that the attenuation of laser light over the height of the laser slice has negligible effect on observed
4. Conclusions & Next Steps
This project resulted in a fully-built apparatus and procedure for fluid mixing visualization. There is still room for more improvement and optimization, but the final product stands as a robust means of quantifying fluid mixing characteristics in an annular chamber. The final project consists of two concentric cylindrical columns with adjustable air and mist inlets that can be altered to assess the effect of different flow angles and inlet pressures. These inlets are connected to three separate pump systems which allow for pressure control at the inlets. The final project also includes a tested and proven imaging and analysis method using a line laser constructed from a Barska 5mW green laser, a Nikon 7100 DSLR camera, and the open-source image analysis software, ImageJ.
The next steps to be investigated when this project is continued in the future are optimization of the camera and laser parameters for best image quality, in addition to carrying out the purpose of the project- to optimize mixing in the annular chamber. Once mixing in the designed system is optimized, more complexity may be added to the design such as altering thermal conditions to simulate the temperatures that will influence mixing the final design of the torrefaction system. In summary, the project is a first step in a critical design process for a small-scale torrefaction system that will inform future choices that will aid in the development of an efficient, small-scale torrefaction system for otherwise inaccessible biomass in the developing world.
References
[1] "Biomass Torrefaction explained I Topell Energy," Topell. [Online]. Available: