HAL Id: hal-02972559
https://hal.archives-ouvertes.fr/hal-02972559
Submitted on 20 Oct 2020
HAL is a multi-disciplinary open access
archive for the deposit and dissemination of
sci-entific research documents, whether they are
pub-lished or not. The documents may come from
teaching and research institutions in France or
abroad, or from public or private research centers.
L’archive ouverte pluridisciplinaire HAL, est
destinée au dépôt et à la diffusion de documents
scientifiques de niveau recherche, publiés ou non,
émanant des établissements d’enseignement et de
recherche français ou étrangers, des laboratoires
publics ou privés.
Fairness in Online Jobs: A Case Study on TaskRabbit
and Google
Sihem Amer-Yahia, Shady Elbassuoni, Ahmad Ghizzawi, Ria Borromeo,
Emilie Hoareau, Philippe Mulhem
To cite this version:
Sihem Amer-Yahia, Shady Elbassuoni, Ahmad Ghizzawi, Ria Borromeo, Emilie Hoareau, et al..
Fair-ness in Online Jobs: A Case Study on TaskRabbit and Google. International Conference on
Ex-tending Database Technologies (EDBT), 2020, Copenhagen, Denmark. �10.5441/002/edbt.2020.62�.
�hal-02972559�
Fairness in Online Jobs: A Case Study on TaskRabbit and
“Applications” paper
Sihem Amer-Yahia
CNRS, Univ. Grenoble Alpes, Francesihem.amer- yahia@ univ- grenoble- alpes.fr
Shady Elbassuoni
American University of Beirut,Lebanon [email protected]
Ahmad Ghizzawi
American University of Beirut,Lebanon [email protected]
Ria Mae Borromeo
UP Open University, Philippines [email protected]
Emilie Hoareau
IAE, Univ. Grenoble Alpes, Franceemilie.hoareau@ univ- grenoble- alpes.fr
Philippe Mulhem
CNRS, Univ. Grenoble Alpes, Francephilippe.mulhem@ univ- grenoble- alpes.fr
ABSTRACT
Online job marketplaces are becoming very popular. Either jobs or people are ranked by algorithms. For example, Google and Facebook job search return a ranked list of jobs given a search query. TaskRabbit and Fiverr, on the other hand, produce rank-ings of workers for a given query. Qapa, an online marketplace, can be used to rank both workers and jobs. In this paper, we de-velop a unified framework for fairness to study ranking workers and jobs. We case study two particular sites: Google job search and TaskRabbit. Our framework addresses group fairness where groups are obtained with any combination of protected attributes. We define a measure for unfairness for a given group, query and location. We also define two generic fairness problems that we address in our framework:quantification, such as finding thek groups (resp., queries, locations) for which the site is most or least unfair, andcomparison, such as finding the locations at which fairness between two groups differs from all locations, or finding the queries for which fairness at two locations differ from all queries. Since the number of groups, queries and locations can be arbitrarily large, we adapt Fagin top-k algorithms to address our fairness problems. To evaluate our framework, we run exten-sive experiments on two datasets crawled from TaskRabbit and Google job search.
1
INTRODUCTION
Online job search is gaining popularity as it allows to find people to hire for jobs or to find jobs to apply for. Many online job search sites exist nowadays such as Facebook job search1and Google job search2. On those sites, users can find jobs that match their skills in nearby businesses. On the other hand, freelancing platforms such as TaskRabbit3and Fiverr4are examples of online job marketplaces that provide access to a pool of temporary employees in the physical world (e.g., looking for a plumber), or employees to complete virtual "micro-gigs" such as designing a logo. 1 https://www.facebook.com/jobs/ 2https://jobs.google.com/about/ 3 https://www.taskrabbit.com/ 4 https://www.fiverr.com/
© 2020 Copyright held by the owner/author(s). Published in Proceedings of the 23rd International Conference on Extending Database Technology (EDBT), March 30-April 2, 2020, ISBN 978-3-89318-083-7 on OpenProceedings.org.
Distribution of this paper is permitted under the terms of the Creative Commons license CC-by-nc-nd 4.0.
In online job search, either jobs are ranked for people or peo-ple are ranked for jobs. For instance, on Google and Facebook job search, a potential employee sees a ranked list of jobs while on TaskRabbit, an employer sees a ranked list of potential employees. This ranking of jobs or individuals naturally poses the question of fairness. For instance, consider two different users searching for a software development job in San Francisco using Google job search. If the users are shown different jobs based on their search and browsing history, which could correlate with their demographics such as race or gender, this may be considered unfair. Similarly, a ranking of job seekers in NYC might be unfair if it is biased towards certain groups of people, say where White Males are consistently ranked above Black Males or White Fe-males. This can commonly happen since such rankings might depend on the ratings of individuals and the number of jobs they completed, both of which can perpetuate bias against certain groups of individuals.
In this paper, we propose to quantify unfairness in ranking when looking for jobs online. We develop a unified framework to address group unfairness, which is defined as the unequal treatment of individuals based on their protected attributes such as gender, race, ethnicity, neighborhood, income, etc. [11]. To quantify unfairness for a group, we measure the difference in rankings between that group and itscomparable groups, i.e., those groups which share at least one protected attribute value with the given group. For instance, consider the group “Black Females”, comparable groups would be “Black Males”, “White Females” and “AsianFemales”.
The difference in ranking naturally depends on what is being ranked, jobs or people, and we formalize various measures of unfairness on different types of sites ( job search sites and on-line job marketplaces). Figures 1 and 2 illustrate examples of job ranking on Google job search and people ranking on TaskRabbit, respectively. For a given query on Google job search, “Home Cleaning" in location "San Francisco” in Figure 1, we quantify unfairness in ranking for a given demographic group, “Black Females”, using Kendall Tau (we also use Jaccard Coefficient in our data model), between the search results of black females and all other users in comparable groups, as is done in [12]. To quan-tify unfairness for “Black Females” on TaskRabbit for the query "Cleaning Services" in location "New York City", we compute the average Earth Mover’s Distance [20] between the distribution of rankings of Black Females and all comparable groups, as in [11]. In our framework, we also compute the difference of exposure of workers from this demographic group and their relevance in
contrast to comparable groups and then use this as a measure of unfairness for this group, as in [2, 22].
Figure 1: The unfairness for “Black Females” for the Google job search query “Home Cleaning" in location "San Francisco” using Kendall Tau between the search results of Black Females and all other users in comparable groups is0.70+0.50+0.30
3 = 0.50.
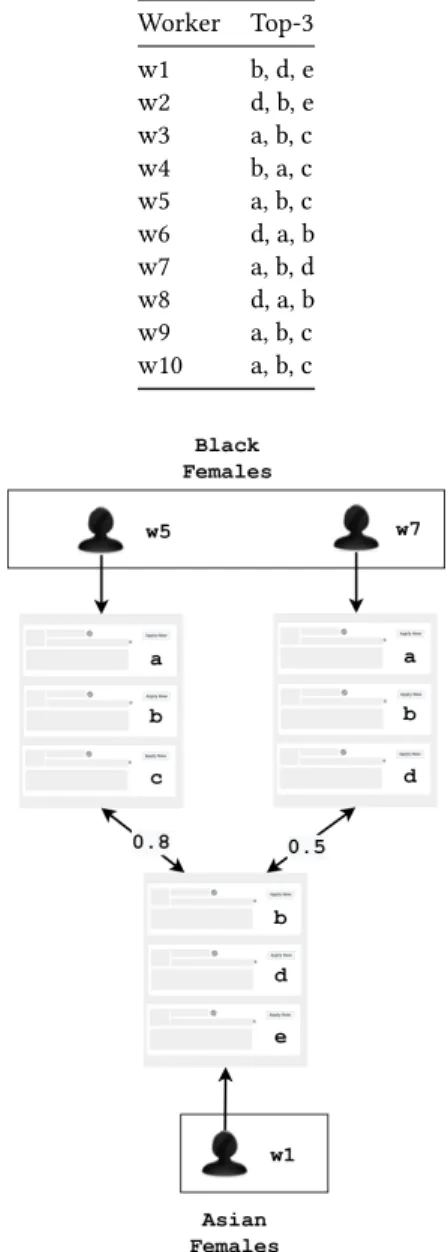
Figure 2: The unfairness for “Black Females” for the query "Cleaning Services" in location "New York City" on TaskRabbit using Earth Mover’s Distance between rank-ing distributions of Black Females and its comparable groups is0.45+0.25+0.65
3 = 0.45.
Various fairness questions can be formulated either to quantify how well a site treats groups for different jobs and at different locations, or to compare groups, queries or locations. Our frame-work allows us to define two generic fairness problems: quan-tification, such as finding thek groups (resp., queries, locations) for which the site is most or least unfair, andcomparison, such as finding the locations at which fairness between two groups differs from all locations, or finding the queries for which fairness at two locations differ from all queries. Examples ofquantification questions are:what are the five groups for which Google job search is most unfair? what are the five fairest queries for women? and at which locations do Asians have the highest chance to be hired for a given job?. Examples of comparison questions are: how differently does TaskRabbit treat men and women and for which queries is the treatment different? at which locations is it easiest to be hired as
a house cleaner than as a gardener? and which jobs are the most likely to accept hiring asian females over black females?.
We develop efficient Fagin top-k algorithms to solve our prob-lems. Our algorithms make use of three types of indices: group-based, query-group-based, and location-group-based, that pre-compute unfair-ness values for combinations of groups, queries and locations, for faster processing.
To evaluate our framework, we run extensive experiments on two datasets crawled from Google job search and TaskRabbit. The choice of these two platforms is justified by our goal to show the applicability of our framework to two different treatments of online employment, namely ranking jobs and ranking workers. We ran 5,361 queries on TaskRabbit and extracted for each query, the rank of each tasker, their profile pictures, and demographics, where the number of taskers returned per query was limited to 50. We processed the results and recorded unfairness values. We then derived user groups of interest and equivalent Google search terms from data crawled from TaskRabbit. This resulted in 20 queries (the top 10 and bottom 10 frequently searched queries) and their corresponding locations from data crawled in TaskRabbit. We setup 60 user studies on Prolific Academic5and recruited participants, who belong to chosen groups. To control for noise in search, we asked those participants to use a Google Chrome extension we developed that automatically executes on Google the search queries in 10 locations. We processed the results and recorded unfairness values.
Our results are organized into the two problems we solve: fair-ness quantification and fairfair-ness comparison. On TaskRabbit, we found thatAsian Females and Asian Males are the ones most dis-criminated against. We also found that Handyman and Yard Work are the most unfair jobs and that Furniture Assembly and Delivery, are the fairest and that Birmingham, UK and Oklahoma City, OK are the least fair while Chicago and San Francisco are the fairest locations across all jobs. We also quantified the fairest/unfairest locations for some jobs and the fairest/unfairest jobs for some locations. Our TaskRabbit results demonstratethe flexibility and expressiveness of fairness quantification, and provided the ability to generatehypotheses to be tested on Google job search.
On Google job search, we found thatWashington, DC is deemed the fairest. On the other hand, London, UK is deemed the unfairest location. For queries, we found that Yard Work jobs are deemed the most unfair whereas Furniture Assembly jobs are deemed the most fair.
While fairness quantification resulted in largely known results, our fairness comparison experiment on both platforms revealed new results. For instance,on TaskRabbit, in Chicago, Nashville and San Francisco, Females are treated more fairly than Males, which differs from the overall comparison. Most results are consistent between EMD and Exposure. Similarly for Google job search, most results are consistent between Jaccard and Kendall Tau. This is quite encouraging and and merits further investigation in future work.
The paper is organized as follows. We review related work in Section 2. In Section 3, we present our data model. In Section 4 we describe our unfairness problems and the algorithms we use to solve these problems. Section 5 describes our case study on two sites, Google job search and TaskRabbit. Finally, we conclude and present future work in Section 6.
5
2
RELATED WORK
To the best of our knowledge, our work is the first to formal-ize group-fairness, query-fairness, location-fairness, and fairness comparisons, and conduct an extensive evaluation of job search on a virtual marketplace and a job search site. Further statisti-cal and manual investigations are necessary for causality and explainability. Our goal is to reduce initial manual effort by pro-viding necessary tools to assess fairness.
Fairness has been trending in research for the last few years as we increasingly rely on algorithms for decision making. Bias has been identified as a major risk in algorithmic decision mak-ing [4, 11, 16, 23, 27]. One algorithmic solution is based on the formalization in [16] to quantify unfairness. To detect unfairness in algorithms, a framework [24] for "unwarranted associations" was designed to identify associations between a protected at-tribute, such as a person’s race, and the algorithmic output using the FairTest tool. In [11], the notion of unfairness was defined as a disparity in treatment between different groups of people based on their protected attributes (i.e., what is commonly referred to asgroup unfairness). In this context, to assess unfairness mathe-matically, one needs to compare distributions of decisions across different groups of people. In our work, we adapt the definition of unfairness in [11]. However, rather than trying to fix it, the goal of our work is to justreveal any unfairness by the ranking pro-cess, which in some cases might bepositive discrimination [19] where certain disadvantaged individuals are favored based on their protected attributes.
There is a wealth of work on addressing fairness of ranking in general (for example [6, 16, 22, 24–26]). Unlike our work, the ma-jority of these works that focus on group fairness either assume the presence of pre-defined groups based on protected attributes of users, or the presence of ranking constraints that bound the number of users per protected attribute value in the top-k rank-ing. On the other hand, the work in [2] focuses on addressing amortized individual fairness in a series of rankings. In [15], the authors introducesubgroup fairness and formalize the problem of auditing and learning classifiers for a rich class of subgroups. Our work differs in many ways: we are interested in ranking individuals and not classifying them, as well as ranking jobs and we seek to quantify the fairness of jobs, locations and groups and compare fairness across different dimensions.
In [1], the authors develop a system that helps users inspect how assigning different weights to ranking criteria affects rank-ing. Each ranking function can be expressed as a point in a multi-dimensional space. For a broad range of fairness criteria, includ-ing proportionality, they show how to efficiently identify groups (defined as a combination of multiple protected attributes). Their system tells users whether their proposed ranking function satis-fies the desired fairness criteria and, if it does not, suggests the smallest modification that does.
In [9], the authors studied fairness of ranking in online job marketplaces. To do this, they defined an optimization problem to find a partitioning of the individuals being ranked based on their protected attributes that exhibits the highest unfairness by a given scoring function. They used the Earth Mover’s Distance between score distributions as a measure of unfairness. Unlike other related work, we did not assume a pre-defined partition-ing of individuals and instead developed two different fairness problems, one aiming at quantifying fairness and the other at comparing it.
There is a wealth of work that empirically assessed fairness in online markets such as crowdsourcing or freelancing plat-forms [8, 13, 17, 17, 21]. For instance, the authors in [17] analyze ten categories of design and policy choices through which plat-forms may make themselves more or less conducive to discrimi-nation by users. In [13], the authors found evidence of bias in two prominent online freelance marketplace, TaskRabbit and Fiverr. Precisely, in both marketplaces, they found that gender and race are significantly correlated with worker evaluations, which could harm the employment opportunities afforded to the workers on these platforms. The work in [21] studies the Uber platform to explore how bias may creep into evaluations of drivers through consumer-sourced rating systems. They concluded that while companies like Uber are legally prohibited from making employ-ment decisions based on protected characteristics of workers, their reliance on potentially biased consumer ratings to make material determinations may nonetheless lead to a disparate im-pact in employment outcomes. Finally, discrimination in Airbnb was studied in [8] and high evidence of discrimination against African American guests was reported.
In [7], the authors study ethics in crowd work in general. They analyze recent crowdsourcing literature and extract ethical issues by following the PAPA (privacy, accuracy, property, accessibility of information) concept, a well-established approach in informa-tion systems. The review focuses on the individual perspective of crowd workers, which addresses their working conditions and benefits.
Several discrimination scenarios in task qualification and al-gorithmic task assignment were defined in [3]. That includes only accounting for requester preferences without quantifying how that affects workers, and vice versa. Another discriminatory scenario in [3] is related to worker’s compensation since a re-quester can reject work and not pay the worker or a worker can be under-payed. Discrimination in crowdsourcing can be defined for different processes.
In [18], the authors study how to reduce unfairness in vir-tual marketplaces. Two principles must be adapted: 1) platforms should track the composition of their population to shed light on groups being discriminated against; and 2) platforms should experiment on their algorithms and data-sets in a timely man-ner to check for discrimination. In this same paper, the authors define four design strategies to help reduce discrimination, a platform manager should first answer these questions: 1) are we providing too much information? 2) can we automate the transaction process further? 3) can we remind the user of dis-criminatory consequences when they are making a decision? 4) should the algorithm be discrimination-aware? In question 1), they address the issue of transparency. Discrimination and trans-parency might be highly correlated but their correlation has yet to be studied profoundly. In [3], transparency plug-ins are reviewed. Those plug-ins disclose computed information, from worker’s performance to requester’s ratings such as TurkBench [14], and Crowd-Workers [5]. Such plug-ins might be helpful in a more detailed study of the effect of transparency on fairness.
3
FRAMEWORK
3.1
Unfairness Model
On any given site, we consider a set of groupsG, a set of job-related queriesQ, and a set of locations L. We associate to each groupд a label label(д) in the form of a conjunction of predicates a = val. We use A(д) to refer to all attributes used in label(д). For
example, iflabel(д) is (gender = male) ∧ (ethnicity = black), we have:A(д) is {gender, ethnicity}. We define variants(д, a) where a ∈ A(д) as all groups whose label differs from д on the value of a. For instance,variants(д, gender) contains a single group whose la-bel is(gender = female) ∧ (ethnicity = black), variants(д, ethnicity) contains two groups whose labels are(gender = male) ∧ (ethnicity = asian) and (gender = male) ∧ (ethnicity = white), respectively.
We define the set ofcomparable groups for a groupд as {д′∈ ∪a ∈A(д)variants(д, a)}. In our example, it is variants(д, gender)∪ variants(д, ethnicity). This notion of comparable groups can be more easily leveraged for explanations. To consider other notions, we believe we would need to extend only our fairness model, and not the full framework.
Each queryq ∈ Q contains a set of keywords such as “Home Cleaning” or “Logo Design”. The same query can be asked at different geographic locationsl ∈ L. In some applications such as TaskRabbit, a query will be used to refer to a set of jobs in the same category such as Handyman, Furniture Assembly and Delivery services.
We denote byd<д,q,l >the unfairness value of the triple< д, q, l >. We discuss next how this unfairness value is computed for different types of sites.
3.2
Unfairness Measure for Search Engines
In a search engine such as Google Search, each useru ∈ д is associated with a ranked list of search resultsEql(u). We compute unfairness ofд as:
d<д,q,l >= avgд′DIST (д,д′)∀д′∈ ∪a ∈A(д)variants(д, a) (1)
A common way to compare search results is to use measures such as Jaccard Index or Kendall Tau [12]. Hence, we define DIST (д,д′) as one of the following two:
• avg u,u′τ (E
l
q(u), Elq(u′)), ∀u ∈ д, ∀u′∈д′, whereτ (Elq(д), Elq(д′)) is the Kendall Tau between the ranked listsElq(u) and Elq(u′).
• avg
u,u′JACCARD(E
l
q(u), Eql(u′)),
∀u ∈ д, ∀u′∈д′, whereJACCARD(Eql(u), Elq(u′)) is the Jaccard Index between the ranked listsElq(u) and Eql(u′). In Table 1, we display a toy example of the top-3 results for 10 users on a search engine for the query "Home Cleaning" in location "San Francisco". Figure 3 shows how the unfairness value for the group "Black Females" is computed using Jaccard index. In the figure, the Jaccard index between every Black Female user and Asian Female user is computed and then average of the Jaccard index is used to measure unfairness value between the two groups "Black Females" and "Asian Females". To compute the overall unfairness value for the group "Black Females", the same computation must be done between Black Females and all other comparable groups, namely "Black Males" and "White Females" and then the average of the individual unfairness values between groups is taken.
3.3
Unfairness Measure for Online Job
Marketplaces
In online marketplaces such as TaskRabbit, we are given a set of workersW, and a scoring functionfql :W → [0, 1]. Each workerw ∈ W is ranked based on her score fql(w). To measure
Table 1: Top-3 results for 10 users for the query "Home Cleaning" in location "San Francisco" on a search engine.
Worker Top-3 w1 b, d, e w2 d, b, e w3 a, b, c w4 b, a, c w5 a, b, c w6 d, a, b w7 a, b, d w8 d, a, b w9 a, b, c w10 a, b, c
Figure 3: The partial unfairness in a search engine for “Black Females” in Table 2 with respect to one of its com-parable groups, "Asian Females", using Jaccard Index is
0.8+0.5 2 = 0.65.
d<д,q,l >, we can use one of two methods:Earth Mover’s Distance (EMD) [20] and Exposure [2, 22].
3.3.1 EMD Unfairness. In the EMD notion of unfairness, the unfairness for a groupд for query q at location l is computed as the distance between the score distributions of workers in group д and all its comparable groups д′ ∈ ∪
a ∈A(д)variants(д, a) as follows:
d<д,q,l >= avgд′DIST (д,д′)∀д′∈ ∪a ∈A(д)variants(д, a) (2)
where
DIST (д,д′)= EMD(h(д, fl
q), h(д′, fql))
whereh(д, fql) is a histogram of the scores of workers inд using fl
In Table 2, we show a toy example consisting of 10 workers looking for a "Home Cleaning" job in San Francisco and their protected attributes. The ranking of these workers is shown in Table 3. Figure 4 illustrates how the EMD unfairness of Black Females,д, is calculated. Since A(д) is Gender and Ethnicity, the comparable groups in the toy example areBlack Males, Asian Females and White Females.
Table 2: Example of 10 workers looking for a "Home Clean-ing" job in San Francisco and their protected attributes
Worker Gender Nationality Ethnicity w1* Female America Asian w2 Male America White w3* Female America White w4 Male Other Asian w5 Female Other Black w6* Male America Black w7 Female America Black w8* Male Other Black w9 Male Other White w10* Female America White
Table 3: Ranking of the 10 workers for the query "Home Cleaning" in San Francisco on an online job marketplace
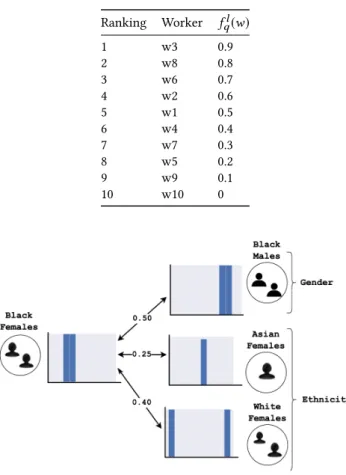
Ranking Worker fql(w) 1 w3 0.9 2 w8 0.8 3 w6 0.7 4 w2 0.6 5 w1 0.5 6 w4 0.4 7 w7 0.3 8 w5 0.2 9 w9 0.1 10 w10 0
Figure 4: The unfairness of “Black Females” based on the ranking in Table 3 using EMD is0.70+0.50+0.30
3 = 0.50. Since the actual scores of each worker for a query and location, fl
q(w) is not always available (no job marketplace makes that
score available), we rely on the rank of workersrank(w, q, l) to compute their relevance for a query and location. The rank of workers for a pair(q, l) is available since it can be observed in the results of runningq at l. We can hence compute rellq(w), the relevance score of a worker as follows:
relql(w) = 1 −rank(w, q, l) N
whererank(w, q, l) denotes the rank of worker w for query q at locationl as shown in Table 3, and N is the number of workers in the resultset, here set to 10. The relevance scores generated for all workers in our example are reported in Table 3.
To compute the EMD unfairness of Black Females for this query at this location, we generate a histogram for Black Females and each of the comparable groups based on the relevance scores relql(w) computed for workers. We then compute the average EMD between the histogram of Black Females and each of the comparable groups’ histograms.
3.3.2 Exposure Unfairness. In the exposure notion of fairness, the intuition is that higher ranked workers receive more exposure as people tend to only examine top-ranked results. Thus, each worker receives an exposure inversely proportional to her rank d<д,q,l > as follows. First, for everyw ∈ д, we compute her exposure as:
explq(w) = 1
loд(1 + rank(w,q,l))
We also compute the relevance of workerw ∈ д as rellq(w) as defined above. Now, the exposure of a group of workersд is set to: expql(д) = Í w ∈дexplq(w) Í д′∈д∪
a∈A(д)var iants(д,a)
Í
w ∈д′expql(w)
Similarly, we define the relevance of a groupд as: relql(д) =
Í
w ∈дrelql(w) Í
д′∈д∪
a∈A(д)var iants(д,a)
Í
w ∈д′relql(w)
Next, we assume that each groupд should receive exposure proportional to its relevance. We thus measure deviation from the ideal exposure using the L1-norm as the unfairness of a group д: d<д,q,l >= |explq(д) − relql(д)|.
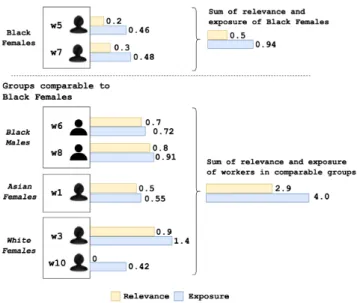
Figure 5 illustrates how the exposure unfairness of Black Fe-males,д, is calculated. To compute the exposure unfairness of Black Females for this query in the given location, we compute the exposure and relevance of all Black Female workers (bold in Table 2) and the workers belonging to their comparable groups (* in Table 2) usingfql(w) and ranking shown in 3. We then sum up the exposure and relevance values for all Black Females workers and the comparable groups separately.
3.4
Notation Generalization
We have usedd<д,q,l >to refer to the unfairness for groupд for the job-related queryq at location l. This value is obtained by contrasting the ranking for groupд with the ranking of all its comparable groups. Unfairness can also be computed for sev-eral job-related queries and at multiple locations. For a set of queriesQ ⊆ Q and a set of locations L ⊆ L, we can compute the unfairness for groupд as follows:
Figure 5: Computing the unfairness for “Black Females” based on the ranking in Table 3. The exposure of Black Females is 0.94
0.94+4.0 = 0.19. Its relevance is 0.5
0.5+2.9= 0.15. Its unfairness is 0.19 − 0.15= 0.04.
Similarly, we could compute the unfairness for a set of groups G ⊆ G at a location l ∈ L for all queries in Q ⊆ Q as follows:
d<G,Q,l > = avgд ∈G,q ∈Qd<д,q,l >
Finally, we could also compute the unfairness for a set of groups G ⊆ G for a given query q ∈ Q at all locations L ⊆ L as follows:
d<G,q,L>= avgд ∈G,l ∈Ld<д,q,l >
4
PROBLEMS AND ALGORITHMS
In this section, we first provide two generic problem formulations that capture the variety of group fairness questions we may ask (Section 4.1). We then describe the algorithms we designed to solve those problems (Section 4.2).
4.1
Problem Variants
To formulate a generic problem, we will use the termdimension to refer to one of group, query or location. Our first problem aims to quantify how well a site treats groups for different queries and at different locations. The problem returns instances of a chosen dimension, e.g., groups, and aggregates their unfairness values along the two others, e.g., queries and locations.
Problem 1 (Fairness Quantification). GivenR a dimension to be returned and two other dimensions AGG1 and AGG2 to be aggregated, return thek results in R for which the site is most/least unfair, where the unfairness for each resultr ∈ R, d<AGG1,AGG2,r >, is computed as: avgagg1∈AGG1, agg2 ∈AGG2d<aдд1,aдд2,r >
There are 3 instances of this problem: one whereR is a set of groups, one where it is a set of queries, and the third one where it is a set of locations.
WhenR is a set of groups, the problem, referred to as group-fairness, returnsk groups for which the site is most/least unfair. For instance, it could be used to findthe 5 groups for which the
site is least unfair with respect to all queries at all locations or to answer the question:Out of Black Males, Asian Males, Asian Females, and White Females, what are the 2 groups for which the site, say Google job search, is the most unfair?
WhenR is a set of queries, the problem, referred to as query-fairness returnsk queries which are the most/least unfair. This instance of the problem can address questions such aswhat are the 5 least unfair queries at all locations? or which 2 queries are black males most likely to get in the West Coast?
Finally, whenR refers to locations, the problem, referred to as location-fairness addresses questions such as Which 3 locations are the easiest to find a job at? or out of NYC, Boston and Washing-ton DC, what is the least unfair location for women looking for an event staffing job on a given site, say TaskRabbit?
Our second problem formulation aims to capture comparisons between two dimensions. It admits two dimensions to compare, e.g. males and females, or NYC and San Francisco, or cleaning services and event staffing, and it returns a breakdown of compar-ison dimensions into sub-dimensions whose fairness comparcompar-ison differs from the comparison of the input dimensions.
Problem 2 (Fairness Comparison). Given two comparison dimensionsr1andr2, and a breakdown dimensionB, return all b ∈ B s.t. d<r1,b > >= d<r2,b >∧d<r1,B><= d<r2,B>
∨d<r
1,b ><= d<r2,b >∧d<r1,B> >= d<r2,B>
The first instance of our comparison problem is referred to asgroup-comparison in whichr1andr2are demographic groups. For example, whenr1refers to Males,r2to Females, andB to locations, fairness comparison returns all locations where the comparison between males and females differs from that of all males and females. Table 4 shows an example. In this case, our problem returns the unfairness values of males and females at those two locations that compare differently from all locations. Table 4: Comparison between Male and Female workers in Oklahoma City and Salt Lake City differ from the over-all
Group-comparison Males Females All 0.48 0.74 Oklahoma City, OK 0.853 0.732 Salt Lake City, UT 0.933 0.553
The second instance of our comparison problem is referred to asquery-comparison. For example, ifr1is lawn mowing and r2furniture mounting andB is ethnicity, fairness comparison returns all ethnicities for which the comparison between lawn mowing and furniture mounting differs from the whole popula-tion. For instance, our problem finds that ethnicity Black must be returned because the unfairness values between lawn mowing and furniture mounting for blacks compare differently from all ethnicities.
The third instance of our comparison problem is referred to aslocation-comparison. For example whenr1is California, andr2 is Arizona, andB is outdoor home services, fairness comparison returns all queries related to outdoor home services (e.g., lawn mowing, garage cleaning, patio painting, etc), for which the com-parison in California and Arizona differs from all outdoor home services. Our problem returns the jobs garage cleaning and patio painting because the unfairness values between California and
Arizona for those two jobs are different from all outdoor home services.
4.2
Algorithms
The computational complexity of our problems calls for designing scalable solutions. In this section, we propose adaptations of Fagin’s algorithms to solve our problems. We first describe the indices we generate:group-based, query-based, and location-based. Thegroup-based indices associate to every (q, l) pair an in-verted index where groups are sorted in descending order based ond<д,q,l >.
Thequery-based indices associate to every (д, l) pair an in-verted index where queriesq are sorted in descending order based ond<д,q,l >.
Thelocation-based indices associate to every (д, q) pair an inverted index where locationsl are sorted in descending order based ond<д,q,l >. Table 5 shows an illustration of the three types of indices.
Table 5: Group-based, query-based, location-based indices I(q,l) . . дj d(дj, q, l) . . I(д,l) . . qj d(qj, д, l) . . I(д,q) . . lj d(д, q, lj) . .
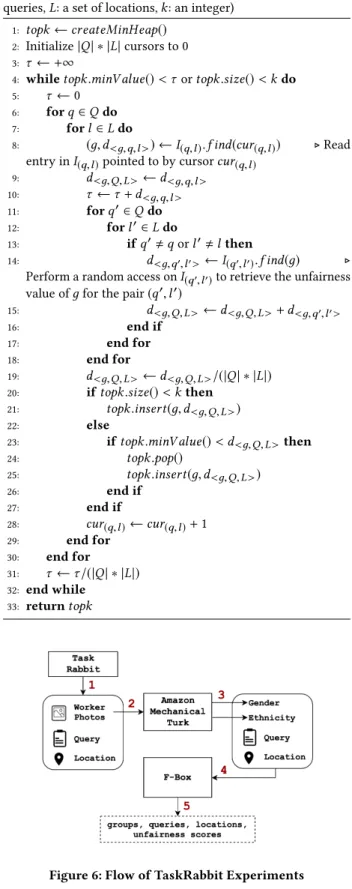
Algorithm 1 is an adaption of Fagin’s Threshold Algorithm [10] for thegroup-fairness instance of our problem. It finds thek groups for which the site is most unfair. The algorithm takes as input a set of groupsG, a set of queries Q and a set of locations L, and returns k groups. It makes use of the group-based indices (Table 5).
All other instances of Problem 1 including query-fairness, location-fairness and their bottomk versions, are adaptations of Algorithm 1.
Algorithm 2 solves our second problem (Problem 2) for the group-comparison instance of our problem. It takes as input 2 groupsд1andд2and a breakdown dimensionL. It first calls Algo-rithm 3 to compute the fairness values ofд1andд2for all values ofL and all queries Q. It then calls the query-based index to sum up all the values for all the queries by scanning the index for each location and for each of the two groups. Finally, it returns only those locations for which the order on unfairness values for the two groups is reversed. All other instances of Problem 2 including query-comparison and location-comparison are adaptations of Algorithm 2.
Algorithm 3 computes the fairness for a groupд for all queries inQ and all locations in L. It takes as input a group д, a set of queriesQ and a set of locations L, and returns the average unfairness value forд over all queries and locations.
5
EXPERIMENTS
Our experiments use real data collected from TaskRabbit and Google Search and were conducted from June to August 2019. We first describe the overall setup for each platform and then report the results.
5.1
Experimental setup
5.1.1 TaskRabbit setup. TaskRabbit is an online marketplace that matches freelance labor with local demand, allowing con-sumers to find immediate help with everyday tasks.
Algorithm 1 findTopKGroups(G: a set of groups, Q: a set of queries,L: a set of locations, k: an integer)
1: topk ← createMinHeap() 2: Initialize|Q | ∗ |L| cursors to 0 3: τ ← +∞
4: whiletopk.minV alue() < τ or topk.size() < k do 5: τ ← 0
6: forq ∈ Q do 7: forl ∈ L do
8: (д,d<д,q,l >) ←I(q,l).f ind(cur(q,l)) ▷ Read entry inI(q,l)pointed to by cursorcur(q,l)
9: d<д,Q,L>←d<д,q,l > 10: τ ← τ + d<д,q,l > 11: forq′∈Q do 12: forl′∈L do 13: ifq′, q or l′, l then 14: d<д,q′,l′>←I(q′,l′).f ind(д) ▷
Perform a random access onI(q′,l′)to retrieve the unfairness value ofд for the pair (q′, l′)
15: d<д,Q,L> ←d<д,Q,L>+ d<д,q′,l′> 16: end if 17: end for 18: end for 19: d<д,Q,L>←d<д,Q,L>/(|Q | ∗ |L|) 20: iftopk.size() < k then 21: topk.insert(д,d<д,Q,L>) 22: else
23: iftopk.minV alue() < d<д,Q,L>then 24: topk.pop() 25: topk.insert(д,d<д,Q,L>) 26: end if 27: end if 28: cur(q,l)←cur(q,l)+ 1 29: end for 30: end for 31: τ ← τ /(|Q | ∗ |L|) 32: end while 33: returntopk
Figure 6: Flow of TaskRabbit Experiments
TaskRabbit is supported in 56 different cities mostly in the US. For each location, we retrieved all jobs offered in that location. We thus generated a total of 5,361 job-related queries, where each query is a combination of a job and a location, e.g.,Home Cleaning in New York.
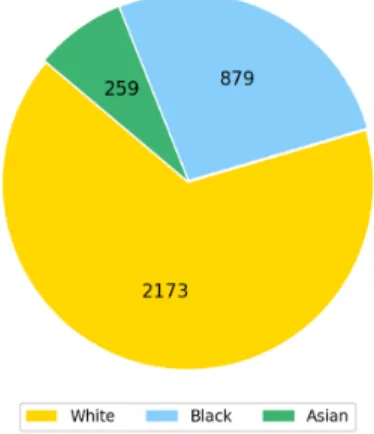
Figure 7: Gender breakdown Figure 8: Ethnic breakdown
Algorithm 2 CompareGroups(Groups:д1,д2,L: a set of locations as breakdown,Q: a set of queries)
1: loc ← ∅ 2: d<д 1,Q,L>← ComputeGroupUnfairness(д1, Q, L) 3: d(<д 2,Q,L>← ComputeGroupUnfairness(д2, Q, L) 4: forl ∈ L do 5: sum1← 0 6: sum2← 0 7: cur1← 0 8: cur2← 0 9: forq ∈ Q do 10: sum1+ = I(д 1,l).f ind(cur1) 11: sum2+ = I(д 2,l).f ind(cur2) 12: cur1←cur1+ 1 13: cur2←cur2+ 1 14: end for 15: if reversed(sum1, sum2, d<g 1,Q,L>, d<g2,Q,L>)then 16: loc+ = l 17: end if 18: end for 19: returnloc
Algorithm 3 ComputeGroupUnfairness(д: a group, Q: a set of queries,L: a set of locations)
1: sum ← 0 2: forq ∈ |Q | do 3: forl ∈ |L| do
4: sum ← sum + I(q,l).f ind(д) ▷ Perform a random access onI(q,l)to retrieve the unfairness value ofд for the pair(q, l)
5: end for 6: end for
7: returnsum/(|Q | ∗ |L|)
Figure 6 summarizes the flow of the TaskRabbit experiment. Our algorithms are encapsulated in the F-Box. For each one of the 5,361 queries, we extracted the rank of each tasker, their badges, reviews, profile pictures, and hourly rates, where the number of taskers returned per query was limited to 50. Since the demographics of the taskers were not readily available on the platform, we asked workers on Amazon Mechanical Turk
(AMT)6to indicate the gender and ethnicity of the TaskRabbit taskers based on their profile pictures. The taskers were given pre-defined categories for gender = {Male, Female} and ethnicity = {Asian, Black, White}. Each profile picture was labeled by three different contributors on AMT and a majority vote determined the final label.
The gender and ethnic breakdowns of the taskers in our dataset are shown in Figures 7 and 8. Overall, we had a total of 3,311 unique taskers in our crawled dataset, the majority of which were male (≈ 72%) and white (≈ 66%).
5.1.2 Google Search setup. Google Search personalizes queries based on a user’s profile which includes user data, activity, and saved preferences. While personalization can be beneficial to users, it may introduce the possibility of unfairness, which we aim to observe.
Figure 9: Flow of Google job search Experiments
We designed the experiments to ensure that variations in the search results are largely based on differences in profiles rather than other known noise sources identified in related work such as carry-over-effect, geolocation, distributed infrastructure, and A/B testing [12].
The flow of the Google Search experiment is summarized in Figure 9. We first derived user groups of interest and equivalent Google search terms from data crawled from TaskRabbit. We then setup user studies on Prolific Academic7and recruited partici-pants, who belong to those groups. We asked those participants
6
https://mturk.com
7
Table 6: Sample TaskRabbit queries and equivalent Google search terms
TaskRabbit Query Location Equivalent Google Search Terms
run errand London, UK run errand jobs near London UK, errand service jobs near London UK, errand runner jobs near London, UK, errands and odd jobs near London, UK, jobs running errands for seniors near London, UK
yard work New York City, NY yard work jobs near New York City, NY, yard worker near New York City, NY, lawn work needed near New York City, NY, yard help needed near New York City, NY, yard work help wanted near New York City, NY
to use our Google Chrome extension that automatically executes on Google the search queries derived. Finally, we processed the results and provided them as input to the F-Box and recorded unfairness values.
Search Queries. For our Google Search experiments, we se-lected 20 queries (the top 10 and bottom 10 frequently searched queries) and their corresponding locations from data crawled in TaskRabbit. From this list, we chose those from 10 unique loca-tions. We then generated equivalent search terms using Google Keyword Planner, a tool that outputs a list of search terms similar or related to a given search string and a location. We shortlisted 50 formulations for each query, manually examined them, then chose 5 search terms whose results are similar to the original term. Table 6 shows sample queries from TaskRabbit and their equivalent Google search terms.
Groups. The combination of pre-defined categories for gender = {Male, Female} and ethnicity = {Asian, Black, White} results in six groups: Asian Male, Asian Female, Black Male, Black Female, White Male, and White Female.
We recruited an average of 3 participants per study through Prolific Academic, a crowdsourcing platform that allows researchers to recruit participants who have been categorized through the platform’s screening mechanism.
User Study. Given the search terms and the groups, we have a total of 60 studies. Each study is composed of two tasks. In the first task, a participant is asked to set her browsing language to English and install our Google Chrome extension that runs the search terms. Participants who are able to successfully complete the first task are invited to do a second task where they are asked whether they think the instructions of the first task were clear and whether the reward is fair. The reward for each task is 0.50 GBP.
Given the distribution of workers on Prolific Academic, we ended up with 10 locations, namely London, UK, New York City, NY, Los Angeles, CA, Boston, MA, Bristol, UK, Charlotte, NC, Pittsburg, PA, Birmingham, UK, Manchester, UK and Detroit, MI. For those 10 locations, we have five categories of jobs: yard work, general cleaning, event staffing, moving job and run errand. Table 7 shows the number of locations per job that we collected search results for.
Google Chrome Extension and noise handling. We developed a Google Chrome extension that automatically executes the Google search terms. The extension runs the five search terms every 12 minutes to minimize noise due to the carry-over effect. Mean-while, every search term is executed at least twice to account for noise caused by A/B testing. The extension also sets the browser’s location to a fixed location and uses a proxy so that all queries originate from the same location thus minimizing noise caused by
Table 7: Number of locations per job
Job Location yard work 4 general cleaning 3 event staffing 1 moving job 1 run errand 1
distributed infrastructure and different geolocations. The search results are then inserted to a Google Sheets document. We empha-sized to the participants that we store no identifying information about them.
5.2
Fairness quantification
5.2.1 TaskRabbit fairness quantification. We report the results of solving our fairness quantification problem (Problem 1 in Section 4.1) for groups, queries and locations using both EMD and exposure to measure unfairness (see Sections 3.3.1 and 3.3.2 for their formal definitions).
Table 8 reports all groups in TaskRabbit ranked by their de-creasing unfairness values (both EMD and exposure). We can see that the two measures agree on the top 7 groups for whom TaskRabbit is the most unfair:Asian Females and Asian Males are the ones most discriminated against.
Table 9 reports all job types in TaskRabbit ranked by their decreasing unfairness values (both EMD and exposure). The two measures largely agree on the ranking showing thatHandyman and Yard Work are the most unfair jobs and that Furniture Assembly and Delivery, are the fairest.
Since the number of locations is large, we report the top and bottom 10 locations in Tables 10 and 11 respectively. The results show thatBirmingham, UK and Oklahoma City, OK are the least fair while Chicago and San Francisco are the fairest locations across all jobs.
We also report the fairest/unfairest locations for some jobs and the fairest/unfairest jobs for some locations.For Handyman and Run Errands, the fairest location is San Francisco Bay Area, CA for both when using EMD and, when using exposure, it is Boston, MA for Handyman, and San Francisco Bay Area, CA for Run Errands. The unfairest location for both jobs is Birmingham, UK when using EMD.
For Birmingham, Detroit, and Nashville, the fairest jobs are Delivery and Furniture Assembly for all, and the unfairest are Yard Work, General Cleaning, and General Cleaning, respectively. For Philadelphia, San Diego and Chicago, the fairest jobs are Delivery, Furniture Assembly, and Delivery, respectively, and the unfairest is Yard Work for Birmingham, Detroit, and Run Errands for Nashville.
Table 8: EMD and Exposure of all groups in TaskRabbit, ranked from the unfairest to the fairest.
Group EMD Group Exposure
Asian Female 0.876 Asian Female 0.821
Asian Male 0.755 Asian Male 0.662
Black Female 0.726 Black Female 0.615
Asian 0.694 Asian 0.594
Black Male 0.578 Black Male 0.413
White Female 0.542 White Female 0.359
Black 0.498 Black 0.341
Male 0.468 Female 0.299
Female 0.468 White Male 0.154
White 0.448 Male 0.117
White Male 0.421 White 0.104
Table 9: EMD and Exposure for all jobs in TaskRabbit, ranked from the unfairest to the fairest.
Job EMD Job Exposure
Handyman 0.692 Handyman 0.515
Event Staffing 0.639 Event Staffing 0.504
General Cleaning 0.611 General Cleaning 0.456
Yard Work 0.672 Yard Work 0.5
Moving 0.604 Moving 0.418
Delivery 0.499 Furniture Assembly 0.383
Furniture Assembly 0.541 Delivery 0.331
Run Errands 0.519 Run Errands 0.352
Table 10: 10 unfairest locations using EMD and Exposure, ranked from the unfairest to the fairest.
City EMD City Exposure
Birmingham, UK 1 Birmingham, UK 0.926
Oklahoma City, OK 0.998 Oklahoma City, OK 0.819
Bristol, UK 0.91 Bristol, UK 0.761
Manchester, UK 0.851 Manchester, UK 0.739
New Haven, CT 0.838 New Haven, CT 0.67
Milwaukee, WI 0.824 Memphis, TN 0.668
Indianapolis, IN 0.815 Milwaukee, WI 0.668
Nashville, TN 0.808 Charlotte, NC 0.643
Detroit, MI 0.806 Nashville, TN 0.637
Table 11: 10 fairest locations using EMD and Exposure, ranked from the fairest to the unfairest.
City EMD City Exposure
Chicago, IL 0.274 Chicago, IL 0.107
San Francisco, CA 0.286 San Francisco, CA 0.12
Washington, DC 0.329 Boston, MA 0.169
Los Angeles, CA 0.33 Washington, DC 0.174
Boston, MA 0.353 Los Angeles, CA 0.189
Atlanta, GA 0.4 Houston, TX 0.217
Houston, TX 0.417 Atlanta, GA 0.234
Orlando, FL 0.431 San Diego, CA 0.241
Philadelphia, PA 0.45 Orlando, FL 0.242
San Diego, CA 0.454 Philadelphia, PA 0.273
In summary, our results demonstrate the flexibility and expres-siveness provided by solving the fairness quantification problem for groups, queries and locations. They also provide the ability to generate hypotheses to be tested across platforms, in our case from TaskRabbit to Google job search.
5.2.2 Google fairness quantification. We ran our unfairness quantification algorithm (Algorithm 1) on the data crawled from Google Search. Our algorithm found that regardless of the metrics we use, Kendall Tau or Jaccard Index,the most discriminated against group is White Females and the least is Black Males. This indicates that search results between White Females were the most different, whereas those for Black Males were the most similar.
When quantifying unfairness for locations, we found that Washington, DC is deemed the fairest indicating no difference in search results between users at this location using both Jaccard Index and Kendall Tau. On the other hand,London, UK is deemed the unfairest location.
Finally, for queries, we found that using both metrics,Yard Work jobs are deemed the most unfair whereas Furniture Assembly jobs are deemed the most fair.
5.3
Fairness comparison
5.3.1 TaskRabbit fairness comparison. We report the results of solving our fairness comparison problem (Problem 2 in Sec-tion 4.1) in Tables 12, 13, 14 and 15. The tables only reportthe locations, demographics, and jobs that differ from the overall com-parison.
Table 12: Comparison between Male and Female workers after including locations using Exposure. The listed loca-tions are the ones for which Females are treated more fairly than Males, which differs from the overall comparison.
Group-comparison Males Females All 0.117 0.299 Charlotte, NC 0.399 0.345 Chicago, IL 0.062 0.062 Nashville, TN 0.330 0.309 Norfolk, VA 0.331 0.168 San Francisco Bay Area, CA 0.084 0.084 St. Louis, MO 0.255 0.190
Table 13: Comparison between Lawn Mowing and Event Decorating workers after including Ethnicity using EMD. Caucasians are the ones for which the comparison between Lawn Mowing jobs and Event Decorating jobs is different from the whole population, showing that Lawn Mowing jobs are fairer than Event Decorating for Caucasians.
Job-comparison Lawn Mowing Event Decorating All 0.674 0.613
White 0.552 0.569
In summary, we can conclude that overall, EMD and Exposure yield the same observations when solving the fairness comparison problem on TaskRabbit.
Table 14: Comparison between Lawn Mowing and Event Decorating jobs after including Ethnicity using Exposure. Unlike Table 13, in this case blacks are the ones for whom Lawn Mowing jobs are fairer than Event Decorating. This warrants further investigation in the future.
Job-comparison Lawn Mowing Event Decorating All 0.500 0.442
Black 0.445 0.453
Table 15: Comparison between San Francisco Bay Area and Chicago after including General Cleaning jobs using EMD. San Francisco is shown to be fairer for all jobs but the trend is inverted for the listed jobs.
Location-comparison San Francisco Bay Area, CA Chicago, IL
All 0.213 0.233
Back To Organized 0.198 0.135 Organize & Declutter 0.224 0.191 Organize Closet 0.174 0.153
5.3.2 Google fairness comparison. Similarly to TaskRabbit, we report the results of solving our fairness comparison problem (Problem 2 in Section 4.1) in Tables 16, 17, 18, 19, 20, and 21.The tables show the cases that differ from the overall comparison. Table 16: Comparison between Male and Female work-ers after including locations using Kendall Tau. The listed locations are the ones for which Females are treated more fairly than Males, which differs from the overall compari-son.
Group-comparison Males Females All 0.537 0.552 Birmingham, UK 0.906 0.901 Bristol, UK 0.921 0.918 Detroit, MI 0.928 0.901 New York City, NY 0.913 0.906
Table 17: Comparison between Male and Female workers after including locations using Jaccard. The results differ from the ones in Table 16 because the overall results differ. This warrants further investigation in the future.
Group-comparison Males Females All 0.395 0.393 Boston, MA 0.894 0.896 Charlotte, NC 0.893 0.901 London, UK 0.776 0.785 Los Angeles, CA 0.875 0.878 Manchester, UK 0.869 0.875 Pittsburgh, PA 0.877 0.88
In summary, we observed that Kendall Tau and Jaccard report mostly similar results when solving the fairness comparison problem on Google job search. This is quite encouraging and merits further investigation in future work.
Table 18: Comparison between Running Errands jobs and General Cleaning jobs after including Ethnicity using Kendall Tau.
Job-comparison Running Errands General Cleaning All 0.927 0.926
Black 0.927 0.950 Asian 0.925 0.938
Table 19: Comparison between Running Errands jobs and General cleaning jobs after including Ethnicity using Jac-card. The results differ from those reported in Table 18. This warrants further investigation in the future.
Job-comparison Running Errands General Cleaning All 0.902 0.887
Black 0.903 0.94
Table 20: Comparison between Boston, MA and Bristol, UK after including General Cleaning jobs using Kendall Tau. This result is similar to the one reported in Table 21.
Group Comparison Boston, MA Bristol, UK All 0.641 0.689 office cleaning jobs 0.735 0.627 private cleaning jobs 0.572 0.398 Table 21: Comparison between Boston, MA and Bristol, UK after including General Cleaning jobs using Jaccard. This result is similar to the one reported in Table 20.
Group Comparison Boston, MA Bristol, UK All 0.447 0.603 private cleaning jobs 0.403 0.364
6
CONCLUSION
We develop a framework to study fairness in job search and a detailed empirical evaluation of two sites: Google job search and TaskRabbit. We formulate two generic problems. Our first prob-lem returns thek least/most unfair dimensions, i.e., the k groups for which a site is most/least unfair, thek least/most unfair jobs (queries), or thek least/most unfair locations. Our second prob-lem captures comparisons between two dimensions. It admits two dimensions to compare, e.g. males and females, or NYC and San Francisco, or cleaning services and event staffing, and it returns a breakdown of those dimensions that exhibits different unfairness values (for instance, on TaskRabbit, while females are discrim-inated against when compared to males, this trend is inverted in California). We apply threshold-based algorithms to solve our problems. We report the results of extensive experiments on real datasets from TaskRabbit and Google job search.
Our framework can be used to generate hypotheses and verify them across sites. That is what we did from TaskRabbit to Google job search. It can also be used to verify hypotheses by solving the comparison problem. As a result, one could use it in iterative sce-narios where the purpose is to explore and compare fairness. We are currently designing such exploratory scenarios.
ACKNOWLEDGMENTS
This work is partially supported by the American University of Beirut Research Board (URB)
REFERENCES
[1] Abolfazl Asudeh, H. V. Jagadish, Julia Stoyanovich, and Gautam Das. 2019. Designing Fair Ranking Schemes. InProceedings of the 2019 International Conference on Management of Data, SIGMOD Conference 2019, Amsterdam, The Netherlands, June 30 - July 5, 2019. 1259–1276.
[2] Asia J Biega, Krishna P Gummadi, and Gerhard Weikum. 2018. Equity of Attention: Amortizing Individual Fairness in Rankings. arXiv preprint arXiv:1805.01788 (2018).
[3] Ria Mae Borromeo, Thomas Laurent, Motomichi Toyama, and Sihem Amer-Yahia. 2017.Fairness and Transparency in Crowdsourcing. InProceedings of the 20th International Conference on Extending Database Technology, EDBT 2017, Venice, Italy, March 21-24, 2017. 466–469. https://doi.org/10.5441/002/ edbt.2017.46
[4] Toon Calders and Sicco Verwer. 2010. Three naive Bayes approaches for discrimination-free classification.Data Mining and Knowledge Discovery 21, 2 (01 Sep 2010), 277–292. https://doi.org/10.1007/s10618- 010- 0190- x [5] Chris Callison-Burch. 2014. Crowd-Workers: Aggregating Information Across
Turkers To Help Them Find Higher Paying Work. InThe Second AAAI Con-ference on Human Computation and Crowdsourcing (HCOMP-2014). http: //cis.upenn.edu/~ccb/publications/crowd- workers.pdf
[6] L Elisa Celis, Damian Straszak, and Nisheeth K Vishnoi. 2017. Ranking with fairness constraints.arXiv preprint arXiv:1704.06840 (2017).
[7] David Durward, Ivo Blohm, and Jan Marco Leimeister. 2016. Is There PAPA in Crowd Work?: A Literature Review on Ethical Dimensions in Crowdsourcing. In Ubiquitous Intelligence & Computing, Advanced and Trusted Computing, Scalable Computing and Communications, Cloud and Big Data Computing, Internet of People, and Smart World Congress (UIC/ATC/ScalCom/CBDCom/IoP/SmartWorld), 2016 Intl IEEE Conferences. IEEE, 823–832.
[8] Benjamin Edelman, Michael Luca, and Dan Svirsky. 2017. Racial discrimination in the sharing economy: Evidence from a field experiment.American Economic Journal: Applied Economics 9, 2 (2017), 1–22.
[9] Shady Elbassuoni, Sihem Amer-Yahia, Christine El Atie, Ahmad Ghizzawi, and Bilel Oualha. 2019. Exploring Fairness of Ranking in Online Job Market-places. InAdvances in Database Technology - 22nd International Conference on Extending Database Technology, EDBT 2019, Lisbon, Portugal, March 26-29, 2019. 646–649.
[10] Ronald Fagin, Amnon Lotem, and Moni Naor. 2003. Optimal aggregation algorithms for middleware. Journal of computer and system sciences 66, 4 (2003), 614–656.
[11] Sorelle A. Friedler, Carlos Scheidegger, and Suresh Venkatasubramanian. 2016. On the (im)possibility of fairness.CoRR abs/1609.07236 (2016). http://arxiv. org/abs/1609.07236
[12] Aniko Hannak, Piotr Sapiezynski, Arash Molavi Kakhki, Balachander Krish-namurthy, David Lazer, Alan Mislove, and Christo Wilson. 2013. Measuring personalization of web search. InProceedings of the 22nd international confer-ence on World Wide Web. ACM, 527–538.
[13] AnikoHannak, Claudia Wagner,David Garcia,Alan Mislove,Markus Strohmaier, and Christo Wilson. 2017. Bias in Online Freelance Market-places: Evidence from TaskRabbit and Fiverr. InProceedings of the 2017 ACM Conference on Computer Supported Cooperative Work and Social Computing, CSCW 2017, Portland, OR, USA, February 25 - March 1, 2017. 1914–1933. [14] Benjamin V. Hanrahan, Jutta K. Willamowski, Saiganesh Swaminathan, and
David B. Martin. 2015. TurkBench: Rendering the Market for Turkers.. InCHI, Bo Begole, Jinwoo Kim, Kori Inkpen, and Woontack Woo (Eds.). ACM, 1613– 1616. http://dblp.uni- trier.de/db/conf/chi/chi2015.html#HanrahanWSM15 [15] Michael J. Kearns, Seth Neel, Aaron Roth, and Zhiwei Steven Wu. 2018.
Prevent-ing Fairness GerrymanderPrevent-ing: AuditPrevent-ing and LearnPrevent-ing for Subgroup Fairness. InProceedings of the 35th International Conference on Machine Learning, ICML 2018, Stockholmsmässan, Stockholm, Sweden, July 10-15, 2018. 2569–2577. [16] Keith Kirkpatrick. 2016. Battling algorithmic bias: how do we ensure
algo-rithms treat us fairly?Commun. ACM 59 (2016), 16–17.
[17] Karen Levy and Solon Barocas. 2017.Designing against discrimination in online markets.Berkeley Tech. LJ 32 (2017), 1183.
[18] Michael Luca and Rayl Fisman. 2016. Fixing Discrimination in Online Mar-ketplaces. Harvard Business Review (Dec 2016). https://hbr.org/product/ fixing- discrimination- in- online- marketplaces/R1612G- PDF- ENG [19] Mike Noon. 2010. The shackled runner: time to rethink positive
discrimina-tion?Work, Employment and Society 24, 4 (2010), 728–739.
[20] Ofir Pele and Michael Werman. 2009. Fast and robust earth mover’s distances. In2009 IEEE 12th International Conference on Computer Vision. IEEE, 460–467. [21] Alex Rosenblat, Karen EC Levy, Solon Barocas, and Tim Hwang. 2017.
criminating Tastes: Uber’s Customer Ratings as Vehicles for Workplace Dis-crimination.Policy & Internet 9, 3 (2017), 256–279.
[22] Ashudeep Singh and Thorsten Joachims. 2018. Fairness of Exposure in Rank-ings.arXiv preprint arXiv:1802.07281 (2018).
[23] Latanya Sweeney. 2013. Discrimination in Online Ad Delivery. CoRR abs/1301.6822 (2013). http://arxiv.org/abs/1301.6822
[24] Florian Tramèr, Vaggelis Atlidakis, Roxana Geambasu, Daniel J. Hsu, Jean-Pierre Hubaux, Mathias Humbert, Ari Juels, and Huang Lin. 2015. Discovering Unwarranted Associations in Data-Driven Applications with the FairTest Testing Toolkit.CoRR abs/1510.02377 (2015). http://arxiv.org/abs/1510.02377 [25] Ke Yang and Julia Stoyanovich. 2017. Measuring fairness in ranked outputs.
InSSDM. 22.
[26] Meike Zehlike, Francesco Bonchi, Carlos Castillo, Sara Hajian, Mohamed Megahed, and Ricardo Baeza-Yates. 2017. Fa* ir: A fair top-k ranking algorithm. InCIKM. 1569–1578.
[27] Indre Zliobaite. 2015. A survey on measuring indirect discrimination in machine learning.CoRR abs/1511.00148 (2015). http://arxiv.org/abs/1511. 00148