HAL Id: hal-02644415
https://hal-normandie-univ.archives-ouvertes.fr/hal-02644415
Submitted on 17 Dec 2020HAL is a multi-disciplinary open access archive for the deposit and dissemination of sci-entific research documents, whether they are pub-lished or not. The documents may come from teaching and research institutions in France or abroad, or from public or private research centers.
L’archive ouverte pluridisciplinaire HAL, est destinée au dépôt et à la diffusion de documents scientifiques de niveau recherche, publiés ou non, émanant des établissements d’enseignement et de recherche français ou étrangers, des laboratoires publics ou privés.
Promoter location on NiW/Al2O3 sulfide catalysts:
parallel study by IR/CO spectroscopy and High
Resolution STEM-HAADF microscopy
Luz Zavala Sanchez, Xavier Portier, Françoise Maugé, Laetitia Oliviero
To cite this version:
Luz Zavala Sanchez, Xavier Portier, Françoise Maugé, Laetitia Oliviero. Promoter location on NiW/Al2O3 sulfide catalysts: parallel study by IR/CO spectroscopy and High Resolution STEM-HAADF microscopy. ACS Catalysis, American Chemical Society, 2020, 10 (11), pp.6568-6578. �10.1021/acscatal.0c01092�. �hal-02644415�
1
Promoter location on NiW/Al
2
O
3
sulfide
catalysts: parallel study by IR/CO spectroscopy
and High Resolution STEM-HAADF
microscopy.
Luz A. Zavala-Sanchez,† Xavier Portier,‡ Francoise Maugé,† and Laetitia Oliviero*,†
† NORMANDIE UNIV, ENSICAEN, UNICAEN, CNRS, LCS, 14000 CAEN, FRANCE. ‡ Centre de Recherche sur les Ions, les Matériaux et la Photonique, CEA, UMR CNRS 6252, Normandie Université, ENSICAEN, UNICAEN, CNRS, 6, bd du Maréchal Juin, 14050 Caen, France.
KEYWORDS: HR STEM-HAADF, NiWS, Citric acid, CO adsorption, IR spectroscopy, contrast variations, HDS, promoter location, sulfide nanoparticle morphology.
ABSTRACT.
In this work, the effect of citric acid (CA) on the structure and activity of Ni promoted WS2 particles supported on γ-Al2O3 were investigated by HRTEM (High Resolution
2
Transmission Electron Microscopy), HR STEM-HAADF (High Resolution Scanning Transmission Electron Microscopy equipped with High Angular Annular Dark Field detector), CO adsorption followed by infrared (IR) spectroscopy and thiophene hydrodesulfurization (HDS ) test. It is shown that CA addition increases the thiophene HDS activity. This may be directly related to the increase in NiWS site concentration detected by IR spectroscopy. HRTEM emphasizes that the addition of CA to NiW catalysts decreases the average size of the particles. This is confirmed by HR STEM-HAADF that even evidence the presence of nanoclusters on NiW catalysts prepared with CA. Hence, local and global analysis of the NiW samples are in good agreement to account for the increase of NiWS site concentration by CA addition.
Then, the contrast and interatomic distances were analyzed in the atomic-scale images obtained by HR STEM-HAADF. These measurements allow identifying the nature of the atoms in the core and edge of the sulfided particles. The metal atoms of particle core are only W ones whereas the edges of the particles could be either fully promoted with detection of only Ni atoms, or partially promoted with detection of both Ni and W atoms. Accordingly, IR spectroscopy evidenced edge site with different promotion degrees.
3
Graphical Abstract
1. INTRODUCTION
Nowadays, it is fundamental to direct the efforts in the field of hydrodesulfurization (HDS) science towards highly active and sustainable catalysts. The demand for more ecological petroleum products that have lower sulfur content is growing due to the environmental and health problems caused by SOx emissions. The industrial HDS process uses Co (or
Ni)-promoted Transition Metal Sulfides (TMS) supported catalysts. The bimetallic sulfide phases, commonly called CoMoS, NiMoS or NiWS phases, corresponds to a nanolayer of Mo(W)S2 decorated by the promoter at its edges.1 For years, the outstanding catalytic
properties of NiW-based catalysts have attracted great attention due to its good performance in hydrogenation (HYD) and hydrodenitrogenation (HDN) reactions, especially in severe working conditions.2,3 The strong hydrogenation function of WS2 is
80 90 100 110 0 0.5 1.0 1.5 2.0 2.5 3.0 80 90 100 110 0 0.5 1.0 1.5 2.0 2.5 3.0 A) B) Int ensi ty (a. u.) 0.31 0.01 nm W-W 0.31 0.01 nmNi-Ni 80 90 100 110 0 0.5 1.0 1.5 2.0 2.5 probe position (nm) 0.28 0.01 nm W-Ni 1 nm C)
4
also beneficial in hydrocracking (HCK).4 In addition, NiW/Al2O3 sulfide catalysts have a
high potential for the conversion of heavy fractions.5 With the incoming emphasis on the production of ultra-low sulfur transport fuels in particular from heavy feedstocks, there is renovated interest in going deep insight into the structure of such NiW/Al2O3 sulfide
catalysts.6 The MoS2 based catalysts including those promoted by Co and Ni, have been
extensively investigated at atomic level through surface science study of model catalysts as well as through theoretical and experimental studies of industrial-like catalysts. By contrast, the WS2 phase and its promoted counterparts are poorly understood at the atomic level.4
Even though NiWS catalysts provide an improvement in the catalytic activity in aromatic hydrogenation, their use is not as widespread as CoMoS system. Often several difficulties arise that limit the use of NiW/Al2O3 catalysts such as (i) the difficulty to reach a high level
of sulfidation of the NiW phase due to strong metals-support interaction and (ii) the unfavorable formation of the mixed active phase of NiWS catalyst compared to the Mo-based catalysts.7,8 The lower concentration of NiWS in the catalysts is associated with the differences of sulfidation temperature of the metal supported species, which cause a premature sulfidation of the Ni and a subsequent segregation of the phases of Ni and W-sulfides.8 One strategy to overcome this challenge is the use of chelating agents during the preparation stage of the NiW phase. Indeed, organic chelating agents have been successfully used to prepare highly active Mo-based HDS catalysts with increased promotion degree.9–12 Chelating agents simplify the procedure of catalyst preparation since they are usually applied in a one-step co-impregnation procedure. Chelating agents favor the formation of strong complexes during the preparation and lead to a weakening of the metal-support interaction, all these features limit the separated sulfidation of the metal and
5
promoter.13 Among the various organic additives used, addition of citric acid (CA) has been well documented as an effective method to prepare a highly active bimetallic catalysts for HDS reactions.7,14,15 The impact of CA addition on the structure of the active phase has been investigated for both Mo and W based catalysts.16–22 However, for W-based catalysts, no clear evidence of the effect of the additive in the sulfide phase structure has been presented so far.
As a proven technique, low-temperature CO adsorption followed by infrared spectroscopy (IR/CO) has been used to characterize sulfide catalysts since several decades. It is now well established that IR/CO spectra of unpromoted Mo-based catalysts present two different CO adsorption bands,23 which are located at ~2110 and ~2070 cm-1 that accounts for Mo sites on M-edge and S-edge sites of MoS2 slabs. Quantification of the sites
of these two edges allowed to account for the morphology of the MoS2 slabs
(S-edge/M-edge ratio). These results are in agreement with morphologies observed by STEM-HAADF for the same catalysts.24 In addition, very recently through a parallel between IR/CO experiments and DFT calculations, it was possible to point out that the two IR/CO bands at 2126 and 2066 cm-1 observed on sulfide W/Al2O3 catalysts also reflect the M-edge and
S-edge sites of WS2 slabs.25 In general, IR/CO is particularly effective for the characterization
of surface sites of the sulfide catalysts, since it enables to characterize both the acidity of the support, the amount and the nature of the edge sites of the sulfide sites as well as the sulfide slab geometry.26
The observations by high resolution transmission electron microscopy (HRTEM) provide morphological information like length and stacking of the supported TMS slabs.27–
30
6
images suffer from contrast disturbances due to the support, particularly when this is an insulator as strong as alumina. Only slabs parallel to the electron beam can be observed. In contrast, with high angle annular dark-field scanning transmission electron microscopy (STEM-HAADF), images are formed by collecting electrons scattered at high angles by a dark field annular detector, whereby the intensities of the images depend on the atomic number of the elements. HR STEM-HAADF or Z-contrast image mode offers a significant advantage. Indeed, it facilitates the distinction of the elements according to their atomic number (Z), since the contrast is directly proportional to Z1.7, even for objects of a single atomic plane.31 This mode is suitable for the study of small nanoparticles formed by heavy elements, especially if they are deposited on a light-weighted support such as industrial alumina. Despite experimental evidence of differences in activity, NiWS catalysts are mostly assumed to behave similar, in some way, to the much more studied HDS CoMoS catalyst. Lately, STEM-HAADF has been successfully applied to investigate the shapes of WS2. Recently, Alphazan et al.32,33 reported on highly active W-based catalysts that their
enhanced activities are explained by the 2D-hexagonal morphology of WS2 particles.
Nevertheless, some questions remain: what about the morphology of promoted-W catalysts prepared with chelating agents such as citric acid? And more challenging, what about the location of the promoter? And finally, how the promoter decoration pattern is specifically in industrial-type catalysts?
In this work we report the effect of citric acid (CA) as a chelating agent on activity and structure of NiW supported catalysts. This work aims to explain the beneficial role of the citric acid at a molecular level. The formation of NiWS sites during catalyst sulfidation was
7
prepared with CA can be related to the enhanced amount of NiWS sites as evidenced by CO adsorption followed by IR spectroscopy. The consequent modifications of the use of CA on the morphology parameters such as average slab length, stacking and shape of the nanoparticles are analyzed by HR TEM and HR STEM-HAADF.
2. EXPERIMENTAL SECTION 2.1. Catalysts preparation
The series of NiW catalysts studied, which are denoted as NiW/(CA/M=x)/Al2O3, where x
refers to the molar ratio of CA/M, (M=Ni+W), were prepared by a one-step pore volume impregnation method. Hereafter, x refers to the molar ratio of CA/M (M=Ni+W) (x= 0, 0.5, 1.0, and 2.0). The aqueous impregnation solutions were prepared by dissolving variable amounts of citric acid (C6H8O7·H2O PROLABO) and fixed amounts of ammonium
metatungstate ((NH4)6H2W12O40·xH2O ALDRICH) and nickel (II) nitrate hexahydrate
(Ni(NO3)2·6H2O ALDRICH) in deionized water at room temperature. The NiW(CA/M=x)
solutions were added to the Al2O3 support (SASOL, specific surface area: 252 m2 g−1; pore
volume: 0.84 mL g−1) followed by a maturation stage of 2h at room temperature. To maintain the citric acid in its initial form up to the sulfidation stage, the catalysts were only dried for 16 h at 383 K without further calcination. All catalysts samples were prepared with a constant amount of W and Ni (20 wt % W and 2 wt % Ni content). For all the NiW(CA/M=x)/Al2O3 catalysts, the W content was fixed to 3.3 W atoms nm-2, and the
8
2.2. Composition and textural properties
2.2.1. Chemical analysis by Inductively Coupled Plasma
The elemental contents of Ni, W, and S in sulfide catalysts were determined by ICP method. Oxide catalysts were sulfided ex-situ in a glass reactor under 10% H2S/H2 (30 mL
min−1) flow. Catalysts were sulfided at 673K with a rate of 3 K min-1 during 2h. Then, the temperature was decreased to room temperature under ultra-pure N2 flow (30 mL min-1).
The catalyst inside the reactor was introduced in a dry glove box under Ar flow, to avoid air contact. Afterwards, inside of the dry glove box, 50 mg of sample was dissolved in hydrofluoric acid, aqua regia, boric acid, and water with a total volume of 100 ml. Tungsten and sulfur amounts present in the catalysts were quantified by an inductively coupled plasma atomic emission spectrometry (ICP-AES) using a PerkinElmer Optima 330DV ICP instrument.
2.2.2. Nitrogen physisorption analysis
Nitrogen adsorption/desorption isotherms of oxide and sulfide catalysts were measured at -196 °C using Micrometrics Model ASAP 2020 volumetric adsorption analyzer. Oxide samples were sulfided ex-situ in a glass reactor at 673 K (heating rate of 3 K min-1) under 30 ml min−1 of 10% H2S/H2 for 2 h. After that, the reactor was flushed by Ar at 623 K and
cooled down to room temperature. Then, the catalysts were degassed at 523 K under vacuum for 12 h prior to analysis. Specific surface areas were determined from the BET equation. The total volume was calculated from the volume adsorbed at P/P0 = 0.95. Pore size distributions of solids were estimated by Barrett-Joyner-Halenda (BJH) method.
9
2.3. Thiophene hydrodesulfurization test
The thiophene hydrodesulfurization (HDS) test was carried out with a differential glass reactor. Since the catalytic bed is very thin, it can be considered that the specific velocity corresponds to the initial velocity. Sulfidation procedure before thiophene HDS test, was performed at different temperatures (573-773 K) with a heating rate of 3 K min-1 at 0.1 MPa for 2 h under a 30 mL min-1 flow of 10% H2S/H2. Then, thiophene HDS test was
carried out at 623 K and 0.1 MPa with around (but precisely weighted) 25 mg of sulfided catalyst. Liquid thiophene (Alfa Aesar, 99%, extra pure) was introduced into the reactor by passing 70 mL min-1 of H2 flow through a thiophene saturator maintained at 291 K and
mixed with a flow of 20 ml min-1 of 10%H2S/H2 to keep steady state and avoid the
reduction of the catalyst. The partial pressures of thiophene, H2 and H2S in the mixture
were 8 kPa, 90.2 kPa, and 1.8 kPa, respectively. During 16 h reaction, the outlet gas was analyzed by a Varian 3900 chromatograph equipped with flame ionization (FID) detector. In order to maintain a differential reactor, the thiophene conversion was controlled below 10%. The reaction rate (rs) (mol h-1 kg-1) was calculated using the following formula:
(1)
Where x is the thiophene conversion (%), F is the molar flow rate of thiophene (mol h-1), mcat is the mass of the catalyst after sulfidation, respectively. The initial catalyst mass was
10
2.4. Low temperature CO adsorption followed by IR spectroscopy
The series of catalysts were characterized in situ by low-temperature (~100 K) CO adsorption followed by IR spectroscopy (IR/CO). CO adsorption was performed at low temperature to avoid any reaction with the catalyst surface. The oxidic catalyst was grounded and pressed into a self-supported wafer (~10 mg – precisely weighted, for a disc of 2.01 cm2) and positioned into a quartz IR cell with CaF2 windows. Before to the
adsorption experiments, the sample was sulfided in situ in the IR cell. For this, the catalysts was sulfided with a gas mixture containing 10% H2S/H2 (30 ml min-1) at 673 K (sulfiding
flow starting from room temperature) for two hours with a heating rate of 3 K min-1. After sulfidation, the cell was flushed with Ar and evacuated down to P<1˟10-4 Pa until the catalyst reached room temperature. CO adsorption at low temperature (100 K) was carried out introducing controlled CO pressure measured in a standard volume called small volume. These small calibrated doses of CO were introduced into the IR cell until equilibrium pressure of 133 Pa was reached. After each CO introduction, FTIR spectra were recorded with 256 scans and a resolution of 4 cm-1 using a Nicolet Nexus FTIR spectrometer equipped with a MCT detector (FTIR=Fourier Transform Infrared; MCT=Mercury-Cadmium-Tellurium). All spectra were normalized to a disc of 5 mg cm-2. The bands of the adsorbed CO species were obtained by subtracting the spectra recorded after and before CO introduction. The spectra were decomposed with Peakfit V4.12 using ''Autofit peak III-deconvolution'' and considering pseudo Voigt functions. For all the spectra, the second derivative function was used to ensure the good position of the bands in the spectral decomposition. For the decomposition of all spectra, the center and full width at half height (FWHH) of each peak are allowed to vary in a small range (± 3 cm-1).
11
2.5. Microscopy observation by HRTEM and HR STEM-HAADF
For microscopy observations, the oxide catalysts were sulfided at 673 K (heating rate of 3 K min-1) at a pressure value of 0.1 MPa for 2 h under a 30 mL min-1 flow of 10% H2S/H2.
Then, to limit detrimental exposure to air, the sulfided catalysts were unloaded from the sulfidation reactor under argon flow and poured into absolute ethanol. A few drops of the suspension of catalyst were put on a 300 mesh copper grid with holey carbon film. The images of sulfided catalysts presented in this work have been taken using a double corrected JEOL ARM 200F cold FEG microscope operated at 200 kV. First, length and stacking degree distributions of sulfide slabs were determined manually by measuring at least 300 slabs per sample from HRTEM images. The image treatment was performed using the commercial software GMS3 from GATAN (DIGITALMICROGRAPH) and free Mesurim software. The average length ( ) and the average stacking degree ( ) were calculated according to the following distribution modes given by the equations (2) and (3):
(2)
Where ( ) is the average length, ni the number (frequency) of slabs having the length
within the discrete interval i (nm), and n, the total number of particles or slabs. The number of slabs per stacked particle was determined to obtain the average stacking degree ( ):
12
Where ni is the number of slabs in Ni layers and n, the total number of particles or
slabs. The nanostructure and morphology of the NiWS slabs were analyzed by high resolution scanning transmission electron microscopy (HRSTEM) using a high angle annular dark field (HAADF) detector. All the STEM images presented in this manuscript were acquired in HAADF mode. The acquisition of one image lasted about 30 s with a resolution of 1024 pixels x 1024 pixels, (30 μs of exposure time for each spot in the scanning mode). During this acquisition and despite exposure to the electron beam, the shapes of the particles remained unchanged, meaning that the slabs were quite stable under the electron beam.
3. RESULTS AND DISCUSSION 3.1. Elemental analysis
Elemental analysis was performed by ICP after the sulfidation stage (Ts=673K) of the
catalysts in order to verify the sulfidation degree of the NiW catalysts (Table I). All the catalysts presented sufficient sulfur to form WS2, that is, the molar concentration of sulfur
is about twice that of tungsten. It is also observable that the S/W ratio increases with citric acid amount. Thus, this is an indication that the presence of citric acid favors the sulfidation of W.
13
Table I. Elemental analysis of NiW catalysts before and after sulfidation at 673K.
Sulfide catalyst % wt.W % wt. Ni Ni/(W+Ni) * S/(W+Ni) *
NiW(CA/M=0)/Al2O3 21 12 0.4 1.7 NiW(CA/M=0.5)/Al2O3 22 11 0.3 1.9 NiW(CA/M=1)/Al2O3 21 10 0.3 2.0 NiW(CA/M=2)/Al2O3 20 10 0.3 2.2 * Atomic ratio 3.2. Textural properties
The nitrogen adsorption-desorption isotherms for both dried (oxidic) and sulfided NiW/Al2O3 catalysts correspond to a type IV isotherm according to IUPAC classification
with a H1 hysteresis loop, characteristic for mesoporous materials.34 Table II presents the effect of sulfidation on the specific surface area and pore diameter of the catalysts prepared with and without citric acid. It is interesting to note that as the concentration of the citric acid in the impregnation solution increases, the oxide catalyst suffers from a decrease in its surface area, possibly due to the blockage of the pores of the alumina by citric acid molecules. However, when carrying out the sulfidation process, it is observed how the catalysts progressively recover their surface area. This is a consequence of the low decomposition temperature (~448 K) of the citric acid relative to the sulfidation temperature (Ts=673 K). If we consider the surface area (252 m2 g-1) and pore size diameter of the pure γ-alumina carrier (12.5 nm), it is observed that the textural properties are almost maintained at the final stage of the catalyst with just a small decrease in surface area and pore size that is more marked when the amount of CA increases. This is likely related to the rising of the amount of carbonaceous deposits formed by CA on the catalyst.
14
Table II. Textural properties of NiW catalysts before and after sulfidation at 673K.
Catalyst SBET (m2 g-1) Pore diameter (nm)
dried sulfided dried sulfided NiW(CA/M=0)/Al2O3 193 224 10.6 11.9 NiW(CA/M=0.5)/Al2O3 160 221 10.9 11.7 NiW(CA/M=1)/Al2O3 107 212 10.5 11.4
NiW(CA/M=2)/Al2O3 89 207 9.7 11.1
3.3. Thiophene HDS activity
3.3.1. Effect of sulfidation temperature
It is generally reported that W-based catalysts present a greater difficulty for the sulfidation process than the Mo-based ones. This translates into that, compared to Mo-based catalysts, higher activation temperatures are required, as well as longer sulfidation times. It should be noted that nowadays there is no established protocol or widely accepted process regarding the optimal sulfidation parameters to use for W-based catalysts. In order to guarantee an optimal sulfidation procedure for the series of samples studied in this work, we carried out catalysts activation by varying the sulfidation temperature in the range of 573 K up to 723 K with 50 K intervals. To follow the sulfidation procedure impact, thiophene HDS performances were tested for all these catalysts sulfided in different conditions (Figure 1).
For NiW(CA/Mo=0)/Al2O3, its HDS reaction rate increases with the sulfidation
temperature, it exhibits the lowest HDS rate compared to catalyst prepared with CA. Moreover, in addition to being the catalyst with the lowest catalytic activity, it is also the only catalyst that shows an increase in reaction rate after sulfidation at 673 K.
15 Figure 1. Effect of sulfidation temperature of NiW(CA/M=x)/Al2O3 catalysts on the thiophene
HDS activity.
This indicates that the catalyst is not completely activated even at this high temperature. This is in agreement with the expected difficulty of sulfidation reported for W based catalysts.
As a general trend, the addition of citric acid increased the catalytic activity as observed for the NiW(CA/Mo= x)/Al2O3 with x=0.5,1.0 and 2.0. It is noticeable that even a
small concentration of CA leads to a clear beneficial effect. Moreover, the catalytic tests showed that an increase in the CA content accelerates the rate of reaction at any of the sulfidation temperatures. For the three samples prepared with CA, it was found that the sulfidation temperature at which the highest reaction rate is obtained was 673 K. If the catalysts are sulfided at higher temperature (Ts=723 K), a decrease in activity is observed.
This is linked to an agglomeration of the sulfided particles. This detrimental effect of high 0 10 20 30 40 50 60 550 600 650 700 750 T hi op he ne HD S rate (mol ·h -1 ·Kg -1 ) Sulfidation Temperature (K) CA/M = 0 CA/M = 0.5 CA/M = 1.0 CA/M = 2.0
16
Ts is not observed with the catalyst prepared without CA. This can be explained by an
improvement of the sulfidation degree at higher sulfidation temperature that counterbalanced the active phase sintering effect. Also, this can be related to a stronger anchorage of the sulfided phase on the support in absence of CA that limits the sintering.
The beneficial effect of the addition of CA in the catalysts can be explained by the fact that, by adding citric acid, an increase in the amount of Ni-AC complexes that will interact with tungsten is promoted, which makes it possible to form more NiWS active sites. This assumption will be explored by low temperature CO adsorption followed by IR spectroscopy.
3.3.2. Effect of the citric acid amount
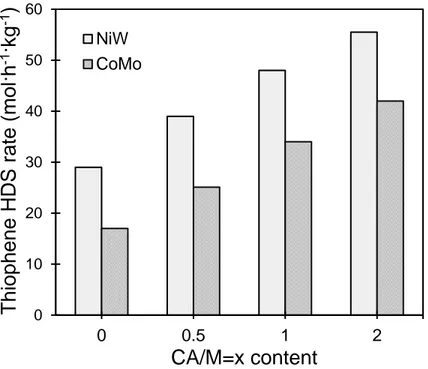
The influence of citric acid amount on the thiophene HDS activity of the sulfided NiW(CA/M=x)/Al2O3 is presented in Figure 2. NiW(CA/M = 0)/Al2O3 catalyst exhibits
the lowest HDS rate, and a general trend of increasing activity with the addition of citric acid is observed. The thiophene HDS rate gradually increases from 29 mol h−1 kg−1 on NiW(CA/M=0)/Al2O3 to 56 mol h−1 kg−1 on NiW(CA/M=2)/Al2O3. As already reported,
the addition of citric acid in NiWS catalysts increases the catalytic activity.7 The catalytic activity was also compared to the counter partner CoMo/Al2O3. It is observed that the NiW
series present enhanced activity and that the increase extent of HDS rate with CA is similar for both systems.
17 Figure 2. Effect CA addition on thiophene HDS activity of sulfided NiW(CA/M=x)/Al2O3 catalysts
sulfided at 673 K and CoMo(CA/M=x)/Al2O3 catalysts sulfided at 623 K.
3.4. IR spectroscopy of sulfided NiW/Al2O3 catalysts
Figure 3 shows the IR spectra of adsorption of 133 Pa of CO (Tads ~100 K) on sulfided
NiW(CA/M=x)/Al2O3 catalysts prepared with different CA amounts. It has to be noted that
the sulfidation of the NiW catalysts causes a marked decrease in the transmission of IR radiation. Globally, transmission is low due to the high metal loading present in the catalysts (23 wt % W+Ni). 0 10 20 30 40 50 60 0 0.5 1 2 NiW CoMo
Thi
oph
ene
HDS
rate
(m
ol·
h
-1·kg
-1)
CA/M=x content
18 Figure 3. IR spectra of CO adsorption (133 Pa CO at equilibrium, Tads=100K) on
NiW(CA/M=x)/Al2O3 catalysts sulfided at 673K. The inset zooms on the low wavenumber bands.
Four main ν(CO) bands at ~2186, ~2160, 2133 and 2094 cm-1 are observed on these catalysts. The higher wavenumber bands are assigned to CO adsorption on Lewis acid sites and acidic OH groups of the Al2O3 support. The two bands at lower wavenumber are
ascribed to CO adsorbed on the sulfide phase. The addition of CA increases the intensity ratio I2133/I2094. As confirmed by the inset of Figure 3, spectra also show the presence of
weak bands in the 1950 - 1900 cm-1 region, ascribed to metallic Ni.
Absorb
an
ce
(a.
u.)
1900
1950
2000
2050
2100
2150
2200
Wavenumbers (cm
-1)
0.04CA/M = 2.0
CA/M = 1.0
CA/M = 0.5
CA/M = 0
Al
+3OH
~2186
~2160
2133
2094
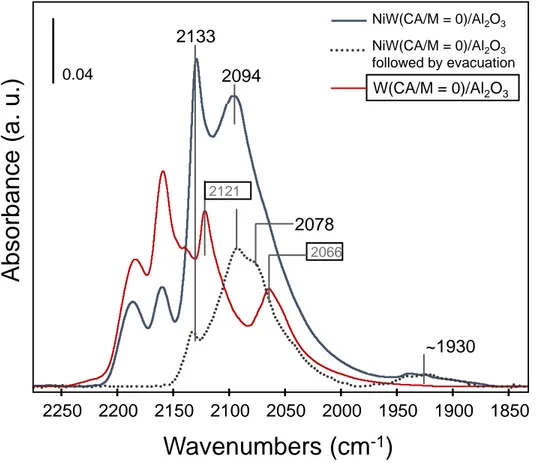
1880 1900 1920 1927 Wavenumbers (cm-1) 0.005 1940 193819 Figure 4. IR spectra of CO adsorbed on sulfided NiW(CA/M=0)/Al2O3 and W(CA/M=0)/Al2O3. Continuous lines: spectra taken at 100K in presence of Pequil = 133 Pa CO. Dotted line: spectra taken
after evacuation of CO at room temperature until reaching P<1 10-4 Pa.
Figure 4 compares spectra taken on NiW(CA/M=0)/Al2O3 and W(CA/M=0)/Al2O3
catalysts at different CO coverages, i.e., at full coverage (equilibrium 133 Pa) and after evacuation at 298 K. For W/Al2O3, two main bands at 2121 cm-1 and 2066 cm-1
characterize the sulfide phase. After evacuation at 298 K, no more CO adsorbed on sulfide sites is detected. As shown in a recent paper, these bands are respectively associated to CO adsorbed on M-edge and S-edge of the WS2 slabs.25 This confirms that the CO adsorption
on the unpromoted W sites is weak.
1850 1900 1950 2000 2050 2100 2150 2200 2250 0.04 2133 2094 2066 ~1930
Abso
rb
an
ce
(a
. u.)
Wavenumbers (cm
-1)
NiW(CA/M = 0)/Al2O3 NiW(CA/M = 0)/Al2O3 followed by evacuation W(CA/M = 0)/Al2O3 2121 207820 Figure 5. IR spectra of first CO doses (0.002 to 0.012 μmol CO·mg-1) adsorbed at 100 K on NiW(CA/M=0)/Al2O3 sulfided at 673 K. Each spectrum is presented with its second derivative
function (lighter curves).
Conversely, on NiW(CA/M=0)/Al2O3 catalyst, the main bands observed at 2133 and
2094 cm-1 remain after evacuation at 298 K with decreased intensity. The evacuation also puts in evidence the presence of a new component at 2078 cm-1. As observed in Figure 3, the presence of low wavenumber bands at ~1930 cm-1 is also noted in Figure 4.
A more accurate view can be obtained by analyzing the spectra for the first doses of CO introduced on NiW catalyst without CA (Figure 5). Figure 5 also presents the corresponding second derivatives calculated in order to specify the position of the various bands. The presence of the bands ascribed to non-promoted sites is also highlighted by this way. In conclusion, it can be considered that CO adsorbed on the sulfide phase of NiW
2000 2050 2100 2150
Wavenumbers (cm
-1)
0.01 1950 2133 cm-1 2094 cm -1 2078 cm -1 2066 cm -1 2121 cm -1Absor
bance
(a. u.)
21
catalysts prepared with and without CA gives rise to at least five bands at 2133, 2121, 2094, 2078 and 2066 cm-1.
Next, we focus on the assignation of these five contributions. As mentioned before, comparison between spectra obtained on NiW and W catalysts allows assigning the two bands at 2121 and 2066 cm-1 to the CO adsorbed on unpromoted W sites, located on M-edge and S-M-edge respectively. The question now concerns the assignment of the bands at 2133, 2094 and 2075 cm-1. These wavenumbers are very close to those reported on NiW catalysts by Zuo et al.35 and Duchet et al.36 The poor spectral quality of the spectra presented in the early work of Duchet et al.36 makes difficult specifying if these bands are characteristics of promoted or unpromoted W sites. Nevertheless, this work shows that increasing the temperature of gas phase sulfidation in the range 673-873 K, preferentially enhances the intensity of the band at ~2090 cm-1.36 Later, Zuo et al.35 studied the influence of the catalysts composition: increasing the Ni/W ratio (0.17 to 0.41) increases the CO uptake with development of the three bands. Thus, these bands were ascribed to NiWS sites. It was also reported that the wavenumber of CO band at ~2096 cm-1 is very close to that observed for Ni sulfide catalyst (2098 cm-1). Moreover, this band presents a specific behavior upon H2 treatment of sulfided NiW catalysts. Indeed, it markedly increases
whereas the two other bands at 2127 and 2079 cm-1 tend to disappear. Zuo et al.35 proposed that the three bands characterized interaction between Ni and W but in a different way: the band at ~2096 cm-1 is ascribed to Ni particles perturbed by WSx phase whereas the bands at
2127 and 2079 cm-1 would characterizeNiWS sites with different environments.
This interpretation can be refined considering previous assignments based on DFT calculation of CO adsorbed on Ni-promoted system.37 Thus, these bands could correspond
22
to NiWS sites but with different degrees of promotion (partially and totally). Hence, the bands at 2094 and 2078 cm-1 would correspond to CO adsorbed on partially promoted sites whereas the band at 2131 cm-1 would correspond to CO adsorbed on totally promoted NiW sites. This is also in agreement with the electron transfer on NiWS that should be from Ni to W. Hence, compared to unpromoted WS2 sites (2121 cm-1), v(CO) wavenumbers on
partially promoted sites are detected at lower frequencies (2094 and 2078 cm-1). On totally promoted sites, CO only interacts with Ni atoms. Compared to pure NiSx sites (2098 cm-1),
the CO frequency is indeed at a greater value (2131 cm-1). Such a rather high CO wavenumber was also reported for promoted sites of NiMo catalysts (2120 cm-1).37
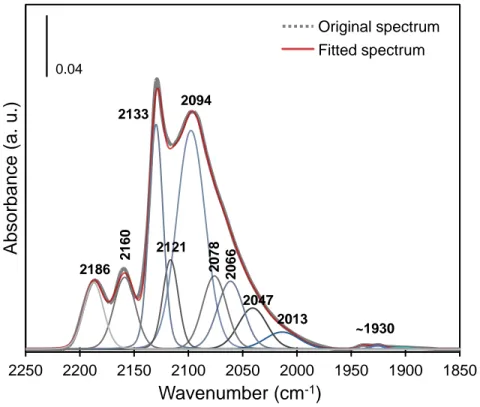
Figure 6. Decomposition of the IR spectrum of CO adsorption (PCO=133 Pa at equilibrium, T=100 K) on NiW(CA)/Al2O3 catalyst sulfided at 673 K with Peakfit V4.12.
1850 1900 1950 2000 2050 2100 2150 2200 2250 0.04 2047 2186 2160 2133 2121 2094 2078 2066 2013 ~1930 Original spectrum Fitted spectrum Wavenumber (cm-1) Ab sorbance (a. u.)
23
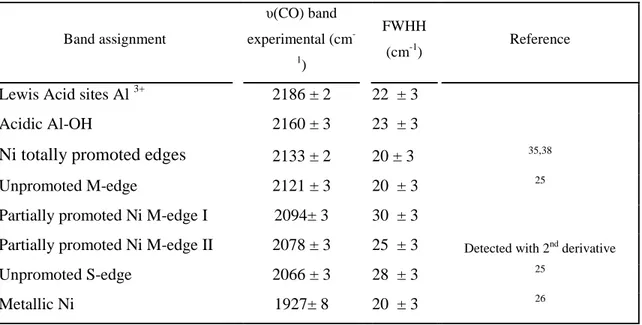
Table III. Assignment of main v(CO) bands on NiW(CA)/Al2O3 catalysts and parameters
used to fit the IR spectral bands.
Band assignment υ(CO) band experimental (cm -1) FWHH (cm-1) Reference
Lewis Acid sites Al 3+ 2186 ± 2 22 ± 3
Acidic Al-OH 2160 ± 3 23 ± 3
Ni totally promoted edges 2133 ± 2 20 ± 3 35,38
Unpromoted M-edge 2121 ± 3 20 ± 3 25
Partially promoted Ni M-edge I 2094± 3 30 ± 3
Partially promoted Ni M-edge II 2078 ± 3 25 ± 3 Detected with 2nd derivative
Unpromoted S-edge 2066 ± 3 28 ± 3 25
Metallic Ni 1927± 8 20 ± 3 26
spectra are decomposed with
pseudo-Voigt functions
Hence, CO spectra can account for partially and totally promoted NiWS sites (Table III). Going further in the assignment of promoted sites to M- and S-edge would require complementary experiments. As for the low wavenumber and small contribution at ~1927 cm-1, it is ascribed to metallic Ni in accordance to reference.26
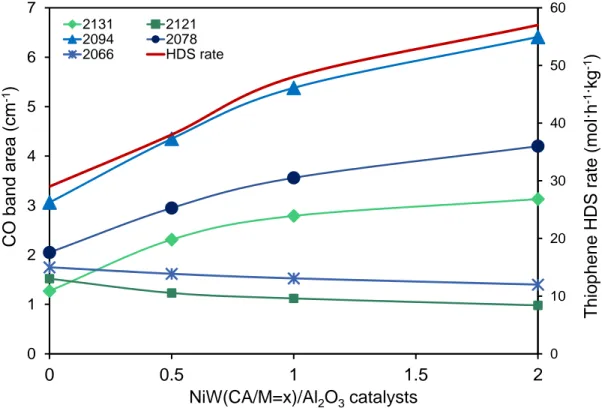
Figure 7 shows the influence of CA amount on the total area of the spectra ascribed to
CO in interaction with the sulfide sites. To go further, these spectra were decomposed as shown in Figure 6 and using the parameters mentioned in Table III. An increase of the three ν(CO) bands (2133, 2094 and 2078 cm-1) specific of NiWS sites is reported in Figure
7. These three NiWS bands increase in a very similar proportion with CA addition. In
parallel and as expected, the intensity of the specific bands of non-promoted W sites (2121 and 2066 cm-1) decreases, however slightly, with CA addition. They are detected whatever
24
the CA amount is, indicating that, even for the highest CA amount i.e., for the catalyst that presents the greatest amount of NiWS, some edges of WS2 slabs stay unpromoted. Figure 7
also points out a parallel between the increase of ν(CO) bands characteristic of NiWS sites and the rise of HDS activity. This parallel, between IR characterization and activity tests, shows that the increase of HDS activity on catalyst prepared with CA can be related to the enhanced formation of NiWS sites. These results can be compared with the ones obtained by Suárez-Toriello et al.7 where it was shown that citric acid coordinates the Ni atoms, hence, it prevents the formation of insoluble Ni species of the [Ni(OH)2(H2O)4] type in the
impregnating solution and promotes the formation of soluble Ni-AC complexes.
Figure 7. Effect of citric acid addition on the areas of different bands of the sulfided NiW (CA/M=x)/Al2O3 catalysts obtained by CO/IR. In this graphic the HDS thiophene rate divided by a
factor of ten is presented to evidence the parallel growth of certain bands along with the catalytic activity. 0 10 20 30 40 50 60 0 1 2 3 4 5 6 7 0 0.5 1 1.5 2 2131 2121 2094 2078 2066 HDS rate Thiophe ne HD S rate (mol·h -1 ·kg -1 ) NiW(CA/M=x)/Al2O3catalysts CO band ar ea (c m -1 )
25
The majority species in an acidic pH medium would be under the forms [Ni(HCit)(Cit) (H2O)4] 3- and [Ni(Cit)2(H2O)4] 4-. These ionic species will interact with the support and
form AlO-Ni-AC complexes.7,15 All these features are beneficial for NiWS phase formation. In addition, as shown on Mo-based catalysts,39 CA likely decreases the sulfide phase-support interaction. This will make tungsten more available and allows WS2
sulfidation at lower temperature avoiding early nickel sulfidation. Thus, this feature should also favored NiWS formation. Moreover, as shown previously, changing the W-support interaction could also affect the morphology of the sulfide phase.
3.5. Electron microscopy by HRTEM and STEM HAADF
Electron microscopy observations of NiW(CA/M=0)/Al2O3 and NiW(CA/M=2)/Al2O3 was
performed by HRTEM and HR-STEM HAADF techniques. The objective was to account for change of sulfide phase morphology i.e. slab size and stacking, shape of the sufide slabs, as well as to try to get information on the nature of the sulfide slab edges. Figure 8 shows typical HRTEM images of NiW(CA/M = 0)/Al2O3 and NiW(CA/M = 2)/Al2O3
catalysts. The distributions of length and stacking of the sulfide slabs were obtained after a careful analysis of more than 300 slabs Figure 8(C and D). It should be mentioned that in this work, we were able to reliably account for slabs of about 1 nm. These could be obtained by adjusting the local contrast of each zone analyzed of the high resolution pictures and also by taking the images with underfocus to increase the Fresnel fringes of the slabs when parallel to the beam. It was observed that the addition of citric acid does not lead to a significant decrease of the average slab length (3.11 ± 0.14 nm to 2.95 ± 0.14 nm).
26
Figure 8. HRTEM images of NiW(CA/M=0)/Al2O3 (A) and NiW(CA/M=2)/Al2O3 (B),
with their slab length distribution (C) and stacking number distribution (D).
But, the Figure 8C graph also shows that the addition of CA significantly increases the number of very small slabs of about 1 nm. Similarly, the average stacking degree (Figure
8D) is not significantly different between the samples (from 2.0±0.1 to 2.3±0.2 when citric
acid is added). 0 5 10 15 20 25 30 35 40 45 0 1 2 3 4 5 6 7 Stacking Frequenc y (%) NiW(CA/M=2)/Al2O3 NiW(CA/M=0)/Al2O3 5 nm 2 0 n m 5 nm
A)
B)
NiW(CA/M=2)/Al2O3 NiW(CA/M=0)/Al2O3 0 5 10 15 20 25 30 35 40 0 1 2 3 4 5 6 7 8 9 10 Slab length (nm) Frequ en cy (%)C)
D)
27 Figure 9. HR STEM-HAADF micrographs of NiWS particles of NiW(CA/M=0)/Al2O3 (A and B)
and NiW(CA/M=2)/Al2O3 (C and D).
To get information about the shape of the sulfided particles and their local composition, STEM-HAADF analysis was performed on NiW catalysts prepared without or with CA (Figure 9). It has to be mentioned that, compared to HRTEM, only a limited number of zones of the image are exploitable by STEM-HAADF. Indeed, due to the high metal loading, it is difficult to get the isolated sulfided slabs that are required for obtaining atomic scale observations. Nevertheless, some differences appear between the catalysts prepared without (Figure 9A and B) and with CA (Figure 9C and D). First, regarding the particles greater than 1 nm, no clear difference in their morphology could be evidenced, they all appear as hexagonal shaped more or less rounded. However, the most remarkable features is the detection of tiny particles of less than one nanometer as well as agglomerates of few atoms on NiW(CA/M = 2)/Al2O3 sample (Figure 9C and D). Such small particles
5 n m 5 nm 5 nm 5 nm 5 nm A) B) C) D)
28
could not be observed on catalyst prepared without CA (Figure 9A and B). This is in accordance with the previous results obtained by HRTEM.
The next question was how to get the nature of the atoms observed on the HR-STEM HAADF images, and particularly the nature of the edge atoms. EELS or EDX analyses were carried out but due to the very low signal (CPS), the results were not conclusive regarding the promoter localization. Among the difficulties, one has to quote the very limited amount of matter under the beam for each analyzed spot during the scanning process. The high insulating properties of the support is also a disadvantage for TEM observation. Nevertheless, thanks to the contrast sensitivity of the HAADF technique, it is possible to quantify the variations in contrast between Ni and W atoms. Indeed, they present strong differences in their Z number, contrast in HAADF mode being sensitive to the Z1.7, a good contrast between these two atoms is expected (Z1.7(W) / Z1.7(N) = 5.22). This technique can thus be used to study metal atom distribution within monolayer catalysts.40,41 By this way, it should be possible to obtain intensity profiles from lines of atoms located in different regions of the projected slab.
To perform such analysis, a special attention was taken to analyze non-overlapping particles with monolayer stacking. In addition, images of these isolated slabs present an excellent resolution and show nicely the atomic arrangement in the slab plane. As a matter of fact, the images of the particles answering to these criteria are scarce. A detailed inspection of the particle presented in Figure 10 reveals variations in the contrast of the atoms located at the edges and in the bulk.
29 Figure 10. Variations of contrast and interatomic distances at different zones of asulfided
slab of NiW (CA/Mo=2)/Al2O3.
It was assumed that due to the visible atomic arrangement shown by the particle in
Figure 10, a single slab was being observed. Stacking of slabs would lead to a more
complex pattern due to the expected shift of the interposed slabs. Therefore, the variations in the contrast of the STEM HAADF images cannot be explained as a function of thickness changes since no overlapping planes are detected in the slab.
Thus, these variations in contrast can be attributed to variations in location of W and Ni atoms. As shown in Figure 10, the atoms located in the bulk (region B), present a homogeneous brightness while the atoms at the edges present in general a less intense contrast (regions A and C). The measurement of the interatomic distances in the region B
80 90 100 110 0 0.5 1.0 1.5 2.0 2.5 3.0 80 90 100 110 0 0.5 1.0 1.5 2.0 2.5 3.0 A) B) Int ensi ty (a. u.) 0.31 0.01 nm W-W 0.31 0.01 nmNi-Ni 80 90 100 110 0 0.5 1.0 1.5 2.0 2.5 probe position (nm) 0.28 0.01 nm W-Ni 1 nm C)
30
shows distances between the atoms of 0.311±0.010 nm. This is in good agreement with the distances obtained by EXAFS for W-W atoms (0.316 nm) in WS2/Al2O3.42
In the region (A), majority of the atoms of the edges are less bright compared to the bulk (W) atoms of the region B. This suggests the presence of Ni atoms at this sulfided edge. Interactomic distances measured at this edge reach 0.317±0.010 nm. From the atomic model reported by Girleanu et al.,43 the Ni-Ni distances were found to have a value of 0.32 nm, i.e., slightly greater than the one measured in the core of the particle. This is in agreement with the experimental value measured between the atoms of the region A. Thus, the interatomic distance as well as the low contrast of the atoms located at region A, allow to assert the presence of only Ni atoms at this edge.
In the region C (Figure 10-C), atoms present different contrasts one from each other, this feature suggests different natures of the atoms at this edge. Interactomic distances measured at this edge reach a lower value than that measured in the core of the particles and on edge A. The DFT calculations of Girleanu et al. determined Ni-W distances in the range 0.274–0.285 nm.43 Thus, the accordance of measured distances in region C as well as the change of contrasts of the atoms located allow to conclude to the presence of both Ni and W atoms at the edge C.
31 Figure 11. HR HAADF-STEM image of sulfided NiW(CA/M=2)/Al2O3 catalyst. Inset of the figure
shows the contrast variations and characteristic distances observed in the atoms located in the periphery and in the bulk of the slab.
Analysis of contrast and distance at core and edge of a sulfide particle in another zone was also performed (Figure 11). As for the atoms located in the core of the particle, their contrast stays constant and the interatomic distances oscillate around 0.311 nm. At the periphery of this particle, one can see one atom next to brighter one whose interatomic distance is 0.281 nm. By their side, there are three less bright atoms (with the lowest contrast at the edge), that exhibit an interatomic distance of around 0.317 nm. This indicates the coexistence of Ni and W atoms at the sulfide slab edge. Similar analysis of the several sulfide particles by STEM-HAADF shows that, as expected, only W atoms are present in the core of the particles whereas the edges can expose either exclusively Ni atoms or Ni and W atoms with various configurations. Presence of totally promoted edges and partially promoted edges are highlighted by STEM-HAADF in accordance with IR assignments.
W W
W Ni
32
4. CONCLUSIONS
The aim of this study was to obtain an atomic level analysis of the structure of the active sites of Ni promoted WS2 particles supported on γ-Al2O3 prepared with and without citric
acid.
Thiophene hydrodesulfurization test shows that citric acid addition during the preparation stage markedly increases the catalytic activity. Parallel with IR/CO indicates that this is a consequence of the increased formation of NiWS sites in presence of citric acid. A careful analysis of the IR/CO spectra at various CO coverages was performed. First, it shows that unpromoted sites characterized by bands at 2121 cm-1 (W on M-edge) and 2066 cm-1 (W on S-edge) are still detected whatever the amount of citric acid. Second, it points out that the NiWS sites give rise to three bands. Parallel with previous works allowed to assign the 2094 and 2077 cm-1 bands to partially promoted sites and the band at 2131 cm-1 to totally promoted sites.
HRTEM shows that citric acid addition favors the formation of very small particles of about 1 nm. HR STEM HAADF images confirm this and, even provides evidence for the formation of clusters of few atoms. Moreover, by analyzing contrast and interatomic distances on atomic scale images of sulfide particles obtained by HR STEM HAADF, it was possible to identify the nature of the core and edge atoms of the particles. The metal atoms of particle core are only W ones whereas the edges of the particles could be either fully promoted with detection of only Ni atoms, or partially promoted with detection of both Ni and W atoms. Hence, local and global analysis of NiW slabs are in good agreement to account for more fully promoted and partially promoted NiW sites by CA addition
33
Author information:
Corresponding author: laetitia.oliviero@ensicaen.fr
ORCID
Laetitia Oliviero: https://orcid.org/0000-0002-7931-439X
Luz Zavala-Sanchez: https://orcid.org/0000-0002-9643-3825
Notes:
The authors declare no competing financial interest.
Acknowledgements
L. Zavala-Sanchez acknowledges the Mexican National Council for Science and Technology (CONACYT) for the Ph.D. grant. The authors acknowledge LABEX EMC3 for the financial support to MIMOSA project. X. Portier from CIMAP laboratory would like to thank the ANR (Agence Nationale pour la Recherche) for its funding through an EQUIPEX project (grant # AWR-11-EQPX-0020) and also the Normandie Region for its financial support that allowed the use of the JEOL ARM 200F microscope.
5. REFERENCES
(1) Topsøe, H., Clausen, B. S., Candia, R., Wivel, C., & Mørup, S. In Situ Mössbauer Emission Spectroscopy Studies of Unsupported and Supported Sulfided Co-Mo Hydrodesulfurization
34 Catalysts: Evidence for and Nature of a Co-Mo-S Phase. J. Catal. 1981, 68 (2), 433–452. https://doi.org/10.1016/0021-9517(81)90114-7.
(2) Minaev, P. P.; Nikulshin, P. A.; Kulikova, M. S.; Pimerzin, A. A.; Kogan, V. M. NiWS/Al2O3 Hydrotreating Catalysts Prepared with 12-Tungstophosphoric Heteropolyacid and Nickel Citrate: Effect of Ni/W Ratio. "Applied Catal. A, Gen. 2015, 505, 456–466. https://doi.org/10.1016/j.apcata.2015.05.012.
(3) Stanislaus, A.; Marafi, A.; Rana, M. S. Recent Advances in the Science and Technology of Ultra Low Sulfur Diesel (ULSD) Production. Catal. Today 2010, 153, 1–68. https://doi.org/10.1016/j.cattod.2010.05.011.
(4) Füchtbauer, H. G.; Tuxen, A. K.; Moses, P. G.; Topsøe, H.; Besenbacher, F.; Lauritsen, J. V. Morphology and Atomic-Scale Structure of Single-Layer WS2 Nanoclusters. Phys. Chem.
Chem. Phys 2013, 15, 15971. https://doi.org/10.1039/c3cp51758f.
(5) Cooper, B. H.; Donnis, B. B. L. Aromatic Saturation of Distillates: An Overview. Appl.
Catal. A Gen. 1996, 137, 203–223.
(6) Carlsson, A.; Brorson, M.; Topsøe, H. Morphology of WS2 Nanoclusters in WS2/C Hydrodesulfurization Catalysts Revealed by High-Angle Annular Dark-Field Scanning Transmission Electron Microscopy (HAADF-STEM) Imaging. J. Catal. 2004, 227, 530– 536. https://doi.org/10.1016/j.jcat.2004.08.031.
(7) Suárez-Toriello, V. A.; Santolalla-Vargas, C. E.; De Los Reyes, J. A.; Vázquez-Zavala, A.; Vrinat, M.; Geantet, C. Influence of the Solution PH in Impregnation with Citric Acid and Activity of Ni/W/Al2O3 Catalysts. "Journal Mol. Catal. A, Chem. 2015, 404–405, 36–46. https://doi.org/10.1016/j.molcata.2015.04.005.
(8) Breysse, M.; Cattenoti, M.; Decamp, T.; Fretyl, R.; Gachet, C.; Lacroix, M.; Leclercq, C.; de Mourgues, L.; Portefaix, J. L.; Vrinat, M.; et al. Influence of Sulfidation Conditions on the Properties of NiW/Al2O3 Hydrotreating Catalysts. Catal. Today 1988, 4, 39–55.
(9) Li, H.; Li, M.; Chu, Y.; Liu, F.; Nie, H. Essential Role of Citric Acid in Preparation of Efficient NiW/Al2O3 HDS Catalysts. Appl. Catal. A Gen. 2011, 403, 75–82. https://doi.org/10.1016/j.apcata.2011.06.015.
(10) Yoshimura, Y.; Sato, T.; Shimada, H.; Matsubayashi, N.; Imamura, M.; Nishijima, A.; Higo, M.; Yoshitomi, S. Preparation of Nickel-Tungstate Catalysts by a Novel Impregnation Method. Catal. Today 1996, 29, 221–228.
(11) Lélias, M. A.; Le Guludec, E.; Mariey, L.; van Gestel, J.; Travert, A.; Oliviero, L.; Maugé, F. Effect of EDTA Addition on the Structure and Activity of the Active Phase of Cobalt–
35 molybdenum Sulfide Hydrotreatment Catalysts. Catal. Today 2010, 150 (3–4), 179–185. https://doi.org/10.1016/J.CATTOD.2009.07.107.
(12) Lélias, M. A.; van Gestel, J.; Maugé, F.; van Veen, J. A. R. Effect of NTA Addition on the Formation, Structure and Activity of the Active Phase of Cobalt–molybdenum Sulfide Hydrotreating Catalysts. Catal. Today 2008, 130 (1), 109–116. https://doi.org/10.1016/J.CATTOD.2007.07.018.
(13) Valencia, D.; Klimova, T. Kinetic Study of NiMo/SBA-15 Catalysts Prepared with Citric Acid in Hydrodesulfurization of Dibenzothiophene. CATCOM 2012, 21, 77–81. https://doi.org/10.1016/j.catcom.2012.02.003.
(14) Fujikawa, T. Highly Active HDS Catalyst for Producing Ultra-Low Sulfur Diesel Fuels.
Top. Catal. 2009, 52, 872–879. https://doi.org/10.1007/s11244-009-9228-y.
(15) Santolalla-Vargas, C. E.; Suarez Toriello, V. A.; De los Reyes, J. A.; Cromwell, D. K.; Pawelec, B.; Fierro, J. L. G. Effects of PH and Chelating Agent on the NiWS Phase Formation in NiW/γ-Al2O3 HDS Catalysts. Mater. Chem. Phys. 2015, 166, 105–115. https://doi.org/10.1016/j.matchemphys.2015.09.033.
(16) Chen, J.; Maugé, F.; Fallah, J. El; Oliviero, L. IR Spectroscopy Evidence of MoS2 Morphology Change by Citric Acid Addition on MoS2/Al2O3 Catalysts – A Step Forward to Differentiate the Reactivity of M-Edge and S-Edge. J. Catal. 2014, 320 (320), 170–179. https://doi.org/10.1016/j.jcat.2014.10.005.
(17) Chen, J.; Mi, J.; Li, K.; Wang, X.; Dominguez Garcia, E.; Cao, Y.; Jiang, L.; Oliviero, L.; Oise, F. Role of Citric Acid in Preparing Highly Active CoMo/Al2O3 Catalyst: From Aqueous Impregnation Solution to Active Site Formation. Ind. Eng. Chem. Res. 2017, 56, 14172–14181. https://doi.org/10.1021/acs.iecr.7b02877.
(18) Chen, J.; Dominguez Garcia, E.; Oliviero, L.; Maugé, F. How the CO Molar Extinction Coefficient Influences the Quantification of Active Sites from CO Adsorption Followed by IR Spectroscopy? A Case Study on MoS2/Al2O3 Catalysts Prepared with Citric Acid. J.
Catal. 2015, 332, 77–82. https://doi.org/10.1016/j.jcat.2015.09.005.
(19) Garcia, E. D. Effet Du Support Sur La Morphologie et l’activité Des Catalyseurs d’hydrodésulfuration, Université de Caen, 2017.
(20) Zavala-sanchez, L.; Portier, X.; Maugé, F.; Oliviero, L. High Resolution STEM-HAADF Microscopy on γ - Al2O3 Supported MoS2 Catalyst – Proof by Image of the Changes in Dispersion and Morphology of the Slabs with Addition of Citric Acid. Nanotechnology 2019, No. Xxxx, 1–10.
36 (21) Chen, J.; Dominguez Garcia, E.; Oliviero, E.; Oliviero, L.; Maugé, F. Effect of High Pressure Sulfidation on the Morphology and Reactivity of MoS2 Slabs on MoS2/Al2O3 Catalyst Prepared with Citric Acid. J. Catal. 2016, 339, 153–162. https://doi.org/10.1016/j.jcat.2016.04.010.
(22) Van Haandel, L.; Bremmer, G. M.; Hensen, E. J. M.; Weber, T. Influence of Sulfiding Agent and Pressure on Structure and Performance of CoMo/Al2O3 Hydrodesulfurization Catalysts. 2016. https://doi.org/10.1016/j.jcat.2016.07.009.
(23) Bachelier, J., Tilliette, N. J., Cornac, M., Duchet, J. C., Lavalley, J. C., & Cornet, D. SULFIDED CoMo/Al2O3 CATALYSTS : CARBON MONOXIDE CHEMISORPTION AND SURFACE STRUCTURES. Bull. des Sociétés Chim. Belges 1984, 93 (8), 743–750. (24) Zavala-Sanchez, L.; Portier, X.; Maugé, F.; Oliviero, L. High-Resolution STEM-HAADF
Microscopy on a γ-Al2O3 Supported MoS2 Catalyst-Proof of the Changes in Dispersion and Morphology of the Slabs with the Addition of Citric Acid. Nanotechnology 2019, 31 (3), 035706. https://doi.org/10.1088/1361-6528/ab483c.
(25) Zavala-sanchez, L.; Khalil, I.; Oliviero, L.; Paul, J. Structural Sites Investigation and Quantification of WS2/Al2O3 Catalysts : Coupling between IR/CO and DFT Calculations for a Deep Insight into Edge Sites. Chem Cat Chem 2019, No. 0, 1–36.
(26) Hadjiivanov, K. I.; Vayssilov, G. N. Characterization of Oxide Surfaces and Zeolites by Carbon Monoxide as an IR Probe Molecule. Adv. Catal. 2002, 47, 307–511. https://doi.org/10.1016/S0360-0564(02)47008-3.
(27) Vradman, L.; Landau, M. V; Herskowitz, M.; Ezersky, V.; Talianker, M.; Nikitenko, S.; Koltypin, Y.; Gedanken, A. High Loading of Short WS2 Slabs inside SBA-15: Promotion with Nickel and Performance in Hydrodesulfurization and Hydrogenation. J. Catal. 2003,
213, 163–175. https://doi.org/S0021-9517(02)00012 -X.
(28) Huang, Z. D.; Bensch, W.; Kienle, L.; Fuentes, S.; Alonso, G.; Ornelas, C. SBA-15 as Support for Ni-MoS2HDS Catalysts Derived from Sulfur-Containing Molybdenum and Nickel Complexes in the Reaction of HDS of DBT: An All Sulfide Route. Catal. Letters 2009, 127 (1–2), 132–142. https://doi.org/10.1007/s10562-008-9656-5.
(29) Nava, R.; Ortega, R. A.; Alonso, G.; Ornelas, C.; Pawelec, B.; Fierro, J. L. G. CoMo/Ti-SBA-15 Catalysts for Dibenzothiophene Desulfurization. Catal. Today 2007, 127 (1–4), 70– 84. https://doi.org/10.1016/J.CATTOD.2007.02.034.
(30) Dimitrov, L.; Palcheva, R.; Spojakina, A.; Jiratova, K. Synthesis and Characterization of W-SBA-15 and W-HMS as Supports for HDS. J. porous Mater. 2011, 18, 425–434.
37 https://doi.org/10.1007/s10934-010-9394-0.
(31) Nellist, P. D., & Pennycook, S. J. Direct Imaging of the Atomic Configuration of Ultradispersed Catalysts. Science (80-. ). 1996, 274 (5286), 413–415.
(32) Alphazan, T.; Bonduelle-Skrzypczak, A.; Legens, L.; Gay, A.-S.; Boudene, Z.; Girleanu, M.; Ersen, O.; Cope, C.; Raybaud, P. Highly Active Nonpromoted Hydrotreating Catalysts through the Controlled Growth of a Supported Hexagonal WS2 Phase. ACS Catal 2014, 4, 42. https://doi.org/10.1021/cs501311m.
(33) Alphazan, T.; Bonduelle-Skrzypczak, A.; Legens, C.; Boudene, Z.; Taleb, A.-L.; Gay, A.-S.; Ersen, O.; Copéret, C.; Raybaud, P. Improved Promoter Effect in NiWS Catalysts through a Molecular Approach and an Optimized Ni Edge Decoration. J. Catal. 2016, 340, 60–65. https://doi.org/10.1016/j.jcat.2016.05.004.
(34) Sing, K.; Everett, D.; Haul, R.; Moscou, L.; Pierotti, R.; Rouquerol, J.; Siemieniewska, T. Reporting Physisorption Data for Gas/Solid Systems with Special Reference to the Determination of Surface Area and Porosity. Pure Appl. Chem. 1985, 57 (4), 603–619. (35) Zuo, D.; Vrinat, M.; Nie, H.; Maugé, F.; Shi, Y.; Lacroix, M.; Li, D. The Formation of the
Active Phases in Sulfided NiW/Al2O3catalysts and Their Evolution during Post-Reduction
Treatment. Catal. Today 2004, 93–95, 751–760.
https://doi.org/10.1016/j.cattod.2004.06.078.
(36) Duchet, J. C., Lavalley, J. C., Housni, S., Ouafi, D., Bachelier, J., Lakhdar, M., ... & Cornet, D. Carbon Monoxide and Oxygen Chemisorption and Functionalities of Sulphided Ni-W/Al2O3 Hydrotreating Catalysts. Catal. Today 1988, 4 (1), 71–96. https://doi.org/10.1016/0920-5861(88)87047-0.
(37) Travert, A.; Dujardin, C.; Maugé, F.; Veilly, E.; Cristol, S.; Paul, J.-F.; Payen, E. CO Adsorption on CoMo and NiMo Sulfide Catalysts: A Combined IR and DFT Study. Phys.
Chem. B 2006, 110, 1261–1270. https://doi.org/10.1021/jp0536549.
(38) Mauge, F.; Duchet, J. C.; Lavalley, J. C.; Houssenbay, S.; Payen, E.; Grimblot, J.; Kasxtelan, S. The Sulphided State of Nickel Molybdenum Catalysts Supported on Zircouia and Aluminates. Catal. Today 1991, No. 10, 561–577. https://doi.org/10.1016/0920-5861(91)80039-C.
(39) Dominguez Garcia, E.; Chen, J.; Oliviero, E.; Oliviero, L.; Maugé, F. New Insight into the Support Effect on HDS Catalysts: Evidence for the Role of Mo-Support Interaction on the MoS 2 Slab Morphology. Appl. Catal. B Environ. 2020, 260, 117975. https://doi.org/10.1016/j.apcatb.2019.117975.
38 (40) Nikulshina, M.; Mozhaev, A.; Lancelot, C.; Marinova, M.; Blanchard, P.; Payen, E.; Lamonier, C.; Nikulshin, P. MoW Synergetic Effect Supported by HAADF for Alumina Based Catalysts Prepared from Mixed SiMo n W 12-n Heteropolyacids. 2017. https://doi.org/10.1016/j.apcatb.2017.11.049.
(41) Nikulshina, M.; Mozhaev, A.; Lancelot, C.; Blanchard, P.; Marinova, M.; Lamonier, C.; Nikulshin, P. Enhancing the Hydrodesulfurization of 4,6-Dimethyldibenzothiophene through the Use of Mixed MoWS2 Phase Evidenced by HAADF. Catal. Today 2019, 329 (November 2018), 24–34. https://doi.org/10.1016/j.cattod.2018.11.051.
(42) Thomazeau, C.; Geantet, C.; Lacroix, M.; Danot, M.; Harle, V. EXAFS Characterization of New Active Phases for Catalytic Hydrotreatment: Two Cations Disulfide Layers in the MoxW(1-x)S2 Lamellar Solid Solution. Oil Gas Sci. Technol. IFP 2005, 60 (5), 781–790. (43) Girleanu, M.; Alphazan, T.; Boudene, Z.; Bonduelle-Skrzypczak, A.; Legens, C.; Gay, A. S.;
Copéret, C.; Ersen, O.; Raybaud, P. Magnifying the Morphology Change Induced by a Nickel Promoter in Tungsten(IV) Sulfide Industrial Hydrocracking Catalyst: A HAADF-STEM and DFT Study. ChemCatChem 2014, 6 (6), 1594–1598. https://doi.org/10.1002/cctc.201402115.