Groundwater recharge dynamics by
snowmelt
Thèse présentée à la Faculté Science Centre d’hydrogéologie et géothermie (CHYN)
Université de Neuchâtel
Pour l’obtention du grade de docteur ès Science
Par
Jessica Meeks
Jury :
Prof. Daniel Hunkeler University of Neuchâtel, Switzerland
Directeur de these Prof. Philip Brunner University of Neuchâtel, Switzerland
Rapporteur interne Prof. Bjorn Klove University of Oulu, Finland
Rapporteur externe Prof. Nico Goldscheider
Karlsruhe Institute of Technology, Germany Rapporteur externe
Défense privée : Avril 28, 2017 Défense publique : Décembre 19, 2017
Faculté des Sciences Secrétariat-décanat de Faculté Rue Emile-Argand 11 2000 Neuchâtel – Suisse Tél : + 41 (0)32 718 21 00 E-mail : [email protected]
IMPRIMATUR POUR THESE DE DOCTORAT
La Faculté des sciences de l'Université de Neuchâtel autorise l'impression de la présente thèse soutenue par
Madame Jessica MEEKS
Titre:
“Groundwater recharge dynamics
by snowmelt”
sur le rapport des membres du jury composé comme suit:
• Prof. Daniel Hunkeler, directeur de thèse, Université de Neuchâtel, Suisse • Prof. Philip Brunner, Université de Neuchâtel, Suisse
• Prof. Nico Goldscheider, Karlsruhe Institute of Technology, Allemagne • Prof. Björn Klove, University of Oulu, Finlande
Mots clés en français : Recharge des eaux souterraines, karst, changement climatique, zone vadose, hydrologie de la neige, incertitude du modèle, fonte des neiges
Mots clés en anglais : Groundwater recharge, karst, climate change, vadose zone, snow
Abstract
Understanding the recharge mechanisms for karst aquifers is of great importance because these aquifers are relied upon by a quarter of Earth’s population, and because their recharge and discharge dynamics are often strongly coupled. Given this coupling, karst groundwater resources are inherently susceptible to surface processes such as climate, where the timing and volume of water infiltration is a direct consequence of precipitation and temperature. Climate change is anticipated to shift the ratio of snow to liquid precipitation, particularly in regions that currently receive a substantial portion of precipitation as snow.
Thus, we have dedicated this body of research to better understand 1. the mechanisms controlling karst aquifer recharge from snowmelt; 2. how well snow process models actually predict infiltration of snowmelt and what are the predictive uncertainties surrounding these models; and 3. how karst aquifer recharge patterns will shift in a warming climate. We collected three years of data from a unique field site where recharge rates can be tracked in a shallow cave, and which can be considered as an oversized, real-world lysimeter. The collected data embodied spatially integrated behaviors across the lysimeter’s catchment area, and allowed us a rare opportunity to depart from system study using point-data.
Through these studies we found that a substantial amount of infiltrating water was stored in the vadose zone (predominantly in soils versus the epikarst), which led to temporal redistribution of water from melt events to cold periods lacking snowmelt infiltration. Vadose zone storage and flow have a strong control on aquifer discharge at the scale of weeks, while phreatic storage becomes dominant during prolonged periods without input. Further, we observed that snow process model predictive uncertainty is reduced with increased parameterization of melt processes. Rigorous snow process model calibration, which allows for model optimization, should become standard practice for water resource managers in cold regions. Lastly, we found that increased air temperature reduces both a snowpack’s snow water equivalent at a given time and also its duration of emplacement and that recharge distribution throughout the winter can have significant impacts on
groundwater availability, rendering karst aquifers particularly susceptible to climate change.
Résumé
Comprendre les mécanismes de recharge des aquifères karstiques revêt une grande importance car ces aquifères sont utilisés par un quart de la population mondiale et que leurs dynamiques de recharge et de décharge sont souvent fortement couplées. Compte tenu de ce couplage, les ressources en eaux souterraines karstiques sont intrinsèquement sensibles aux processus de surface tels que le climat, où le moment et le volume de l'infiltration d'eau sont une conséquence directe des précipitations et de la température. Les changements climatiques devraient modifier le ratio précipitations de neige / liquide, en particulier dans les régions qui reçoivent actuellement une part importante des précipitations sous forme de neige.
Ainsi, nous avons consacré ce corpus de recherches à mieux comprendre 1. les mécanismes contrôlant la recharge des aquifères karstiques à partir de la fonte des neiges; 2. dans quelle mesure les modèles de traitement de la neige prédisent réellement l'infiltration de la fonte des neiges et quelles sont les incertitudes prévisionnelles entourant ces modèles; et 3. comment les schémas de recharge de l'aquifère karstique vont changer dans un climat qui se réchauffe. Nous avons collecté trois années de données sur un site unique où les taux de recharge peuvent être suivis dans une grotte peu profonde et qui peuvent être considérés comme un lysimètre surdimensionné et réel. Les données collectées reflétaient des comportements intégrés spatialement dans la zone de captage du lysimètre et nous donnaient une rare occasion de nous écarter de l’étude du système en utilisant des données ponctuelles.
À travers ces études, nous avons constaté qu’une quantité substantielle d’eau infiltrante était stockée dans la zone vadose (principalement dans les sols par rapport à l’epikarst), ce qui a conduit à une redistribution temporelle de l’eau des temps de fonte aux périodes froides sans infiltration de la fonte des neiges. Le stockage et le débit de la zone vadose exercent un contrôle puissant sur le débit de l'aquifère à l'échelle de la semaine, tandis que le stockage de la nappe phréatique devient dominant pendant des périodes prolongées sans apport. De plus, nous avons observé que l’incertitude prédictive du modèle de processus de neige est réduite avec une paramétrisation accrue des processus de fonte. Un calibrage rigoureux des modèles de processus sur neige, permettant l'optimisation du
modèle, devrait devenir une pratique courante pour les gestionnaires de ressources en eau dans les régions froides. Enfin, nous avons constaté que l’augmentation de la température de l’air réduisait l’équivalent en eau de la neige d’un manteau neigeux à un moment donné, ainsi que sa durée de mise en place et que la répartition de la recharge tout au long de l’hiver pouvait avoir des effets importants sur la disponibilité des eaux souterraines, rendant les aquifères karstiques particulièrement vulnérables au changement climatique.
Acknowledgments
I would like to thank Daniel Hunkeler, Philip Brunner and Michelle Pronk, who collectively supervised this thesis, for their support, mentorship and openness to discussion. Thank you for prompting new lines of thought and for supporting the extenuating circumstances of me finishing the dissertation remotely. Thank you to Prof. Bjorn Klove and Prof. Nico Goldscheider who have accepted to join the jury of this thesis and for taking the time to read this research. A special thanks to Christian Moeck for his guidance, comradery and patience throughout our collaborations. His time and insights were instrumental in the advancement of my research. The enormous amount of fieldwork completed would not have been possible without Roberto Costa. Thank you for solving innumerable technical problems and for helping to design and install the VCB field station. I want to thank Guillaume Bertrand and Alice Badin, with whom I shared an office. The hours discussing life inside and out of the science world were laughter filled and I count myself incredibly lucky to have been paired with the two of you. I would like to thank my colleagues at the CHYN for a good balance between work and extracuriculars, and for making my PhD years pleasurable ones.
Thank you to the GENESIS project on groundwater systems 513 (financed by the European Commission) 7FP large-scale project contract 514226536, who financially supported my research. The GENESIS colleagues were instrumental in broadening my understanding of hydrogeology and of what it means to be a part of the global scientific community.
I am beyond grateful to my husband Tim for his love and support and for his innumerable hours spent snowshoeing out to the VCB in a meter of fresh snow while carrying 15kilos of equipment. Finally, I would like to thank the rest of my family, especially my mother Lynne and mother-in-law Tina, for their support while I worked to finish writing this document.
Table of Contents
Abstract ... 1 Acknowledgments ... 5 Chapter 1 - Introduction ... 9 Thesis objectives ... 9Assessment of recharge to karst aquifers: methods and challenges ... 9
Mechanisms controlling recharge ... 14
Modeling recharge from snowmelt in a karstic setting ... 14
Predictive uncertainty surrounding snowmelt models ... 15
Effect of climate change in a karst setting ... 16
Thesis outline ... 17
Chapter 2 - Snowmelt infiltration and storage within a karstic environment, Vers Chez le Brandt, Switzerland ... 19
Introduction ... 20
Site Description ... 23
Methods ... 27
Results ... 28
Temporal evolution of meteorological and hydrological parameters ... 28
Dynamics of water content in soil and epikarst ... 32
Relationship between cave and spring discharge ... 35
Discussion ... 36
Summary and Conclusion ... 40
Acknowledgements ... 41
Chapter 3 - Infiltration under snow cover: Modeling approaches and predictive uncertainty ... 43 Introduction ... 44 Study Area ... 48 Data ... 50 Modeling ... 51 Lumprem ... 51
Degree-Day Snowmelt Model ... 53
Modified Degree-Day Snowmelt Model ... 54
Energy Balance Snowmelt Model ... 55
Calibration ... 56 Lumprem ... 56 Snowmelt Models ... 57 Results ... 57 Discussion ... 62 Conclusions ... 66 Acknowledgements ... 67
Chapter 4 - Conclusions and Implications ... 68
Findings ... 68
References ... 75 Appendix A - Determination of spatiotemporal variability of tree water uptake using stable isotopes (δ18O, δ2H) in an alluvial system supplied by a high-altitude watershed, Pfyn forest, Switzerland ... 85 Appendix B - Towards Operational Methods for the Assessment of Intrinsic
Chapter 1 - Introduction
Thesis objectives
Groundwater resources and climate are inextricably linked, as the timing and volume of water infiltrating into the ground is a direct consequence of factors such as precipitation and temperature. Significant impacts on the hydrologic cycle, including global alterations to groundwater recharge patterns (Barker T. et al., 2007), are anticipated to accompany a warming climate. In karst environments, aquifer recharge and discharge are often strongly coupled. Thus, it is particularly important to understand how recharge might change in these geologic settings. While karstic aquifers are relied upon directly or indirectly by approximately a quarter of Earth’s population (Ford and Williams, 2007b; Hartmann et al., 2014), scant scientific attention has been given to understanding the potential impacts of climate change on karst systems’ recharge patterns, particularly in cold-climate regions, compared to other aquifer types. Therefore, in this body of research we address the following questions: (i) what are the mechanisms controlling winter-season groundwater renewal in a karst setting; (ii) how do these mechanisms impact karst aquifer storage and discharge; (iii) how well do snowmelt models actually simulate winter season infiltration; (iv) what is the predictive uncertainty surrounding those models; and lastly, (v) how might karstic groundwater recharge change with a warming climate.
Assessment of recharge to karst aquifers: methods and challenges
Karst aquifers are typified by dissolution cavities, such as caves and conduits (Figure 1), which may allow for rapid transmission of water through their vadose and phreatic zones (Ford and Williams, 2007a). Karstic features such as sinkholes and dolines can allow surface water, and any entrained nutrients and contaminants, to quickly enter the subsurface.
Figure 1: Depiction of the hydrogeologic functioning of a karst aquifer. Source: (Goldscheider and Drew, 2007)
Direct connection to the aquifer renders subsurface water resources particularly susceptible to surficial conditions such as climate. Furthermore, karst features are heterogeneous across a watershed, which can lead to spatially varying recharge. The spatially inconsistent, yet potentially rapid recharge in a karst watershed results in the heightened need to understand infiltration processes. One way to establish the connection
between an aquifer’s infiltration and discharge is by employing tracer technologies.
Tracer tests are often used to estimate the travel time distribution within an aquifer all the way to its spring, thereby providing information about a site’s recharge. Traditionally, tracers such as stable isotopes (Allison et al., 1985; Aquilina et al., 2005; Kohfahl et al., 2008; Lee and Krothe, 2001), radioactive isotope (Savoy et al., 2011), chloride (Allison et al., 1985), ionic and chemical composition (Katz et al., 1997; Lee and Krothe, 2001), fluorometric dies (Flury and Wai, 2003; Göppert and Goldscheider, 2008; Mull, 2001;
Smart and Smith, 1976), temperature and chlorofluorocarbons (Long et al., 2008; Long
and Putnam, 2006; Ozyurt and Bayari, 2005) have been used to assess recharge to karst
aquifers. A comprehensive review of tracers in karst hydrology was presented by
Goldscheider et al. (2008). Tracer tests may commence with the introduction a known volume of water (i.e. potential recharge or infiltration) and mass of associated tracer to a groundwater body, either naturally or through injection. The tracer is then monitored for
and quantified somewhere hydraulically down gradient in the aquifer. Alternately, one can monitor the physical and chemical properties of a karst spring over time to evaluate infiltration and transmission times of recharge waters. For example, a pulse of infiltrating precipitation may present itself as a breakthrough curve of decreased temperature in a spring’s hydrograph (Figure 2).
Figure 2: Idealized hydrograph depicting a pulse of rainfall followed by an increase in discharge followed by a decrease in discharge. The lag time between the peak rainfall and peak discharge speaks to the hydrogeologic properties of the geologic media, such a porosity and hydraulic conductivity.
Source: http://vudeevudeewiki.blogspot.com/2012/01/hydrographs-and-river-discharge.html
In locations without snow, a karst system’s precipitation input (including the time, volume and chemical makeup) can be directly monitored. However, when a snowpack is emplaced, the volume and signature of liquid precipitation is moderated by the surficial storage of that water in the snowpack, prior to entering the subsurface. Monitoring water volume and signature draining from the base of a snowpack, prior to entering the subsurface, is inherently difficult due to lack of access to the base of a snowpack, without disruption of the snowpack itself. Despite its difficulty, researchers have made efforts to better constrain winter season recharge within karstic settings, typically through analysis of karst aquifer discharge data. While indirect, Geyer et al. (2008) identified daily pulses of recharge from snowmelt based on diurnal fluxes in conduit air temperature, pulses
which were not easily identified via spring hydrograph analysis. Reisch and Toran (2014)
monitored electrical conductivity, water levels, air temperature, and depth of snowpack at a karst spring to differentiate internal runoff along preferential flow paths from diffuse infiltration. In this study, road-salt served as a tracer to track infiltrating meltwater. These researchers observed patterns indicating that internal runoff, i.e. vadose zone drainage, dominated during frozen periods. Diffuse infiltration became predominate during warmer
periods because subsurface thawing allowed the snowmelt to penetrate the epikarst, the
layer of enhanced fracturing and solutional voids in the upper part of a karstified bedrock body (Figure 3).
Figure 3: The epikarst (E) is the upper layer of the bedrock that is heavily fractured and riddled with solutional voids.
Source: https://www.geocaching.com/geocache/GC3GFXD_hubelj?guid=c2a747a7-9f7b-46a7-aa1d-867a8f76e639
Penna et al. (2015) used stable isotopes of water (18O and 2H) and electrical conductivity
to quantify the role of snowmelt in spring water in the lower part of a small Dolomitic catchment. These researchers concluded that: 1. rainfall, snowmelt, shallow riparian groundwater and near-surface soil water were the main contributors to stream runoff; 2. springs and surface runoff in the upper part of the catchment reflected a more direct influence of rainfall and snowmelt than springs and surface runoff in the lower part; and 3. relatively constant isotopic composition and EC in streams and springs in the lower part, and evaporation signal suggest slower subsurface flow and longer residence time. Audra and Nobecourt (2013) assessed discharge and temperature data at the Coulomp Spring in France and derived snowmelt to contribute 30–50% toward discharge with the
remainder attributed to baseflow. Through hydrograph analysis of peak air temperature and peak discharge from snowmelt, these researchers determined the relative contributions of vertical transfer (7hrs) through the vadose zone and horizontal transfer (3hrs) through the karst conduits. Though somewhat tangential, Gremaud and Goldscheider (2010a) and Gremaud (2009) used tracer tests to understand the influences of glacial meltwater on karst aquifer recharge.
Only a few studies have investigated karstic recharge by snowmelt in more detail directly in the recharge zone. Penna et al. (2015) collected samples from a snow lysimeter, piezometers, snow courses, and soil-water suction cups. With snow courses, the snow water equivalent (SWE) is determined repeatedly with a snow sampler along well-defined transects. These water samples however are discrete and only represent the point from which they were sourced. Uncertainty is introduced when extrapolating watershed-scale processes from point data, a consistent difficulty in snow hydrology studies, as is
discussed in depth in the Introduction of Chapter 2. Regardless of the geologic setting the
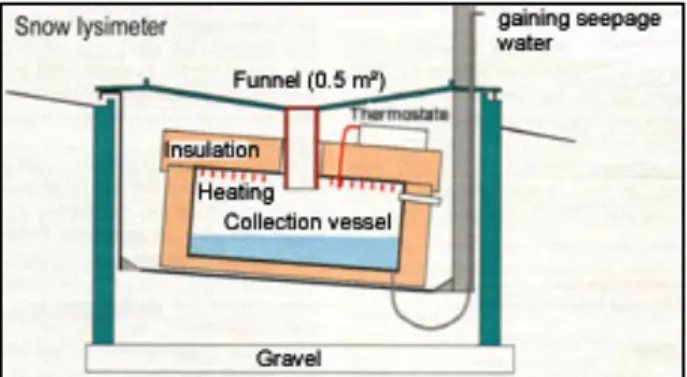
rate of snowmelt water entering the ground is usually monitored using point-data sources such as snow lysimeters (Haupt, 1969; Kattelmann, 2000; Martinec, 1989; Tekeli et al., 2003; Tekeli et al., 2005) and snow pillows (Archer and Stewart, 1995; Butcher and McManamon, 2011; Trujillo and Molotch, 2011). Snow courses, such as those collected by Marks et al. (2001) and Rice and Bales (2010), provide a distributed understanding of changes in snow water equivalent. However, snow courses are typically done at course time resolutions due to the intensive labor involved. As stated by Kattelmann (2000), snowmelt runoff from a larger “natural lysimeter” would provide a conceptually better basis for evaluating winter recharge processes and output from snowmelt models, than the somewhat artificial sampling of snowpack outflow by lysimeters (Figure 4) and snow pillows.
Figure 4: A cross-sectional schematic of a snow lysimeter used in northwest Austria. Source: http://www.lysimeter.at/HP_EuLP/web/austria/at18b.html
Therefore, we used the rather unique karstified geologic configuration of the Vers Chez le Bandt, a natural lysimeter located in northwest Switzerland, to address the above delineated research questions.
Mechanisms controlling recharge
Due to karstified aquifers being highly heterogeneous and tending to maintain individualized, site-specific relationships between soils, epikarst, rock matrix and conduit network, which can vary significantly from other karstic settings, the mechanisms controlling karst aquifer recharge have been debated (Chapter 1, Introduction). Karstic settings tend to systematically present vadose zone drainage even during periods of drought, implicating the presence of perched water stores. That later feature is seen around the world in karstified location and is typically attributed to water storage in the epikarst (Aquilina et al., 2005; Arbel et al., 2010; Bakalowicz, 2004; Clemens et al., 1999; Jacob et al., 2009; Perrin et al., 2003; Trçek, 2002; Williams, 2008). An in-depth discussion of the respective roles of soil and epikarst in surficial water storage, as surmised by various researchers, is presented in the Introduction of Chapter 1, along with our findings regarding how these stratified zones influence infiltration and storage of infiltrating water.
Modeling recharge from snowmelt in a karstic setting
While many efforts to model the volume and temporal distribution of snowmelt rates have been conducted at both the point and distributed scales using a plethora of modeling
algorithms (as detailed on the Snow Modelers Internet Platform and in Chapter 2’s
renewal in karst settings. Rimmer and Hartmann (2010) modeled recharge from snowmelt to karst. These researchers applied a degree-day based snow routine to HYdrological Model for Karst Environment (HYMKE) to estimate the effect of snow accumulation and snowmelt on the timing of stream flow in the Jordan River. They showed that at higher elevations there is a clear difference between the timing of effective precipitation (precipitation plus snowmelt) compared to just precipitation. However, according to their model, these changes had almost no effect on the final results of the daily stream flow, most likely due to snowmelt’s low contribution compared with rain at lower evaluations. This study failed to collect data, such as evolution in SWE, which could have been used to calibrate the degree-day portion of their model.
Predictive uncertainty surrounding snowmelt models
As stated, there have been many efforts to constrain snow processes and associated drainage from snow packs using a spectrum of model complexities which range from the simple temperature index method to the intricate and physically-based energy balance method (as discussed in Chapter 2’s Introduction). With each snowmelt model simulation, regardless of complexity, there results a unique outcome of snowmelt rates. These outcomes are based on the model’s initial conditions, configuration, and used calibration data (Hill and Tiedeman, 2006). To understand how reliable and in turn powerful these model-forecasts may be, a model user must understand the uncertainty surrounding both a model’s input (such as accuracy of air temperature data) and output (estimated snowmelt). Predictive uncertainty of the output may arise from inaccuracies in the model’s structure, i.e. representation of a system’s functioning (Moore and Doherty, 2005). For example, simplified models that lump many processes via one index, may be more prone to produce predictive uncertainty as they are not physically based and do not consider the explicit nuances of a particular system in space and time. However, parameter uncertainty may be small as there are fewer parameters to constrain. Conversely, using a physically based model that considers a highly parameterized system may reduce uncertainty of the model’s predictions. However, with an increase in parameterization, parameter uncertainty may also increase (Brunner, 2015; Moeck et al., 2016). Also, highly parameterized models may not be practical, as they require greater volumes of input data, which can be expensive with regard to time, cost and
computational requirements. Prior to the study presented in Chapter 2, a systematic assessment of the predictive uncertainty surrounding various grades of snowmelt model complexity had yet to be completed.
Effect of climate change in a karst setting
According to Hartmann et al. (2014), climate simulations project a strong increase in temperature and a decrease of precipitation in many karst regions in the world over the next decades. Specifically, projections across Switzerland include an increase in mean temperature and decrease in summer mean precipitation (CH, 2011). Hartmann et al. (2014) then noted that despite this potentially changes, few studies have specifically
quantified the impacts of climate change on karst water resources. Loaiciga et al. (2000)
were among the few. These researchers applied climate change scenarios, derived from
general circulation models, to assess the potential shifts in water resources in the Edwards Balcones Fault Zone (BFZ) aquifer in Texas, USA, a region that does not receive snow. In this study, historical climatic time series in periods of extreme water shortage, near-average recharge, and above-near-average recharge were scaled to 2×CO2 conditions to create aquifer recharge scenarios in a warmer climate. These scenarios were then combined with several pumping states. This was done to assess the sensitivity of water resources to human-induced stresses. Their simulations indicated that 2×CO2 climatic conditions could exacerbate negative impacts and water shortages in the Edwards BFZ aquifer even if pumping does not increase above its present average level.
As stated by Moeck et al. (2016), sustainable management of water resources requires the evaluation of potential climate change impacts. If one is interested in how groundwater systems react to climate change, the first thing to do is evaluate potential changes in water input to the aquifer, i.e. groundwater recharge. Increasing temperatures and
changing precipitation patterns could either increase or decrease the rate of groundwater
recharge throughout a year, altering the quantity and possibly the quality of water available for human use. This is due to the coupling between precipitation, air temperature and groundwater recharge rates. The last two decades has seen a surge in research focused on modeling the interplay between climatic parameters and groundwater recharge rates at everything from the point to global scales (Adam et al., 2009; Brouyère et al., 2004; Calanca and Semenov, 2013; Dibike and Coulibaly, 2005; Eckhardt and
Ulbrich, 2003; Herrera-Pantoja and Hiscock, 2008; Loáiciga et al., 2000; Moeck et al., 2016), research that has improved our understanding of how a warmer climate might impact water resources. This area of research has been in large part motivated and facilitated by the Intergovernmental Panel on Climate Change (IPCC), a group tasked to assess the scientific, technical and socio-economic information relevant for the understanding of the risk of human-induced climate change (Barker T. et al., 2007). The IPCC has now released three generations of emission scenarios that have been used to drive global circulation models (GCM), which in turn have been used to develop climate change scenarios. GCMs have been down-scaled and climate scenarios tailored for application at smaller scales that allow for region-specific predictions. However, only few studies have specifically evaluated potential changes of recharge to karst aquifer in
regions with a seasonal snowpack. Thus, we modeled how karstic aquifer winter-season
recharge might respond to increasing air temperatures, to better understand potential shifts in future groundwater availability.
Thesis outline
The subsequent chapters of this dissertation consist of two primary authorships in peer-reviewed journals (Chapters 1 and 2), an unpublished study and thesis conclusions (Chapter 3), followed by two appendices that contain two co-authorships in peer-reviewed journals (Appendixes A and B).
Chapter 1 identifies the mechanisms behind winter season recharge to a karstic aquifer. This was assessed through analysis of surface and vadose zone time series data collected from a unique catchment with a known recharge area (~1600m2) that drains to a point 53m below ground surface in a cave, a configuration akin to a large natural lysimeter. Implications of shallow vadose zone processes on karst aquifer recharge, storage and spring discharge are then evaluated. This study was undertaken to understand not only the aforementioned processes, but to establish baseline conditions of karst aquifer response to the current climate for use in future climate change predictions as presented in Chapter 3. Chapter 1 was published in the Journal of Hydrology in 2015.
The unique experimental configuration and data set provided an opportunity for the evaluation of the predictive uncertainty surrounding snowmelt models. For karst systems, snowmelt model predictive uncertainty is particularly important as discharge and
recharge are tightly coupled, and the latter strong depends on the melt rate dynamics. Due to this tight coupling you need a good melt-model even if you are mainly interested in the spring discharge. This study was undertaken to constrain how well snowmelt models of different complexity actually predict infiltration from snowmelt. The results from this study were published in the Journal of Hydrology in January of 2017 and are presented in Chapter 2.
Chapter 3 presents the results from the application of simplistic climate change scenarios to the energy balance snowmelt model used in Chapter 2 as well as some conclusions and implications of these studies. These projections were made to evaluate how groundwater recharge rates in a karst system may shift with a warming climate.
As a contributor to the GENESIS project, of consortium scientists from across the European Union tasked to evaluate groundwater and dependent ecosystems and funded
by the European Union’s 7th Generation Groundwater Directive, I participated in research
somewhat tangential to the principal thread of my dissertation. Byproducts of my involvement in GENESIS work-packages 2 and 4 were the two publications attached as
Appendices A and B. Appendix A presents a study wherein stable isotopes (18O and 2H)
were used to identify the sources of water used by alluvial tress. Appendix B presents a critical review of groundwater vulnerability assessment methods.
Chapter 2
Snowmelt infiltration and storage within a karstic
environment, Vers Chez le Brandt, Switzerland
Jessica Meeks, Daniel Hunkeler
Accepted by Journal of Hydrology
Abstract: Even though karstic aquifers are important freshwater resources and frequently
occur in mountainous areas, recharge processes related to snowmelt have received little attention thus far. Given the context of climate change, where alterations to seasonal snow patterns are anticipated, and the often-strong coupling between recharge and discharge in karst aquifers, this research area is of great importance. Therefore, we investigated how snowmelt water transits through the vadose and phreatic zone of a karst aquifer. This was accomplished by evaluating the relationships between meteorological data, soil–water content, vadose zone flow in a cave 53 m below ground and aquifer discharge. Time series data indicate that the quantity and duration of meltwater input at the soil surface influences flow and storage within the soil and epikarst. Prolonged periods of snowmelt promote perched storage in surficial soils and encourage surficial, lateral flow to preferential flow paths. Thus, in karstic watersheds overlain by crystalline loess, a typical pedologic and lithologic pairing in central Europe and parts of North America, soils can serve as the dominant mechanism impeding infiltration and promoting shallow lateral flow. Further, hydrograph analysis of vadose zone flow and aquifer discharge, suggests that storage associated with shallow soils is the dominant source of discharge at time scales of up to several weeks after melt events, while phreatic storage becomes import during prolonged periods without input. Soils can moderate karst aquifer dynamics and play a more governing role on karst aquifer storage and discharge than previously credited. Overall, this signifies that a fundamental understanding of soil structure and distribution is critical when assessing recharge to karstic aquifers, particularly in cold regions.
Introduction
With increased global temperature, the hydrologic cycle could undergo significant alteration including possible reductions in seasonal snow cover (Beniston et al., 2003) and shifts in amount and type of precipitation (Arnell, 2001). Alterations in these parameters would invariable affect the volumetric and temporal distribution of groundwater recharge, particularly in cold-regions (Eckhardt and Ulbrich, 2003). Given that seasonal snowpacks play a significant role in the storage and redistribution of water resources (Bayard et al., 2005), several studies have addressed recharge and runoff processes attributed to spring onset snowmelt (Barnett et al., 2005; Buttle, 1989; Flerchinger, 1992; Nabi et al., 2011). However, with proposed temperature shifts possibly leading to reductions in seasonal snowpack duration and volume, the classic paradigm of winter snowpack water storage and spring on-set melt of snow may transition to multiple, ephemeral accumulation and melt cycles of snow throughout a winter/spring cycle. Therefore, more attention must be given to inter-winter infiltration processes and the mechanisms that control them, enlarging the historic focus of recharge studies beyond spring onset snowmelt. Thus we aim to expand on the few previous studies that have investigated inter-winter recharge (Iwata et al., 2010) with our study which takes place in a karstified watershed. In such aquifers, recharge is often tightly coupled to discharge due to the presence of conduit networks (Moore et al., 2009). Hence, changes in recharge patterns, due to increasing temperatures, might have a particularly strong effect on discharge trends in karstic watersheds. Additionally, caves present the opportunity to physically enter the vadose zone of a study area, a convenient advantage to other aquifer types. As such, observation of temporal trends in recharge rates can be observed directly within conduits, thereby more effectively elucidating the actual hydrological processes involved (Buttle, 1989). Karstic aquifers are broadly relied upon by an estimated 25% of earth’s population for drinking agricultural and industrial purposes and are thus an area of great concern (Ford and Williams, 2007b; Hartmann et al., 2014).
The epikarst, a spatially variable (Hartmann et al., 2012) layer of enhanced porosity that can encrust soluble bedrock, is thought to influence the temporal distribution of groundwater recharge (Klimchouk, 2004; White, 2004; Williams, 2008). This conceptual understanding is based on a breadth of studies that investigated how and why cave drip
water continued to appear within karstic vadose zones even during extended periods of drought (Bakalowicz et al., 1974; Friederich and Smart, 1982; Mangin, 1973; Williams, 1983). The epikarst was identified as a layer in which perched storage and lateral flow can occur (Friederich and Smart, 1982; Smart and Friederich, 1986; Williams, 1983). Observed rapid reactions to rain events at stalactite drip points were explained by Williams (1983) as the result of shallow lateral flow in the epikarst to vertical drains, allowing for rapid infiltration. Alternately, Klimchouk and Jablokova (1989) proposed that rising hydraulic head in the epikarst induces rapid infiltration of storm event water. Trcek (2002) built upon this latter theory by proposing “the piston effect”, in which “old” water stored in the soil and epikarst must be flushed out first followed by “new” water from a storm. Water storage was hypothesized to occur due to decreases in permeability through an epikarst’s vertical profile (Perrin et al., 2003) and differences in hydraulic conductivity between the epikarst and the lower unsaturated zone (Trçek, 2007). The significance of the epikarst storage was postulated by Trcek (2007), who concluded that karst aquifer flow largely depends on the hydraulic behavior of the epikarst zone and by Aquilina et al. (2006) who asserted the major role of the epikarst reservoir in the karst recharge functioning. And in a broad assertion, Perrin et al. (2003) posited that storage in the epikarst could be more significant than storage in the underlying phreatic zone. The interactions between and respective function of the epikarst and overlying soils have been debated, complicating the identification of recharge mechanisms in karst settings. White (2004) asserted soil cover to be unrelated to water storage in the epikarst, while Jones (2003) believed much of the apparent epikarst storage of storm water to be held in soil-filled fissures of the epikarst. White (2004) considered that while the A and O soil horizons (the American soils classification system) should be excluded from the epikarst, normally the B horizon that fills the solutional voids, should be included. Celico et al. (2010) concluded that epikarst formation can be reliant on soil thickness. Williams (2004) conceded that where soil is present, it would most likely moderate infiltration and
provide further storage of water. Lee and Krothe (2001) found epikarst, rather than soils,
to be the dominant contributor to river recharge following a storm event. In contrast to these works, Tooth and Fairchild (2003) saw soil matrix flow as the dominant karst water source during dry periods, rather than the epikarst. Perrin et al. (2003) assessed soil and
epikarst storage as a cohesive unit and deduced that while significant soil moisture storage did moderate mixing and infiltration velocities, dynamic storage could only occur in the epikarst. Therefore, ambiguity still exists regarding where exactly in the vadose zone modifications to recharge are actually taking place.
The need to resolve this ambiguity is further heightened when considering recharge from snowmelt water, where surficially stored precipitation is temporally redistributed, complicating the groundwater recharge process. While infiltration from glacial melt has been studied (Gremaud and Goldscheider, 2010a; Gremaud and Goldscheider, 2010b; Zeng et al., 2012), only Reisch and Toran (2014) have assessed the transient nature of recharge from seasonal snowmelt in karstic aquifers. By assessing hydrochemographs at a karst spring, these researchers related signatures in overall spring discharge to variations in internal runoff and diffuse infiltration. While Reisch and Toran (2014) considered soils separate from the epikarst, not much consideration was given to the role in which soils may influence the epikarst and underlying aquifer.
The unique configuration of the Vers Chez le Brandt (VCB) study location, where this study takes place, allowed us to build upon these recharge studies and also take into consideration the array of methodologies for assessing snowmelt infiltration used in other lithologic settings (Bayard et al., 2005; Buttle, 1989; Flerchinger, 1992; Sutinen et al., 2008). While varied in approach, all these studies sought to relate snowpack basal outflow to an increase in recharge, via surficially accessed data. Our analysis builds upon these surficial study configurations by assessing for snowmelt infiltration within the karst conduits in addition to the soils, upper epikarst and aquifer’s spring.
The objectives of this study were to assess how and when snowmelt waters transit and store within a karstic aquifer’s vadose zone during winter and spring snowmelt, and how groundwater recharge and discharge are related. We investigated recharge processes at two different temporal scales: firstly, to investigate how daily melt water pulses are attenuated by the soil/epikarst system and aquifer; and secondly how soil/epikarst storage can provide water during prolonged cold periods and how quickly this reserve is replenished again during periods of snowmelt. The study was carried out at the VCB in the karstified Areuse aquifer in the Swiss Jura Mountains. Here, inter-winter melt events frequently occur and the vadose zone can be accessed via a cave. The recharge area and
discharge for a cave drainage point (ie. vadose zone outflow, VCB1), 53m below the ground surface, are known. Consequently, the VCB site resembles a large, real-world lysimeter and presents an ideal situation to evaluate recharge dynamics, as infiltration rates can be directly quantified.
Site Description
Meteorological winter conditions in the Jura range are characterized by cold temperatures associated with significant snow accumulation (Bouoncristiani, 2004). The VCB sites receives approximately 1550mm of precipitation annually, 30 to 40% of which falls as
snow between the months of December and March (www.meteoswiss.ch). A proximal
Swiss Agrometeo meteostation in Les Verriers (525500, 199175 universal polar stereographic (UPS) coordinate system; Campbell-CR10x) shows that average summer and winter temperatures for the area are +14oC and -1oC respectively. The site is primarily vegetated by cocksfoot and ryegrass meadow and flanked by forest composed of fir and spruce species.
The Areuse karst aquifer, with a catchment area of 130 km2, is located in the Swiss Jura
Range’s western edge. It discharges to a single spring with an average discharge rate of 7.15 m3/sec located at an elevation of 793 m. The watershed’s groundwater resources are directly or indirectly relied upon by thousands of people via pumping wells within the karstic aquifer or for water supply and/or hydroelectric production needs generated hydraulically down gradient.
The VCB (526450/199010 UPS) site is situated within a flat area 1160 m above sea level (Figure 1). The single-chamber VCB karst cavity, which underlies the study site (average orientation N145o), inclines at an angle of 13° and parallels the imbricated bedding planes (Kiraly and Simeoni, 1971). From the VCB entrance shaft, the cave drops approximately 55 vertical meters over a distance of 260 m. The chamber is underlain by a marl sequence that is thought to confine the karst’s basal development (Goldscheider et al., 2008) and serve as an aquiclude within the watershed. Waters entering the VCB cave via drips from stalagmite straws and from the two or three (depending on degree of overburden saturation) vadose zone drainage points contribute to a perennial stream that traverses the cave length (Figure 1). The primary vadose-zone exfiltration point (VCB1) is located approximately 175 m from the cave entrance (Savoy, 2007).
Figure 1: Counter-clockwise: a regional site map; the Vers Chez le Brandt (VCB) site with approximate recharge area, cave roof drip point (VCB1) and cave orientation denoted; and profile (not to scale) of site instrumentation with conceptual flow indicated by the blue arrows.
Previous studies at the site concluded that the soil zone (Perrin, 2003) and epikarst (Perrin et al., 2003; Pronk, 2009; Savoy, 2007) serve as a collective buffering reservoir to diffuse recharge. While not validated through detailed geophysics or soil borings, water was thought to percolate through the soil zone and enter the epikarst where it was stored prior to reaching the karst conduits that drain to VCB1. A series of unpublished VCB tracer tests revealed the approximate VCB1 recharge location to be north and adjacent to the cave’s orientation (Figure 1). During this series, tracers applied above the southern side of the cave axis were never observed at VCB1. A 1979 tracer test proved hydraulic connection between the VCB cave and the Areuse Spring (Müller, 1982).
VCB bedrock is composed of Upper Jurassic (Portlandian, Kimmeridgian and Sequanian) aged marl and fossilferous limestone (Sommaruga, 1997; Valley, 2002). Two separate
Quaternary glaciers acted upon the VCB region leaving the post-ablation landscape completely denuded of soil (Campy, 1982; Campy, 1992). Mineralogical comparison of Jura soils with underlying calcareous bedrock showed that Aeolian silts of crystalline origin (plagioclase, chlorite, feldspar and an abundance of quartz) blanketed the range since glacial ablation (Pochon, 1978). These sediments accumulated to form the Neoluvisol loess soils currently in place. During VCB instrument installation, three soil pits were dug for emplacement of soil moisture sensors and for concurrent soil classification. Additionally, 7 soil cores were taken within the recharge area in the summer of 2011 to verify soil type (using the French soils classification scheme) and distribution. In all investigated locations, the upper 10 cm of VCB soil were found to be an organic-rich type A soil, dominated by shallow root structures and with a pH of 4.5. A silty type E loess, with a pH of 4.5, extends from 10cm to approximately 50cm b.g.s.. This is in turn underlain by a 10cm thickness of brown clayey BT soil (pH of 5.5). Beneath this is an undefined thickness of grey, clayey IC soils, with a pH of 8 (Figure 2).
According to Baize and Girard (2009) Neoluvisol (aka. sols bruns) soils correspond with
the Luvic Cambisols as described by the FAO World Reference Bank for Soils (Micheli
et al., 2006). Table 1 presents further detail pertaining to each soil horizon. Hand auger borings terminated at 70 to 130cm b.g.s. due to increased fractions of limestone cobbles. Field observations were confirmed by a seismic study (Müller, 1978), which revealed a layer of low permeability at 0.5 to 3m, and by Elouardi’s (1998) seismic refraction study, which implied a joint soil and epikarst thickness of approximately 2m.
Table 1: Presents descriptions of the observed VCB soil horizons and their corresponding French classification.
Observed VCB soils can be subdivided into two mineral systems. When thick accumulations of loess deposit directly over denuded limestone bedrock, acidic rainwater is able to mobilize and redistribute clay particles within the loess (Gobat, 2011). This
!"#$%&$'((#)#*'+#",%
-./0,*1%!2(+034 50(*/#6+#", 67
! *8#'98&+:';*+'&(8#<8#%;=>+#*'98?=+7%@=#"#$%&'()#'(*+,-+./0+$+1+2..+$3+45#6'('%7+ A/0
B C7%@)>=<7=%;=>+,D2.E3+4'7;@+F#8:&+48'7 A
GH C7%@)=&#'(*=>+,-2.E3+4'7;@+F#8:&+48'7 0/0
only occurs in locations with shallow rooting species, such as the ryegrass found at the site. These initially, vertically-distributed loess clays are put into solution with the infiltrating acidified rainwater and migrate downwards within the soil column until they come into contact with the basic limestone. Once in contact with the higher pH, the clay precipitates out to form an accumulation horizon. This secondary clay deposit and the overlying silt layer (now clay-poor) make up the first (allochthonous) mineral system (Figure 2). The underlying IC layer consists of clay-sized particles of chemically weather limestone that grade with depth to include an increasing fraction of limestone gravel and cobbles. The IC layer is the second mineral system, autochthonous, and is also considered the epikarst’s upper boundary. If loess accumulation is less than 40cm or if the location is vegetated by deeper rooting plant species, the limestone derived basicity is vertically redistributed within the soil profile by plant uptake and degradation, deterring remobilization of clays and consequently preventing the formation of the secondary clay accumulation horizon (Havlicek, 1999). If loess is calcareous in origin, this evolutionary soil paradigm is not applicable. The VCB soil configuration is one of four soil structures seen throughout the Jura range and should be expected in a karstified region blanketed by crystalline-sourced aeolian loess, an arrangement not uncommon throughout central Europe.
Figure 2: VCB soil structure and composition. The left letter column (A, E, BT, and IC) indicates the type of soil while the right number column (4.5, 4, 5.5, and 8) corresponds to pH values.
Methods
To discern the storage and transfer mechanisms of recharge from snowmelt in a karstic setting, approximately two years of field data, collected throughout a vertical profile within the VCB site, were qualitatively and quantitatively assessed for trends in water volume flux. Continuous measurement of snow height and time discrete sampling of snow density tracked water storage in the snow layer. Water storage in the soil was characterized based on soil moisture measurements up to a depth of 90cm across the two soil layers. Recharge was quantified by measuring discharge at the cave roof drainage point VCB1. By calculating a water balance, chances in soil water content were related to recharge, which provides some indirect insight into storage at deeper locations not accessible by measurements. Finally storage in the phreactic zones were evaluated by comparing discharge at VCB1 with discharge at the spring, especially under low flow conditions. Through these measures, we assessed for transmission and storage mechanisms for a karstic aquifer, and how these mechanisms may influence winter recharge in a changing climate.
A meteostation and soil moisture sensors were installed within the recharge area of VCB1 (Figure 1). The Pessel iMETOS Pro meteostation recorded air temperature (range of -40°C to +60°C, accuracy of +/- 0.1°C), relative humidity (range of – to 100%, accuracy of 1%), and radiation (range of 0 to 2000 W/m2). Snow height was recorded adjacent to the VCB meteostation by a Sommer USH-8 Ultrasonic Snow-depth sensor (range of 0 to 8 m, accuracy of +/- 1 cm). Decagon 5TE sensors, installed in a semi-vertical profile at 10, 25, 40, 55, 70 and 90 cm below ground surface (b.g.s.) within virgin soils recorded soil temperature (range of -40 to 50°C, accuracy of +/- 1°C) and volumetric water content (accuracy of +/- 3%). Data were recorded hourly between November 16, 2011 and May 16, 2013.
In the cave, a V-shaped 5.5m long PVC collection device mounted to the roof funneled VCB1 discharge water to a 1.4m vertical PVC pipe. Water stage within the pipe was recorded with a pressure transduce and correlated to the discharge rate via manual discharge measurements collected bi-weekly between 2010 to 2012. A WTW TertaCon 96A electrical conductivity (range of 0 to 199.9 µS/cm, accuracy of ≤ 0.5 %) and
temperature (range of -5°C to +50°C, accuracy of ≤0.1°C) sensor measured exfiltrating cave water hourly between November 16, 2011 and May 16, 2013.
For the Areuse spring (755 m a.s.l., 532980, 195880 UPS), discharge values, recorded by the Swiss Federal Office for the Environment, were used.
Randomly throughout the VCB1 recharge area, weekly snow cores were collected during the 2011/12 and 2012/13 winters using a steel snow-tube and proximal snow heights were measured. Snow core volumes and corresponding masses were used to derive snow-water equivalent (SWE). The snow height to SWE relationship was then used to approximate whether or not snowpack outflow occurred. Snowpack outflow was then directly related to groundwater recharge.
The size of the VCB1 recharge area was identified using a series of isolated summer rain events of varying intensity and duration, as observed in VCB1 hydrograph records. The
integrated area (m3) under each summer-storm event hydrograph was divided by its
corresponding total-event precipitation (m), resulting in a recharge area (m2). Base-flow
was subtracted from each event hydrograph prior to calculation and all events were preceded by periods of drought to ensure minimal effects of storage.
Results
Temporal evolution of meteorological and hydrological parameters
Observed parameters at the VCB surface and within its vadose zone, at VCB1 and the Areuse Spring changed considerably throughout both the 2011/12 and 2012/13 winters, respectively identified as the 2012 and 2013 winter seasons (Figure 3). To simplify the data presentation and discussion, the time series data are segregated into periods during which data showed distinctive trends and are annotation as Period A, B, etc. followed by either a 12 or 13 to indicate the study year (Figure 3). As data summary for these periods is presented in Table 2.
Table 2: Presents the snow cover duration and maximum snow depth for 2012 and 2013 in addition to total accumulative precipitation and VCB1 discharge for each period.
!"#$%&''()(*+,-#"% ./"0,1%23+456 7#,+*%!"#$% &''()(*+,-#"%2')6 89/'-:-,+,-#"% 2')6 7#,+*%;<=>% ?-5'1+90/% 2')6 89/'-:-,+,-#"% 2')6 7#,+*%;<=>% ?-5'1+90/% 2')6 8/9-#3%& ! !"# ! $ 8/9-#3%= %& && '' %( 8/9-#3%< ' $( #$ #( 8/9-#3%? ## #( #% #& @A>@ @A>B $$) )( $%* $!&
!"#$ %"#$ &"#$ '"#$ !"($ &"($ %"($ '"($ )$ *$ +$ ,$ -$ .$ /$ 01 23$ & -4 56 $$ %-31 7 $8 91 :; ,$ 0: 9. )+ -$
$
"<+=$ #>+=$ ?<+=$ >>+=$ @<+=$ A<+=$ Fi gu re 3 : T im e s er ie s d at a f or p re ci pi ta ti on , a ir te m pe ra tu re , s no w h ei gh t, s oi l te m pe ra tu re , s oi l w at er c on te nt , a nd V CB 1’ s d is ch ar ge , e le ct ri ca l c on du ct iv it y an d t em pe ra tu re fo r t he w in te r s ea so ns o f 2 01 1/ 12 a nd 2 01 2/ 13 . T im e s er ie s da ta is s eg re ga te d i nt o p er io ds d ur in g w hi ch d at a s ho w ed d is ti nc ti ve tr en ds a nd ar e a nn ot at ed a s P er io d A , B , e tc . f ol lo w ed b y e it he r a 1 2 o r 1 3 t o i nd ic at e t he st ud y y ea r.
The snow accumulation period (Figure 3) was approximately 20% shorter in 2012 (119 days) than in 2013 (146 days), but only slightly less snow accumulated in 2012 (97cm) compared to 2013 (103cm). Winter 2012 was characterized by an intense and dry cold period of three weeks at the end of the snow accumulation phase (B12). In winter 2013, cold periods tended to be shorter and less intense. During both winter seasons, several thaw events occurred during the snow accumulation phases B12 and B13 often accompanied by rain (Figure 3). The 2012 winter’s melt season (C12) had 3 distinct phases (a, b and c) during which an additional 5cm of precipitation fell and 16cm drained from VCB1. C13 was a wet period with an additional 30cm of precipitation and was broken up into 4 snowmelt phases (d, e, f and g), which occurred more gradually and over a longer timeframe than C12’s.
In both years, soil temperatures were above zero when snow accumulation started and remained positive throughout the snow accumulation and melt periods (Figure 3). Frost tubes confirmed the absence of soil frost. Throughout the accumulation and melt period, soil temperatures increased with depth. After the disappearance of the snow cover, the temperature gradient inverted to increasing temperatures with depth. The soil moisture content showed a distinctly different pattern in the upper and lower mineral system. Probes in the upper system (10, 25 and 40cm) reacted to rain events during phases B12 and B13 and showed diurnal fluctuations during the snowmelt phases (C12 and C13). In contrast probes in the lower system (70 and 90cm) showed stable values except for the intense cold periods in 2012. During these periods the moisture content dropped first in 70cm and subsequently also in 90cm. As indicated by flow rates at VCB1 (Figure 3), recharge events occurred not only during snow-melt (B13 and C13) but also during the snow accumulation phase (B12 and C12). During the latter, recharge events were usually associated with rain-on-snow events or days with average positive air temperatures. In this period, the total outflow amounted to 74% (2012) and 86% (2013), respectively of the total precipitation.
VCB1 event hydrograph shapes depended on whether or not the event occurred during an accumulation or melt stage (Figure 3). During snow accumulation periods, infiltration events presented as sharp rising limbs, a distinct peak discharge followed by rapidly declined recessional limbs with a substantial tailing. Even during the longest period with
sub-zero air temperatures (end of B12), VCB1 outflow never ceased, demonstrating that storage in soil and/or epikarst is sufficiently high to sustain outflow over several weeks. Hydrographs during the snowmelt period (C12 and C13) were somewhat different, reflecting much drier conditions in C12 (5cm precipitation) compared to C13 (30cm precipitation). Hydrograph events associate purely with melt water have a more Gaussian shape, with recessional and rising limbs having similar aspects and durations. Period C12 is characterized by diurnal discharge variations typical for snowmelt while in C13, sharp discharge peaks associated with rain fall are superimposed on the snowmelt pattern. During both the snow accumulation and melt phases, electrical conductivity (EC) at VCB1 dropped during each outflow event, suggesting that during all flow events freshly infiltrated water reached VCB1, not only “old” stored water from previous events. During high flow events, early in the snow accumulation phase, water temperatures at VCB1 increased likely as a result of the higher temperatures in deeper soil zones while in later periods temperatures drops reflecting colder soil temperatures. Much of the discussion below focuses on the 2012 winter with its pronounced drought period and a snow-melt period with little perturbation by rain. This period is particularly well suited to evaluate storage, because during periods of dry, freezing temperatures, discharge can be equated to changes in storage in following with the fundamental water budget equation.
Dynamics of water content in soil and epikarst
In order to assess in more detail how infiltrating snowmelt is transmitted and stored in the soils and upper epikarst, soil moisture profiles for the upper 90cm of the vadose zone were constructed for selected days of the snowmelt periods (Figure 4). The selected dates cover different stages of the melt phase of the snowpack as indicated in Figure 3 (a, b and c for 2012; d, e, f and g for 2013). The profiles represent the amplitude of soil moisture variation within a 24-hour period, with the left-most line indicating the minimum and the right-most line denoting the maximum soil water content. For both the 2012 and 2013 winters, the daily minimum and maximum moisture lines became increasingly divergent in the upper 55cm of soil as the stages of melt progressed, indicating an increase in water input from the overlying melting snowpack as melt advanced. Additionally, the average daily soil moisture content increased with each stage of melt, particularly between the 25
and 55cm depths. Saturation increased with time at the base of the upper mineral system, just above the pedological contact (55cm) with the lower mineral system, suggesting the formation of a perched water lens. Soil moisture content remained stable below 55cm, indicating that the daily influx of melt water observed in the overlying layers had minimal influence on the saturation of the lower mineral system (Figure 4). Moisture content in the upper epikarst was essentially consistent with each successive melt phase. The overall constancy of soil moisture in the calcareous clays implies that saturation in the lower mineral system (upper epikarst) had been reached over winter’s first half, which favored the formation of an overlying perched lens of melt water.
Figure 4: Soil moisture profiles for the upper 90cm of the VCB vadose zone, during the 3 melt stages of 2012 and the 4 melt stages of 2013.
To evaluate if the changes in soil moisture corresponded to significant water volumes, the temporal changes in soil water amount (cm) in the different layers were quantified and related to the SWE and outflow rates (Figure 5). This 2012 time segment (Period B12 and C12, Figure 3) was selected because it best represents the overall storage dynamics due to two prominent phenomena; a inter-winter mixed precipitation event followed by a dry spell, where VCB1 reaches winter low flow conditions (B12); and a multi-stepped melt
!"#"$"%!&'"$()$" *"#")+"%!&'"$()$" ,"#"$-"%!&'"$()$" ."#"/"%!&'"$()/" 0"1"/"23&'"$()/" 4"#"$/"%!&'"$()/" 5"1")6"23&'"$()/"
phase (C12). Figure 5 displays the temporal evolution of dynamic storage of water (cm) throughout the snow and soil profile in addition to the system’s input (precipitation) and output (VCB1 discharge). Between 1/25/12 and 2/17/12, the cold spell which lacked precipitation, the 0-40cm layer’s water content decreased by 2cm, the 40 to 70cm layer’s water content decreased by 2.7cm, and the 70-90cm layer’s water content decreased by 1.1cm, totaling 5.8cm of water collectively drained from the soils. 5.5cm of water arrived at VCB1 during this same timeframe. Hence, VCB1 outflow roughly balanced water draining from the soils in approximately 21 days, which verifies our conceptual model of the site as an oversized real world lysimeter. During this same period the water content in the clay-dominant lower mineral system showed very little reactivity to diurnal infiltration fronts, with limited drainage occurring only after two weeks without precipitation (Figure 5). Due to their high water hold capacity, the clayey soils of the lower mineral system stored 1.5cm of water for 21 days, implicating the lower mineral system as a source for base flow waters. During the three phases of melt, the 0 to 40cm segment revealed itself to be a layer of flow-through with pronounced diurnal water-fluxes. Daily water storage changes of 0.5cm during the first stage of melt in early march, increased to 1.5cm during the final stage of melt in late march (Figure 5). Also the perched lens of snowmelt in the upper mineral system drained over a 6-day period after snowmelt had finished.
Figure 5: VCB water balance showing precipitation (system input), snow water equivalent, soil water storage and VCB1 discharge (system output).
Relationship between cave and spring discharge
The significance of these small-scale, shallow hydraulic processes is evaluated by comparing the VCB1 discharge with that of the Areuse Spring, the watershed’s discharge point (Figure 6). The 2012 winter is particularly well suited to evaluate storage relationships between the VCB1 and Areuse Spring, because as mentioned, discharge can be equated to changes in storage due to subfreezing temperatures and lack of precipitation. Discharge at VCB1 and Areuse Spring were made comparable by normalizing them to their respective catchment areas (Figure 6). The normalized VCB1 and Areuse spring discharges agree surprisingly well despite the large difference in catchments size and despite relying on measurements from “opposite ends” of the groundwater flow systems. Both hydrographs show sharper peaks for events before January, likely due to rain-on-snow, which releases larger quantities of water quickly
compared to the more rounded peaks observed during the snowmelt periods. However, some differences in flow between the two scales can be observed.
Figure 6: The bottom graph depicts precipitation along with the synchronous evolution of VCB1 (dark blue line) and Areuse Spring (light blue fill) discharge (normalized to respective recharge areas) during 2012. The enclosed bivariate graph shows the approximately linear relationship between the two monitoring points.
Discussion
The mechanisms of infiltration were identified via critical study of observed vadose zone water fluxes (soils, upper epikarst and VCB1) in their peodological and geological context. Water fluxes shown in the soil moisture profiles (Figure 4) and the 2012 water balance (Figure 5) clearly indicate that melting snow infiltrates into the vadose zone throughout most of the winter and passes through the coarser upper soils to the underlying clays. Once the clay layer is saturated, when infiltration exceeds drainage capacity, they serve as a temporary aquitard, promoting the formation of an overlying water lens, the thickness of which relies on the duration of water influx from the melting snow. Said in another way: the greater the number of consecutive days with snowpack outflow, the thicker the perched water lens. The presence of the observed clay layer
!"#$% &% '( )* +,-../ 01 , 2% 3$4 ("5#,-../ 01 , 6*" . (7%8 #0,'*," #$ 4(" 5# ,(" #(, !" " " #$" " " $!" #!" " " " " %&" " " " " %#" " " " " "'" " " " " "(" " $" " (" " )" " #" " %" " %"""""""""#""""""""")""""""""("""""""""$"" 9:;,-../01, <" #= 3# ,>& "%+ 5,-../0 1,