HAL Id: hal-01888487
https://hal.archives-ouvertes.fr/hal-01888487
Submitted on 9 Sep 2020
HAL is a multi-disciplinary open access
archive for the deposit and dissemination of
sci-entific research documents, whether they are
pub-lished or not. The documents may come from
teaching and research institutions in France or
abroad, or from public or private research centers.
L’archive ouverte pluridisciplinaire HAL, est
destinée au dépôt et à la diffusion de documents
scientifiques de niveau recherche, publiés ou non,
émanant des établissements d’enseignement et de
recherche français ou étrangers, des laboratoires
publics ou privés.
development in the Hanoi region (Vietnam) using ALOS
InSAR data
V. Dang, C. Doubre, C. Weber, N. Gourmelen, F. Masson
To cite this version:
V. Dang, C. Doubre, C. Weber, N. Gourmelen, F. Masson. Recent land subsidence caused by the
rapid urban development in the Hanoi region (Vietnam) using ALOS InSAR data. Natural Hazards
and Earth System Sciences, European Geosciences Union, 2014, 14 (3), pp.657 - 674.
�10.5194/nhess-14-657-2014�. �hal-01888487�
www.nat-hazards-earth-syst-sci.net/14/657/2014/ doi:10.5194/nhess-14-657-2014
© Author(s) 2014. CC Attribution 3.0 License.
Natural Hazards
and Earth System
Sciences
Recent land subsidence caused by the rapid urban development in
the Hanoi region (Vietnam) using ALOS InSAR data
V. K. Dang1,3, C. Doubre2, C. Weber1, N. Gourmelen4, and F. Masson2
1Laboratoire Image Ville et Environnement, ERL7230, Université de Strasbourg, CNRS, 3 rue de l’Argonne, 67083
Strasbourg CEDEX, France
2Institut de Physique du Globe de Strasbourg, UMR7516, Université de Strasbourg/EOST, CNRS, 5 rue René Descartes,
67084 Strasbourg CEDEX, France
3Ha Noi National University of Education, 136 Xuan Thuy Street, Cau Giay, Ha Noi, Vietnam 4School of Geosciences, University of Edinburgh, Drummond Street, EH10 4AR Edinburgh, UK
Correspondence to: V. K. Dang ([email protected])
Received: 5 July 2013 – Published in Nat. Hazards Earth Syst. Sci. Discuss.: 5 November 2013 Revised: 20 August 2013 – Accepted: 23 February 2014 – Published: 25 March 2014
Abstract. Since the 1990s the land subsidence due to the rapid urbanization has been considered a severely destructive hazard in the center of Hanoi City. Although previous stud-ies and measurements have quantified the subsiding deforma-tion in Hanoi center, no data exist for the newly established districts in the south and the west, where construction de-velopment has been most significant and where groundwater pumping has been very intensive over the last decade. With a multi-temporal InSAR approach, we quantify the spatial distribution of the land subsidence in the entire Hanoi urban region using ALOS images over the 2007–2011 period. The map of the mean subsidence velocity reveals that the north-ern bank of the Red River appears stable, whereas some areas in southern bank are subsiding with a mean vertical rate up to 68.0 mm yr−1, especially within the three new urban dis-tricts of Hoang Mai, Ha Dong – Thanh Xuan and Hoai Duc – Tu Liem. We interpret the spatial distribution of the surface deformation as the combination of the nature of the unsatu-rated layer, the lowering of groundwater in the aquifers due to pumping withdrawal capacity, the increase of built-up sur-faces and the type of building foundation. The piezometric level in Qp aquifer lowers particularly after 2008, whereas
the groundwater level in Qhaquifer remains steady, even if it
loses its seasonal fluctuation in urban areas and drawdowns in neighboring water production plants. The time evolution deduced from the InSAR time series is consistent with previ-ous leveling data and shows that the lowering rate of the sur-face slightly decreases till 2008. The analysis of groundwater
levels in instrumented wells shows a correlation between the behavior of groundwater with the urban development and the acceleration of groundwater withdrawal. Also, the time vari-ations suggest that the deformation became non-stationary, with upward and downward transient displacements related to the charge and discharge of the aquifers.
1 Introduction
The phenomenon of land subsidence due to the underground exploitation has accelerated over the last decades because of the increasing demand of natural resources (Johnson, 1995). The ground deformation is particularly unsettling when it oc-curs in large cities, where the recent intense urbanization im-plies growing water consumption with a significant pump-ing of the aquifers. This problem has been observed in many large cities such as Mexico City (Mays, 2009), Bangkok (Aobpaet et al., 2010), Shanghai (Lin et al., 2011), Venice (Brambati et al., 2003) and Las Vegas (Bell et al., 2002). The effects are significant when the urban area is situated on alluvial plains mainly composed of unconsolidated, com-pressible sedimentary formations. Since the 1960s, a large number of studies on land subsidence have been carried out using several methods of investigation (Poland, 1984; Gal-loway et al., 2000; Gourmelen et al., 2007) for a better under-standing of the involved mechanisms (Holzer, 1984; Zhen-Dong and Ya-Jie, 2012) and its environmental consequences
(Snelting and Bruchem, 1984; National-Research-Council, 1991; Holzer and Galloway, 2005; UNESCO, 2006). The measurement techniques quantifying the ground deformation related to ground subsidence vary from in situ techniques such as leveling (Bitelli and Russo, 1991) and extensometry (Ireland et al., 1984; Poland, 1984) to spatial techniques such as static global positioning system (Ikehara, 1994), radar in-terferometry (Massonnet and Feigl, 1998) and airborne lidar (Froese and Mei, 2008).
The capital of Vietnam, Hanoi City, is a good example of a quickly urbanized city in a developing country, where groundwater is the only resource of drinking water (Jusseret et al., 2010). From the beginning of the 1990s, urban devel-opment started to prosper in both socio-economic and land use aspects. With the conversion of agricultural land to ur-ban space, several new urur-ban districts have been created in the south and west of the city center in response to housing needs. That has led to population concentrations and inten-sive water extraction through several groundwater-pumping fields in these new urban districts. Moreover, three other wa-ter production plants were added in the 2002–2005 period in suburban districts during the development of the city, with a total capacity of 30 000 m3day−1each (PPJ et al., 2011). The lowering of the groundwater level (Montangero et al., 2007) has inevitably induced local land subsidence, caus-ing numerous foundation failures of infrastructures, private small houses and old buildings (Ha, 2004). In the context of rapid urbanization after the regulation of Hanoi City’s ad-ministrative boundary in 2008, a better understanding of the ground deformation within the new urban region delimited by the Hanoi Master Plan to 2030 and vision to 2050 appears crucial for the purpose of reasonable urban planning on the one hand, and for an application of construction engineering safety solutions in the areas affected by land subsidence on the other hand.
Previous studies based on terrestrial measurements (Nguyen and Helm, 1995; Nguyen, 2007; Dinh et al., 2008) or soil characteristics modeling (Trinh and Fredlund, 2000) highlighted that some parts of the central districts have been affected by ground deformation over the last decades. For example, the in situ measurements have pointed out that the ground surface has subsided more intensely in the city center than in its surrounding areas, especially near the groundwa-ter extraction fields. The mean subsidence amplitude ranges from 1.4 to 41.0 mm yr−1for the 1994–2005 period (Nguyen, 2007). However, these in situ measurement methods are not appropriate for monitoring large-scale displacement such as land subsidence over an entirely new urban region, because they provide information at specific investigation points. On the contrary, measurements based on the remote technique of Synthetic Aperture Radar Interferometry (InSAR) are suit-able for providing subsidence magnitude over broad areas with centimetric to millimetric accuracy depending on the available data set. With this method, several studies focused on the ground deformation in central districts using
sev-eral SAR images acquired by different sensors (Raucoules and Carnec, 1999; Carnec and Raucoules, 2001; Tran, 2007; Noel, 2008; Vöge, 2011). By using the conventional InSAR approach, the study of Carnec and Raucoules (2001) showed a vertical displacement of an order of 20.0 mm within the 1996–1998 period. However, they do not obtain an accurate velocity field over the whole new urban region, since they focused only on the city center. Also, their approach suffers from some usual key limitations of the InSAR techniques. First, the available catalog of C-band images (mainly ERS and Envisat from the European Space Agency) was too small to properly cover a long time period (Noel, 2008) and un-suitable for combining SAR images separated by reasonable spatial and temporal baselines. Second, the tropical climate generates a significant atmospheric signal in the InSAR data (Takeuchi and Yamada, 2002), particularly in the troposphere from C-band images (Zebker et al., 1997). Finally, the main limitation corresponds to the decorrelation due to the change of scattering properties of the ground, mainly related to sig-nificant vegetation within the city (Wei and Sandwell, 2010). In order to overcome this difficulty, Vöge (2011) processed one couple of L-band ALOS-PALSAR images (wavelength 23.62 cm) and evidenced a maximum vertical ground dis-placement of 90.0 mm within the February 2007–June 2008 period. But this latter study, together with those ones using C-band images (ERS or Envisat), did not provide accurate deformation rates of the ground for the whole study area, for the recently urbanized areas in particular, nor over a large time period.
In this study, we apply the recent multi-temporal InSAR method, (StaMPS-MTI) developed by Hooper et al. (2007). Using a set of ALOS PALSAR’s satellite L-band images, the objectives of this study are to (1) precisely map the spatial distribution of land subsidence over the 2007–2011 period by determining the vertical velocity of a maximum of data pixels, (2) describe the temporal evolution of the subsiding areas, and (3) analyze these results with respect to several related parameters, being (i) the resistance of the shallow ge-ological layers, (ii) the extent of the new urbanized areas built during these last decades and (iii) the groundwater extraction, taking into account the locations and the extraction rate of the water pumping plants, but also the water level within the main aquifers given by a recently available data set. This cor-responds to measurements at several observation wells dur-ing the 2006–2010 period collected by the Hanoi Center for Water Resources Planning and Investigation.
2 Study area
After the renovation (Doi Moi) in 1986, the capital of Viet-nam began its economic transformation. The dyViet-namics of economic development, together with new management poli-cies, have rendered Hanoi City, especially the urban districts more attractive for immigrants from proximate provinces.
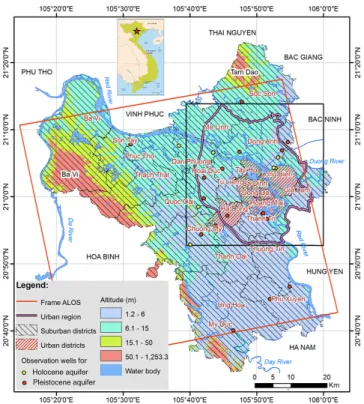
Currently, this city is divided into 10 urban districts, 19 sub-urban districts after 4 alternate times of administrative reg-ulation, promoting the conversion of peripheral agricultural areas to urban land with the creation of several urban dis-tricts such as Tay Ho in 1995, Thanh Xuan and Cau Giay in 1996, Long Bien and Hoang Mai in 2003 and Ha Dong in 2008 (Fig. 1). As a consequence, the population of the whole city grew from 2.431 to 3.184 million inhabitants from 1995 to 2006, while the population of the urban districts doubled from 1.082 to 2.050 million in the same period. Population growth went on to reach 6.472 million inhabitants in 2009, with a density of 1979 inhabitants km−2and approximately 35 000 inhabitants km−2 in some central districts, such as Dong Da or Hoan Kiem (GSO, 2009).
Hanoi City is located in the northwest of the Red River plain, dominated by flat relief with an elevation below 15 m, except for the Tam Dao hills in the north and the Ba Vi mountains in the southwest, reaching up to 462 m and 1281 m, respectively (Fig. 1). Currently, the 3325 km2 ter-ritory of Hanoi City (20◦350–21◦230N, 105◦170–106◦020E) is affected by a tropical monsoon climate with a hot summer season with heavy rainfalls spanning from May to October, and a cool and dry winter season spanning from November to April. The main flow of the Red River goes through Hanoi City and splits into the Day River on the eastern side and Duong River on the western side of the city (Fig. 1). Its hy-drology regime varies seasonally following the climate sea-son: the discharge on Red River at Hanoi hydrological sta-tion reaches a maximum of 23 × 103m3s−1(accounting for 70–80 % of the annual budget) during the rainy season and a minimum of 700 m3s−1during the dry season (Luu et al.,
2010). Red River plain is a small part of the Red River basin, which is controlled by the Neogene Red River fault system and is surrounded by Precambrian crystalline rocks and Pa-leozoic to Mesozoic rocks (Tanabe et al., 2006).
The subsoil of Hanoi City comprises the Pleistocene sed-iments of Vinh Phuc, Ha Noi, and Le Chi formations un-derlying the Holocene sediments of the Thai Binh and Hai Hung formations (Mathers and Zalasiewicz, 1999). These formations mainly consist of sediments filled in the accumu-lation process to form the Red River plain, in which costal deposits such as sand and clay are overlain by fluvial and floodplain deposits (Jusseret et al., 2010). Quaternary sedi-ments directly overlay Neogene deposits and generate two main aquifers: the Holocene unconfined aquifer (Qh) and
the Pleistocene confined aquifer (Qp), separated by an
im-permeable layer of clay (Nguyen, 1996b). The thickness of the Qh aquifer varies laterally from 10.0 m in the north to
45.0 m particularly along the Red River. This Qhaquifer is
mainly used for small-scale water exploitation by dug wells or drilling shallow wells. The depth of the Qpaquifer ranges
from 10.0 to 43.0 m and its thickness varies from 13.5 to 62.5 m beneath Hanoi City. This Qp aquifer plays a
cru-cial role in the supply of freshwater with large pumping sta-tions for almost all activities of the urban districts of the city
Fig. 1. Map of Hanoi City urban region, with location of urban and
suburban districts (after NARENCA, 2009). The black box corre-sponds to the area under study with the InSAR approach in Fig. 3.
(Rau et al., 1991). The groundwater monitoring, including water level, temperature, chemical compositions in Qp and
Qh aquifers is measured weekly through a network of
ob-servation wells: 21 wells for Qh, 32 wells for Qpdispersed
around Hanoi City (Fig. 1) by the “National Groundwater Monitoring Database” project (CWRPI, 2011). From these data sets, interpolated isocontours of the averaged groundwa-ter level for the Holocene aquifer and groundwagroundwa-ter piezomet-ric head for the Pleistocene aquifer are calculated yearly by the Northern Division of Planning and Investigation for Wa-ter Resources, utilizing the commonly used GIS and Kriging interpolation methods (Bui et al., 2010).
3 Methodology and data 3.1 Methodology
Since the early 1990s, the success of the InSAR technique has been demonstrated for a large panel of applications, such as landslides, volcanic activity, glacier motion or seismic de-formation (Bürgmann et al., 2000). In the case of repeat pass, the classical InSAR method allows the generation of inter-ferograms corresponding to the phase difference. This phase difference of a single pixel corresponds to the addition of several contributions:
with 1ϕorb, 1ϕtopo, 1ϕatm, and 1ϕdefbeing the phase
dif-ference due to the orbital positions, the topography, the at-mosphere delay, and the ground deformation, respectively. The noise term (1ϕN) is related to the variability of
scat-tering, thermal noise, and data processing errors. In order to retrieve with accuracy the deformation term, a good estimate of the other contributions is necessary, based on precise data of both orbital parameters and topography. The deformation term can be expressed as the following:
1ϕdef=4π 1R/λ, (2)
with 1R being the change of satellite–ground distance along the line of sight (LOS) direction and λ the wavelength of the radar system.
Because of its high sensitivity to vertical displacement, the InSAR monitoring of the human-induced subsidence phe-nomenon became one of the main applications (e.g., Mas-sonnet et al., 1997; Fielding et al., 1998; Galloway et al., 1998; Lazecky et al., 2010), especially in urban areas where the number of coherent pixels over time remains high (e.g., Hoffmann et al., 2001; Watson et al., 2002; Stramondo et al., 2008; López-Quiroz et al., 2009; Crosetto et al., 2010; Crosetto et al., 2013). The decorrelation noise results either from a variation of the satellite LOS direction for the two im-ages (different look and squint angles) or from a change of the scatterer position or geometry within the resolution cell. If the decorrelation noise is too significant, the interferogram will be not suitable for analyzing the deformation. Also, in the case of high deformation rates, the deformation term (1ϕdef) is dominant, which offers the opportunity to
mea-sure the displacement between two dates of image acquisi-tion (Amelung et al., 1999). However, in the case of slow mo-tion, the determination of the deformation term can be lim-ited by the preponderance of the non-deformation terms. By stacking several interferograms of the same area, the signal-to-noise ratio is increased, allowing the determination of a mean velocity of the ground over the period covered by the interferograms (Peltzer et al., 2001). This approach is effec-tive in the case of steady-state displacements, but prevents any evidence of non-stationary deformation.
In order to overcome the temporal decorrelation due to the change of scattering properties (Zebker and Villasenor, 1992), reduce the influence of the atmosphere and measure transient displacements, multi-temporal InSAR techniques have been recently developed. The methods based on multi-ple acquisitions of SAR images are known as persistent scat-terers (PS) and small baseline (SB). In general, these two ap-proaches PS and SB are optimized to process different types of scatterers on the ground. The PS approach aims to pro-cess the resolution cells dominated by one single scatterer, while the SB approach aims to treat resolution cells by many scatterers without a dominant one. The PS approach takes ad-vantage of the large energy returned by one scatterer within a resolution cell, corresponding to either rock outcrops in nat-ural areas or man-made features such as buildings, towers,
and utility poles in urban areas (Ferretti et al., 2000; Ferretti et al., 2001; Lyons and Sandwell, 2003; Kampes, 2005). For the selection of the stable pixels (or PS pixels), Ferretti et al. (2001) developed a method based on the variation of the pixel amplitude in a series of numerous interferograms par-ticularly adapted for urban areas and fast displacement rates. Many studies have been focused on land subsidence using the former PS method (e.g., Kim et al., 2007; Stramondo et al., 2008; Cigna et al., 2012; Tung and Hu, 2012). Hooper et al. (2004) developed a method based on the spatial correla-tion of the phase and the amplitude, as well as suitability for natural outcrops and low displacement rates. Both of these methods require forming all interferograms with respect to a “master” image, chosen in order to both maximize the in-terferometric coherence of all the pairs (small spatial and temporal baselines) and co-register the interferograms. The SB method, primarily developed by Berardino et al. (2002) and Schmidt and Bürgmann (2003), overcomes the temporal decorrelation problem by using combinations of multi-look interferograms separated by short time intervals and short spatial baselines. However, Hooper et al. (2004) and Lanari et al. (2004) proposed single-look interferograms via SB al-gorithms and then Lanari et al. (2007), Lanari et al. (2010) and Bonano et al. (2012) used this technique to monitor the temporal evolution of the surface deformation.
In this paper, we follow the Multi-temporal InSAR method StaMPS/MTI developed by Hooper (2008) that combines In-SAR PS method with SB method in order to extract the de-formation signal at a larger number of pixels and to increase the signal-over-noise ratio. The selection of PS pixels is per-formed firstly using PS approach developed by Hooper et al. (2007), and then, a second series of interferograms are processed using SB approach in order to identify distributed scatterers (DS), for which the filtered phase does not decor-relate significantly over short time periods. Using the MT-InSAR method, the deformation signal is extracted at both the PS and DS pixels, that we here call selected pixels (SP), increasing the spatial coverage of signal and eventually con-tributing to a better phase unwrapping. A first 3-D phase unwrapping using a statistical cost approach (Hooper et al., 2012), and then the estimate of the digital elevation model (DEM) errors by correlation with the values of the perpendic-ular baselines of each interferograms in order to unwrapped a second time taking into account these corrections. ALOS time-series analysis can suffer from residual DEM errors due to the frequent temporal correlation of the perpendicu-lar baseline (Samsonov, 2010; Chen et al., 2013), however in our data set the temporal correlation of the perpendicular baseline is low and the inversion for DEM error is robust due to the temporal variability of the perpendicular baseline; we observe no DEM errors in the region of surface deformation. Up to now, few applications of this methodology have fo-cused on land subsidence in urban areas (e.g., Aobpaet et al., 2010; Yan et al., 2012).
3.2 Data
We use a total of 22 raw SAR image scenes acquired in L-band (wavelength of 23.6 cm) at level 1.0 between February 2007 and February 2011 by the Japanese sensor (PALSAR) onboard the Advanced Land Observing Satellite (ALOS) during its descending track 475, frame 400 (Fig. 1). In order to minimize both temporal and spatial decorrelation, the se-lected master image corresponds to the image acquired on 25 July 2009. Using a threshold of 2000 m and 4 years for spatial and temporal baselines, respectively, Fig. 2a shows the 20 in-terferograms calculated with respect to this master image and Fig. 2b shows the 46 interferograms computed for the SB ap-proach. We limit our study area to the 40 × 40 km2 surround-ing the urban region (Fig. 1). For removsurround-ing the topographic contribution from the interferograms, the global digital eleva-tion model (GDEM) issued from the Advanced Spaceborne Thermal Emission and Reflection Radiometer (ASTER) ver-sion 2 with a resolution of 1.5 arcsec has been used to obtain an external elevation of this area of interest. Otherwise, the contribution of flat earth was also removed by using precise orbit data accurate to < 1 m, which are delivered with the level 1.0 product in the header file as 28 state vectors from JAXA.
4 Results
4.1 Spatial distribution of subsidence
A large number of SP (540 000) have been found within the region under study (Fig. 3). Most of these scatterers corre-spond to private houses, buildings and infrastructures, lo-cated within the dense settlements in urban districts and the surrounding villages in suburban districts. The places where no SP are selected correspond to water bodies or agricultural areas of rice fields surrounding the urban area. Assuming that most of the measured deformation corresponds to vertical displacement of the surface due to the subsidence, we con-vert the velocity obtained along the satellite line of sight into vertical velocity using the incident angle (θ ) at each measure-ment point (average of θ = 38◦for ALOS PALSAR images). We observe a heterogeneous field of vertical velocity in the Hanoi urban region, with the vertical subsidence rate ranging from 0 to 68.0 mm yr−1over the 4 years under study (Fig. 3). First, we note that the deformation is mainly con-fined within the urban region. The mean vertical velocity field indicates a clear distinction between the northern and southern parts of the Red River. In the northern part, the ground surface appears to be very stable, with few small sub-siding spots identifiable in the east of Dong Anh suburban district and between the Red River and the Duong River, such as near the headquarters of Long Bien urban district or in the southwestern part of Gia Lam suburban district (Fig. 3). For these local spots, whose horizontal extension does not
23
(a) (b)
Fig. 2: Baseline plots for (a) the PS approach and (b) the SB approach. Perpendicular baseline (Bperp) is calculated with respect to
the master image (date: 25 June 2009) used in the PS approach.
Fig. 2. Baseline plots for (a) the PS approach and (b) the SB
ap-proach. Perpendicular baseline (Bperp) is calculated with respect to the master image (date: 25 June 2009) used in the PS approach.
Fig. 3. Averaged vertical subsidence velocity in urban region of
Hanoi (location in Fig. 1) issued from InSAR processing for the period February 2007–February 2011. Red boxes are the locations for Fig. 4a–c.
exceed 1–2 km2 each, the mean vertical velocity reaches a maximum of 15.0 mm yr−1. The northern part of the south-ern bank, corresponding to the urban districts of Tay Ho, Ba Dinh, Cau Giay, and Tu Liem suburban district, is clearly distinguishable with very little deformation, except along the Red River, where a surface subsidence occurs at a slow rate, lower than 10.0 mm yr−1.
In the southern bank, the land subsidence occurs in three main areas in the south and the west of the city (Fig. 3), which are similar to the analysis in the study of Vöge (2011). First, the largest area corresponds to the urban dis-trict of Hoang Mai, south of the city center. The deforma-tion, corresponding to a mean subsidence rate larger than 30.0 mm yr−1, covers a 5 × 5 km2 surface, and is bounded
Fig. 4. Close-up maps and vertical velocity profile of (a) the Hoang Mai subsidence area, (b) the Ha Dong subsidence area (magenta boundary
presents monitoring subsidence by leveling at Van Quan residential zone), and (c) the Hoai Duc subsidence area. For location of frame and color scale, refer to Fig. 3.
to the north by very sharp velocity gradients (Figs. 3 and 4a). The maximum mean vertical rate reaches 68.0 mm yr−1,
only 1 km away from a stable area. We note the particu-larly pointy shape of a very low deformation indenting into the main deformed area, and to the east of this first subsi-dence area, some patches of subsisubsi-dence with a lateral exten-sion not larger than 0.5 × 0.5 km2 and a high vertical rate of 50.0 mm yr−1. The second area of significant deformation is located in the Ha Dong-Thanh Xuan urban district in the southwest city center (Figs. 3 and 4b). The lateral extension of this second subsiding area is significant, up to 7 × 4 km2 but very few places within this area exhibit a vertical rate higher than 45.0 mm yr−1. We distinguish only a small site with a vertical rate of 60.0 mm yr−1in the south. To the west of the urban region, the third main area of deformation ap-pears blurred due to the sparseness of scatterers in the subur-ban districts of Hoai Duc – Tu Liem, where the agricultural fields are still dominant (Figs. 3 and 4c). The patches draw a NW–SE elongated area of 18 × 3 km2, in which the vertical velocity ranges from 30.0 to 60.0 mm yr−1.
Located in the other parts of the urban region are several smaller patches of subsidence with a lateral extension smaller than 1 km2such as Dong Da, Thanh Xuan or Hai Ba Trung with a vertical velocity ranging from 10.0 to 25.0 mm yr−1, in other words, quite small in comparison to the three pre-viously described areas (Fig. 3). These values are consis-tent with the results of Carnec and Raucoules (2001) for the 1996–1998 period.
4.2 Temporal evolution analysis
The time series decomposition has to be analyzed with cau-tion since our period of observacau-tion covers only 4 years, with only 22 images used. Figure 5 presents the displacement over time for six specific pixels located within the three subsi-dence areas and near the selected instrumented wells (Fig. 3). For most them, we observe large variations in the evolution, which should be interpreted either as noise in the data due to inaccurate estimates of the baseline for instance, or an ac-tual signal revealing a complex behavior of the ground and/or external processes responsible for this pattern. However, we note that the time evolutions of each of the selected pixels share the following characteristics. In the first half of the period under examination, the surface displacement shows a regular downward motion until the end of 2008. In the second half, the variations are larger in most of the graphs, with a succession of upward and downward ground motions. This difference between the two parts of our observation pe-riod suggests that the behavior of the aquifers dramatically changed at this moment.
In order to validate our results, we compare the values of the vertical subsidence rate for a specific area, for which other data are available. Sixteen leveling campaigns were carried out from 25 June 2007 to 26 September 2008 at sev-eral building blocks in Van Quan residential zone (located in second subsidence area in the Ha Dong-Thanh Xuan dis-tricts; location on Fig. 4b) by the Hanoi Housing and Urban
26
(a) (c) (e)
(b) (d) (f)
Fig. 5: Time series of vertical displacement at several SP pixels at (a) Hoang Liet, Hoang Mai, (b) Ngu Hiep, Thanh Tri, (c) Dong Mai,
Ha Dong (d) Phu Lam, Ha Dong, (e) Di Trach, Hoai Duc, (f) Tan Lap, Hoai Duc. For location of SP sampling points, refer to Fig. 4.
Fig. 5. Time series of vertical displacement at several SP pixels at (a) Hoang Liet, Hoang Mai, (b) Ngu Hiep, Thanh Tri, (c) Dong Mai, Ha
Dong (d) Phu Lam, Ha Dong, (e) Di Trach, Hoai Duc, (f) Tan Lap, Hoai Duc. For location of SP sampling points, refer to Fig. 4.
Development Corporation. Here we look more precisely at the leveling data of building blocks TT18A and TT18B (Fig. 6a). The mean subsidence rate deduced from the level-ing data corresponds to a mean velocity of 35.0 mm yr−1for block TT18A and 27.8 mm yr−1 for block TT18B, respec-tively (Fig. 6b). Notably, these mean values are in agreement with our InSAR results, giving a mean value of 33.2 mm yr−1
and 25.6 mm yr−1for the SP points located at corresponding
building blocks. Nevertheless, we note that these values are smaller than the mean velocity of 90.0 mm during a period of 17 months (from 02 February 2007 to 22 June 2008) cor-responding to 63.5 mm yr−1determined by Vöge (2011).
However, as mentioned above, this latter study used only two images processed by the DInSAR method, with all the related uncertainties due to atmospheric heterogeneities, time decorrelation, etc. We then look at the time evolution of these measurement points and observe a great similarity between the InSAR data and the leveling data over the period from June 2007 to September 2008, which is crucial for validating our InSAR results (Fig. 6c). During the same period, neither of these data sets follow a linear function, consistent with a constant velocity, but do describe a polynomial function of second degree. This suggests a slow decrease of the verti-cal velocity with time, which reveals a specific mechaniverti-cal behavior of the layer submitted to a decrease of its pore
pres-sure due to the water withdrawal. Therefore, unless there was significant noise included only in the data for the period after September 2008, the subsiding signal over Hanoi is clearly not stationary, but includes transient displacements.
5 Discussion
5.1 Subsidence in relation with Quaternary geology Shallow geology is an important contributing factor to land subsidence phenomena and the spatial variations of its am-plitude. In the north bank of the Red and Duong rivers, the dominant layers exposed at the surface at Dong Anh and Soc Son suburban districts correspond to clay and gravel of the Vinh Phuc formation, with porosity varying from 43 to 47 % and low porous bedrock of middle Triassic (T2)is −10.0 m
below sea level (b.s.l.), at a maximum depth of 20.0 m below the topographic surface (Nguyen, 2005). In addition, the two pumping stations extract water at low rates. There are two explanations for the very low deformation observed in this part of Hanoi City. In the northern part of the south bank, even though the extraction rate of groundwater is very high and many new residential zones are being developed, little deformation is observed at the urban districts of Tay Ho, Ba Dinh, Cau Giay, and the Tu Liem suburban districts, where
Fig. 6. (a) Monitored area by leveling in the Van Quan residential zone. For location of monitoring zone by leveling, refer to Fig. 4b, and
for SP pixels in the area (color scale, refer to Fig. 3). (b) Leveling subsidence graph of blocks TT18A, TT18B (after Dinh et al., 2008). (c) Graphs of one SP located at blocks TT18A, TT18B and its leveling measurement. In order to adjust one set of data to the other one, we arbitrarily position the regression line of the leveling data through the third point of our InSAR time series.
geological layers are similarly composed by the deposits of the Vinh Phuc formation. However, south of the city center and between the two rivers, in the districts of Long Bien, Gia Lam, Hoang Mai, Thanh Tri, Thanh Xuan, Ha Dong, and Hoai Duc, the sedimentary layers below the marshy surface consist of Holocene deposits of the Hai Hung and Thai Binh formations. The Hai Hung formation contains several lay-ers of clay, sand with the porosity varying from 51 to 63 %; otherwise the Thai Binh formation contains gravels, sand and clay layers with an upward fining succession and the porosity varying from 45 to 61 %. These formations include some lens of plastic and soft materials with low bearing ca-pacity (Nguyen, 2005). The deeper geological layers below the three largest subsidence areas of Hoang Mai, Ha Dong– Thanh Xuan, and Hoai Duc–Tu Liem districts correspond to soft soil containing organic matters, sand, sandy clay, loamy sand or clay loam (Figs. 7a and 8a). The groundwater level in Qhaquifer is located at a maximum depth of −6.0 m b.s.l.
(11.5 m below the topographic surface) due to the withdrawal of main well fields (Fig. 7a).
5.2 Subsidence in relation to human activities
In terms of resource and environmental perspectives, the most apparent consequence of urbanization is the various changes in the hydrologic cycle (Mays, 2009), which are considerably perturbed by the modification of soil properties
(Haase, 2009). As human spaces become increasingly dom-inant through the urbanization process, impermeable mate-rials such as concretes, plastics or asphalts increasingly re-place natural surfaces. The impermeable coverage induces a reduction of the amount of evapotranspiration, to increase the runoff and to prevent the infiltration and the recharge of groundwater beneath the city surface. In addition, the rapid growth of human population and industry has put a great pressure on water demands for domestic and commercial purposes. Therefore, the extensive housing construction and groundwater extraction that causes significant static and dy-namic loads are expected to be land subsidence triggers, par-ticularly in an area where unconsolidated sediments in the Red River plain are characterized by high porosity.
5.2.1 Urban sprawl
After the removal of a government subsidized housing sys-tem at the end of the 1980s, an explosion of housing con-struction occurred in the city center in order to accommodate a rising urban population. At its initial stage, private house construction began with a principle of densification within the limit of Ba Dinh, Hoan Kiem, Dong Da, and Hai Ba Trung central districts (Fig. 10a; before 1993). Then, the ur-ban landscape changed to reflect added urur-ban sprawl, which took place mainly along the major national roads in Thanh Tri suburban district in the south, Tu Liem suburban district
Fig. 7. (a) Geological map of second layer, (after Nguyen, 1996a) and averaged groundwater level in Qhaquifer interpolated from in situ
measurements in 32 wells (after Vietnam Institute of Geosciences and Mineral Resources, 2010). Stratigraphic logs at (b) Hoang Mai district,
(c) Ha Dong district (after Nguyen, 2009).
in the west, Thanh Xuan urban district in the southwest and Long Bien urban district in the northeast. Then the urban de-velopment spread to the western, southwestern and the north-ern parts of city center with the creation of Tay Ho district in 1995, and Cau Giay, and Thanh Xuan urban districts in 1996 (Fig. 10a, between 1993 and 2000). Although the housing crisis in the urban districts was gradually softened by pri-vate constructions, most of those developments were realized without permission from the master plan.
At the end of 1990s, a planning measure was applied with a new concept of residential zoning, in which urban infrastructures for green space, drinkable water, electricity, and roads were developed simultaneously with the housing accommodations. Typically each new residential zone now contains several buildings of over 20–30 floors, an area for private individual houses with several floors and an area for adjacent condominiums with four or five floors. Over the last decade, the housing construction has consisted of the deploy-ment of more than 100 new residential zones by public con-struction or foreign joint venture companies, whose surfaces range from small projects (several hectares) in the urban
dis-tricts to big projects (up to several hundred hectares) in its periphery (Labbé, 2010) and the built-up surfaces have been steadily increasing, except in 2007, when the global financial crisis occurred (Fig. 10b). With the creation of Long Bien and Hoang Mai urban districts in 2003, the built-up surfaces have continued to spread to the west of the city center in the urban district of Cau Giay, to the northwest in the Tay Ho urban district, and to the southeast in the Hoang Mai ur-ban district, where the first subsidence area has risen in a densely constructed region encompassing many new residen-tial zones and small houses. In this subsidence area, the high-est mean velocity corresponds to the constructions in Dong Tau, Dai Kim, Yen So, Dinh Cong, Linh Dam, Den Lu new residential zones and Vinh Tuy industrial park (Fig. 4a). The urban expansion is still limited in the north bank of the Red River and in the southern part of the city center due to natural barriers such as streams or wetland areas (Fig. 10a, between 2000 and 2007).
Fig. 8. (a) Geologic profile AB of first subsidence area, (modified from Nguyen, 2005), groundwater level in Qh aquifer (blue), (after
Vietnam Institute of Geosciences and Mineral Resources, 2010), and piezometric level of Qpaquifer (red), (after the Northern Division
of Planning and Investigation for Water Resources, 2010). For spatial pattern of isocontours, refer to Fig. 11. (b) Graph of InSAR vertical velocity following the profiles AB. For location of profile AB, refer to Fig. 7 or Fig. 11.
Fig. 9. (a) Model of subsidence process. Example of subsidence
damages in (b) Dinh Cong residential zone at Hoang Mai sub-sidence area. (c) Van Quan residential zone at Ha Dong subsi-dence area. For location of investigation points, refer to Fig. 3. Several types of foundation are used in the study area: (d1) auger-cast piles, (d2) concrete pillars, (d3) bamboo piles (after: http: //www.cocbetong.vn).
Until the administrative regulation event in May 2008, 772 new residential and industrial projects have been planned in the new Hanoi City region, occupying 145.7 × 10³ ha, 25 000 ha of which are located in the former boundary (VET, 2008) and many big projects have been deployed all around
the urban region. The isolation of the northeastern territory was removed with the new bridges crossing over the Red River, and new residential zones were set up at eastern Long Bien and Gia Lam districts, explaining the appearance of small discrete subsidence spots between the south bank of Duong River and the north bank of the Red River. The de-veloped surfaces are expanding to the main directions of pre-vious periods, but are very strong in the west and southwest suburban districts such as Hoai Duc, Phuc Tho, Tu Liem and Ha Dong urban district, where the second and third subsi-dence areas are located, corresponding to the implementation of big residential zones such as Van Quan, Van Phu, Mo Lao, Nam An Khanh. This includes the private house construc-tion in tradiconstruc-tional villages such as La Khe, Da Sy, Van Noi, Phu Do, Dai Mo, Song Phuong, and Di Trach (Fig. 4b, c). This process helped to connect surrounding villages to devel-oped urban spaces. However, the discrete connection of the recently urbanized villages in Hoai Duc and Tu Liem sub-urban districts corresponds to the small patches of the third main subsidence area (Fig. 10a, between 2007 and 2011).
Thus, the three main subsidence areas are located in the new urban districts created after 2003 and their suburban neighborhoods, in which many new residential zones have been developed and traditional villages have been trans-formed over the last decade. The variation of the SP pattern
Fig. 10. (a) Location of new construction projects by public construction companies in urban region of Hanoi City, (after NARENCA, 2010)
and evolution of built-up surfaces until 1993, 2000, 2007, and 2011 digitized from Landsat images. (b) Evolution of Hanoi housing surfaces constructed (× 103m2)from 1999 to 2007, (after Hanoi Department of Construction, 2009).
shows a relation between the subsidence with the density of built-up surfaces, which ranges from the dense construction (urbanized areas) such as the first subsidence area in Hoang Mai urban district, to the moderate construction (urbanizing area) such as the second subsidence area in Ha Dong-Thanh Xuan urban districts, and to sparse construction (urbanizing villages) such as the third subsidence area in Hoai Duc – Tu Liem suburban districts.
5.2.2 Groundwater extraction
The groundwater supply in Hanoi City has evolved in ur-ban districts since the 19th century, in particular in the recent period, with the increase of population density and the eco-nomic changes. Two types of groundwater extraction man-agement currently exist for industrial production and drink-ing water. First, the centralized extraction is managed by the Hanoi Water Supply Company (Hawaco) with 11 well fields and 7 small stations accounting for a total of 200 wells, which allow for the extraction of the groundwater from the Pleistocene aquifer (Qp). The average withdrawal from these
well fields has been monitored, showing continuous rising of groundwater extraction over the last decades for domes-tic and industrial demand and for public services in urban districts. The inventories or research results of Nguyen and
Helm (1995), Tong et al. (2001), Duong et al. (2003), and Montangero et al. (2007) propose the following evolution of the Qp extraction: 86.5 × 10³m3day−1 in the period of
1955–1965, 180 × 103m3day−1in the period of 1975–1985, 400 × 103m3day−1 in 2001, 450 × 103m3day−1 in 2003, and eventually up to 620 × 103m3day−1in 2007. Second, a decentralized extraction has been made by many factories or companies, which drilled from their own wells due to the inability of Hawaco’s system to assure their proper indus-trial functioning. They directly extract groundwater from the confined Pleistocene aquifer (Qp) and the rate of extraction
was estimated to be 120 × 103m3day−1 in 2000 (Tong et
al., 2001). Moreover, households in suburban districts extract drinkable water using shallow drilling wells in the Holocene aquifer (Qh), whose number and extraction amounts are
im-possible to estimate (Tong et al., 2001).
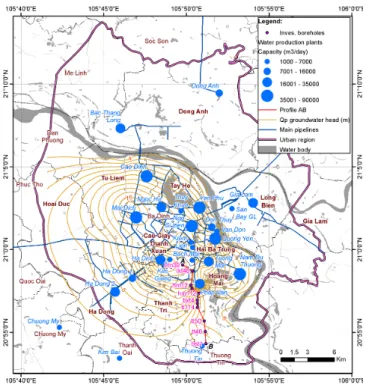
Almost all the centralized water production plants are con-centrated in the urban districts of the southern bank of the Red River, where population density is the highest (Fig. 11). The two largest subsidence areas in Hoang Mai and Ha Dong–Thanh Xuan urban districts are located close to the groundwater well fields, which have a capacity of exploita-tion varying from 16 × 103to 35 × 103m3day−1(PPJ et al., 2011). The first main vertical deformation area identified in
Fig. 11. Isocontours of the averaged groundwater piezometric level
(to sea level) in Qpaquifer of Red River’s southern part interpolated
from in situ measurements in 21 wells during 2006 (after the North-ern Division of Planning and Investigation for Water Resources, 2010) and withdrawal capacity of Hawaco water production plants, (after Hanoi Department of Planning and Architect, 2011).
Hoang Mai urban district is located between the two large Phap Van and Tuong Mai well fields, where the groundwa-ter withdrawal reaches 24 × 103m3day−1each. We note that
the groundwater piezometric head level in Qpaquifer is deep,
down to −17.0 m b.s.l. in 2010 (Fig. 11). The second main vertical deformation area is located between three well fields in the Thanh Xuan and Ha Dong urban districts (Ha Dinh, Ha Dong 1 and Ha Dong 2) with a withdrawal capacity reach-ing 23 × 103m3day−1per well field, and where the ground-water piezometric head levels in Qp aquifer was located at
−8.5 m b.s.l. in 2010 at observation well Q69(Fig. 12b). This
value reached −4.3 m b.s.l. in 2006 in the same area (Nguyen and Nguyen, 2007). The intensive groundwater withdrawal of Qpaquifer from important well fields results not only in
the drawdown of piezometric head in Qpaquifer but also in
the drawdown of the groundwater level in Qh aquifer due
to an interconnection between them in a multi-aquifer sys-tem (Alexander and Cheng, 2000). Moreover, the recorded data between 1995 and 2009 in selected monitoring wells show that the groundwater level in Qhaquifer has decreased
from 4.1 to 3.1 m a.s.l. at a rate of −0.07 m yr−1at the south bank of the Red River (Bui et al., 2010). On the contrary, in the western and southern belt of the urban region, the third largest subsidence area is not associated with any large Hawaco well fields. In these areas, the drinkable water for
households is extracted from Qhaquifer through private
shal-low wells, and the development of many factories need their own water sources, whose the decentralized groundwater ex-traction amount from Qpaquifer is impossible to estimate.
We compare our time series of the surface displacement with the evolution of the groundwater level in Qh aquifer
and piezometric level of Qpaquifer measured by Hanoi
Cen-ter for WaCen-ter Resources Planning and Investigation during the period from 2006 to 2010 at seven selected instrumented wells (Fig. 12): Q65at Hoang Liet (Hoang Mai district), Q69
at Phu Lam (Ha Dong district), Q57at Tan Lap in the north
of Hoai Duc district, Q66at Ngu Hiep in the south of Thanh
Tri district, Q75 at Dong Mai (Ha Dong district), Q120 at
Trau Quy (Gia Lam district), Q60 at An Thuong (Hoai Duc
district).
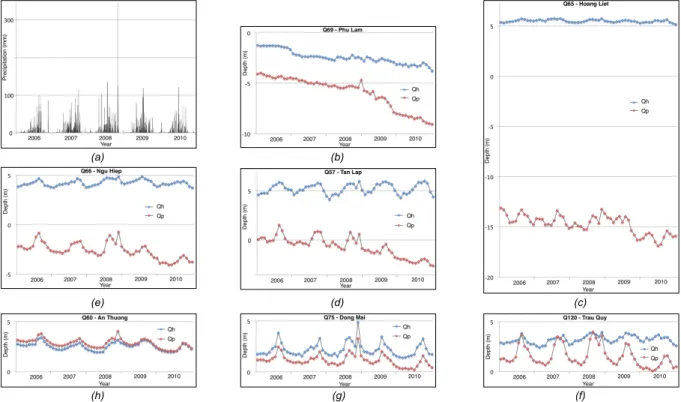
First, in order to understand the temporal evolution of these latter water levels, we look at the evolution of rain-fall during the same period. We note that, for most of the wells, the variation of groundwater in aquifers follows the variations of rainfalls with clear seasonal fluctuations: rainy season (from May to September) or dry season (from Octo-ber to April). We note particularly that the extreme rainfall on 31 October 2008 with more than 350 mm also appears in these water level time series, which indicates the water infil-tration phenomenon (Fig. 12a). The correlation between the rain and the water levels in aquifers is especially clear in ru-ral areas, where permeable surfaces are dominant and allow the natural recharge of these aquifers (Fig. 12f–h). Above the three wells with Q120, Q75 and Q60, very low deformation
affects the ground surface with the largest vertical velocity of 12 mm yr−1in the vicinity of well Q
120(Fig. 3). In the newly
urbanized villages such as the northern part of Hoai Duc dis-trict and the southern part of Thanh Tri disdis-trict, the time evo-lution of the groundwater level of Qh aquifer shows clear
seasonal variations in the Q57 and Q66 wells (Fig. 12d, e).
However, the piezometric level in Qpaquifer is located 5.0 m
deeper than the groundwater level in Qhaquifer, changing by
seasonal pattern to a linear decrease with a rate of 1.0 m yr−1 starting from 2009. These areas are affected by the subsi-dence, with a small rate ranging from 16.0 to 25.0 mm yr−1 (Fig. 3). Regarding the urbanizing Ha Dong district, where our InSAR results show a vertical rate of the ground defor-mation ranging from 45.0 to 60.0 mm yr−1(Fig. 3), the evo-lution of groundwater levels in both aquifers at Q69well,
lo-cated nearby the Ha Dong 2 production water plant (Fig. 11), does not show any seasonal variations. The water levels show a continuous lowering from 2006 at a mean rate of 1.0 m yr−1
and 0.7 m yr−1 for Q
p and Qh, respectively. However, it is
important to note a clear acceleration of the water lowering from 2009 (Fig. 12b). In the urbanized Hoang Mai district, well Q65is located in the margin of the largest subsiding area
with a subsidence rate varying from 20.0 to 42.0 mm yr−1 (Fig. 3). The evolution of the water level in the Qhaquifer
33
(a) (b)
(e) (d) (c)
(h) (g) (f)
Fig. 12: (a) Precipitation at Lang meteorological station from 2007 to 2010, (after National Hydro-Meteorological Service, 2011). Average groundwater and piezometric level in Qh, Qp during the 2006-2010 period at: (b) Q69 at Phu Lam, Ha Dong, (c) Q65 Hoang Liet, Hoang Mai, (d) Q57 at Tan Lap, Hoai Duc, (e) Q66 Ngu Hiep, Thanh Tri, (f) Q120 at Trau Quy, Gia Lam, (g) Q75 at Dong Mai, Ha Dong, (h) Q60 at An Thuong, Hoai Duc, (after Nguyen and Nguyen, 2007, 2008; Nguyen and Pham, 2009, 2010; Nguyen et al., 2011). For location, refer to Fig. 3
Fig. 12. (a) Precipitation at Lang meteorological station from 2007 to 2010, (after National Hydro-Meteorological Service, 2011). Average
groundwater and piezometric level in Qh, Qpduring the 2006–2010 period at (b) Q69at Phu Lam, Ha Dong, (c) Q65Hoang Liet, Hoang
Mai, (d) Q57at Tan Lap, Hoai Duc, (e) Q66Ngu Hiep, Thanh Tri, (f) Q120at Trau Quy, Gia Lam, (g) Q75at Dong Mai, Ha Dong, (h) Q60
at An Thuong, Hoai Duc, (after Nguyen and Nguyen, 2007, 2008; Nguyen and Pham, 2009, 2010; Nguyen et al., 2011). For location, refer to Fig. 3.
Qpaquifer exhibits a complex time evolution with variations
(Fig. 12c), but not as clear as for the wells Q75, Q120, Q60.
The evolution of water levels in all observation wells clearly shows the acceleration of groundwater withdrawal in
Qpaquifer, especially after the Hanoi’s administrative
regu-lation in May 2008 with the rising demands for water. The comparison of InSAR data with the data of water level in the aquifers suggests the important effect of the intense urban-ization on the water resources. The development of imper-meable coverage prevents the infiltration of precipitation for the recharging of Qhaquifer, together with the drawdown of
piezometric level in Qp aquifer due to pumping; this level
of Qhaquifer could be also lowered in the adjacent areas of
water production plants.
5.3 Combination of multiple factors
We therefore suggest that the spatial variations of the subsi-dence observed from our InSAR results over the Hanoi urban region are related to a combination of the lateral variations of several factors such as: the geological composition of the un-derground, the piezometric level in the Qpaquifer, the
den-sity of urban development, and the foundation design of the constructions. The first subsidence area in Hoang Mai dis-trict is a good example of this combination, which explains
the variations of the mean velocity from the northern to the southern parts of this area (Fig. 4a). In the north, the first meters of the ground correspond to sandy clay with organic matter and sand layers, that is, material susceptible to com-paction due to a loading weight and a reduction of water con-tent in the pore medium (Figs. 7b and 8a). In this area, Phap Van and Tuong Mai water production plants operate with an important withdrawal capacity (Fig. 11). At the northern part of the subsidence area, the density of construction is very high. The groundwater level in the Qh aquifer is down to
−5.0 m b.s.l., which corresponds to a depth of 10.0 m be-low the topographic surface. The piezometric level in the
Qpaquifer is down to −17.0 m b.s.l., which corresponds to
a depth of 22.0 m below the topographic surface (Fig. 12c). The maximum of deformation is located precisely where the water level in the Qpaquifer is deeper (Fig. 8a, b). North of
the location of maximum deformation, the presence of sharp gradients of deformation could be explained by the abrupt variation of thickness of sand and clay loam layers surround-ing borehole LKT46 (Figs. 7a and 8a). In the southern part of this subsidence area, in Thanh Tri and Thuong Tin suburban districts, the subsidence rates are very low (Fig. 8b) even if the geology is similarly loamy sand and sand layers (Figs. 3 and 7a). However, below these districts the groundwater level
in Qh aquifer remains high, up to 4.5 m above sea level
(a.s.l.) and the piezometric level in Qpaquifer remains high,
up to −0.5 m b.s.l. (Fig. 8a); no water production plants are susceptible to affect the water level in the deep Qpaquifer.
The subsidence affecting the second subsidence area at Ha Dong and Thanh Xuan urban districts, where the den-sity of construction is moderate, seems to result from a sim-ilar combination of effects. The groundwater level in Qh
aquifer dropped to −6.0 m b.s.l. (11.5 m below the topo-graphic surface), the piezometric level in Qp aquifer has
dropped to −9.0 m b.s.l. (14.5 m below the topographic sur-face) (Fig. 12b), and at a deeper level, the well fields of Ha Dinh, Ha Dong 1 and Ha Dong 2 water production plants op-erate with an important withdrawal capacity (Fig. 11). The soft soil layers mixed with organic materials present at the boundary of two districts (with a thickness reaching 28.0 m), which create a difficulty to impale the piles through this thick layer during the foundation works (Fig. 7c). A large region of sand or sandy clay surrounding this soft soil layer south of Ha Dong district is also susceptible to the drawdown of the groundwater level (Fig. 7a). Even in the third subsidence area at Hoai Duc – Tu Liem suburban districts, where the density of construction is much lower, the surface deforma-tion occurs with smaller amplitude than in the two previous areas. Note that the recent urbanization is starting to be asso-ciated with a drawdown of piezometric levels in Qp, which
has dropped to −3.0 m b.s.l. (10.0 m below the topographic surface) (Fig. 12d, e). However, it also represents a potential hazard, since soft soil with organic matter and sand, sandy clay or loamy sand of Hai Hung and Thai Binh formations are superficial and the installation of the many factories dur-ing last decades, and the development new residential areas is planned in the near future (Fig. 10a).
In all three subsidence areas, we observe very little dam-age to the structures of tall buildings. We propose that these buildings (that form most of the SP) are not affected by subsidence because their steady foundations are based on auger-cast piles, reaching the Neogene deposits at a depth of 50.0 to 70.0 m (Fig. 9a, d1). The 20 leveling measure-ments for the CT2 building at Van Khe (Ha Dong) from October 2008 to September 2010 show a total value of
−22.3 mm for vertical subsidence, corresponding to an av-erage of −0.97 mm month−1 (Diem et al., 2010). However, their surrounding terrain is collapsing (Fig. 9b, c), and many private houses nearby that use pile foundation methods with concrete pillars (Fig. 9d2) or bamboo piles (Fig. 9d3) are sub-siding.
The choice of foundation types could be explained as fol-lows: first, if the pile foundation is rooted into the thick soft soil layers with low load-bearing capacity, the houses are nat-urally sunk due to the compaction effect under the impact of a heavy load (Fig. 7c). Second, the concrete pillars could be impaled through the few meters of thick soft soil and reach deeper into a level of sand or loamy sand with moderate bear-ing capacity (Nguyen, 1996b) (Fig. 7b). The pillars could
have been stable initially; the drawdown of the piezometric level of Qp-confined aquifer due to pumping activities could
lead to a lowering of groundwater level in the Qh aquifer,
which will make the higher part of the clay mixing organic matters layer or sandy clay layer in this non-confined aquifer becoming regularly non-submerged into groundwater. This reduces the pore pressure in such geologic layers with high porosity to induce the compaction (Morris et al., 2003). Con-sequently, the pillars become unstable and the constructions are affected by subsidence (Downing, 1994). Third, many private houses are based on foundations consisting of bam-boo piles and an insidious problem is the drying out of the bamboo piles. As long as bamboo piles remain saturated by groundwater, they resist rot and can last for centuries. How-ever, if the Qhwater table drops below the pile tops, bamboo
rot is rapid and building supports may collapse within a few years (Shanahan, 2009). Fourth, the intensive withdrawal of the Qp aquifer generates the groundwater flows in shallow
subsurface medium composed of sand and loamy sand layer to form a problem known as “loss of fines”. This internal process facilitates the removal of sand particles, and erosion channels are promoted in the subsurface, inducing a collapse of the ground surface (Cashman and Preene, 2002).
6 Conclusions
Over the past 5 years, Hanoi City has undergone an exten-sive urbanization process and many construction projects are planned for the near future. The urbanization will trigger ur-ban sprawl as well as the infrastructure networks expanding the urban districts around the Hanoi region. Adequate meth-ods for monitoring geo-hazards in the new urban region are crucial for the city authorities to survey the subsidence phe-nomenon and limit its damaging consequences. Using in-terferometric radar technique, we investigate the scope of ground deformation related to the subsidence from 2007 to 2011. The StaMPS/MTI approach provides complete spatial coverage of the area under study, and together with the use of new L-band ALOS-PALSAR images, allows us to overcome the decorrelation problem in tropical regions such as Hanoi. Therefore, for the first time, a map of the mean subsidence velocity over the urban region of Hanoi City has been ob-tained. This map shows that the mean vertical subsidence rate ranges from 0 to 68.0 mm yr−1, and the larger zones of de-formation correspond to the three main areas in Hoang Mai, Ha Dong–Thanh Xuan and Hoai Duc – Tu Liem districts.
We demonstrate that the origin of this phenomenon is a complex combination of the presence of geologic compo-sition of sand, loamy sand, clay with organic matter and sandy clay in the Hai Hung and Thai Binh formations; the development of impermeable built-up surfaces; the lowering of piezometric levels in the Qp aquifer due to strong
with-drawal from Qpaquifer after 2008, with higher potable
level in the Qh aquifer; and the choice of foundation type.
The temporal evolution of InSAR data compared to level-ing data shows a great similarity between these two data sets. A regular lowering of the ground occurred until the end of 2008, and then large variations appear from 2009 with upward- and downward ground motions, which reveal a non-stationary state of the surface deformation. The existence of transient movements of the surface is probably related to the recharge of the aquifer by rainfalls. This study demonstrates that StaMPS/MTI is effective for the region where human-made structures, such as urban development, are dominant.
The results of this study raise important consequences for hazard management in the Hanoi urban region. A zoning of different levels of land subsidence susceptibility is crucial in order to help find the most appropriate solution. This can be achieved through a combination of groundwater reduc-tion withdrawal, restrained construcreduc-tion work, and suitable building foundations in the most susceptible areas.
Acknowledgements. The authors would like to acknowledge the support of the Vietnam Institute of Geosciences and Mineral Resources under the NAFOSTED grant 105.11.50.09, the Northern Division of Planning and Investigation for Water Resources, the Hanoi Housing and Urban Development Corporation, the Japan Aerospace Exploration Agency, the United States National Aeronautics and Space Administration, the European Space Agency under contract C1P.2616, and the Vietnam Ministry of Education and Training under Project 322. Interferometric data were processed using the open source SAR processor StaMPS. Edited by: R. Lasaponara
Reviewed by: C. Stewart and one anonymous referee
References
Alexander, H. and Cheng, D.: Multilayered aquifer systems: funda-mentals and applications, Marcel Dekker Inc., New York, 2000. Amelung, F., Galloway, D., Bell, J., Zebker, H., and Laczniak, R.:
Sensing the ups and downs of Las Vegas: InSAR reveals struc-tural control of land subsidence and aquifer-system Geology, 27, 6, 483-486, 1999.
Aobpaet, A., Cuenca, M. C., Hooper, A., and Trisirisatayawong, I.: Land subsidence evaluation using InSAR time series analysis in Bangkok metropolitan area, in: Fringe 2009 Workshop, edited by: Lacoste-Francis, H., Frascati, Italy, 30 November–4 Decem-ber 2009, s12_16aob, ESA Communications, 2010.
Bell, J. W., Amelung, F., Ramelli, A. R., and Blewitt, G.: Land Sub-sidence in Las Vegas, Nevada, 1935–2000: New Geodetic Data Show Evolution, Revised Spatial Patterns, and Reduced Rates, Geol. Soc. Am., 8, 155–174, doi:10.2113/8.3.155, 2002. Berardino, P., Fornaro, G., Lanari, R., and Sansosti, E.: A new
algo-rithm for surface deformation monitoring based on small base-line differential SAR interferograms IEEE T. Geosci. Remote, 40, 2375–2383, 2002.
Bitelli, G. and Russo, P.: Levelling data management for the mon-itoring of land subsidence, in: Proceedings of Fourth Interna-tional Symposium on Land Subsidence, edited by: Johnson, A. I., Houston, USA, 12–17 May 1991, 453–462, IAHS Publica-tion, Oxfordshire, 1991.
Bonano, M., Manunta, M., Marsella, M., and Lanari, R.: Long-term ERS/ENVISAT deformation time-series generation at full spa-tial resolution via the extended SBAS technique, Int. J. Remote Sens., 33, 4756–4783, doi:10.1080/01431161.2011.638340, 2012.
Brambati, A., Carbognin, L., Quaia, T., Teatini, P., and Tosi, L.: The Lagoon of Venice: geological setting, evolution and land subsi-dence, Episodes, 26, 3, 264–268, 2003.
Bui, D. D., Kawamura, A., Amaguchi, H., Minh, T. T., and Ngoc, T. T.: Recent Trends and Variation in Groundwater Levels of Holocene Unconfined Aquifers in Hanoi, Vietnam, in: The In-ternational Synposium Hanoi Geoengineering 2010, edited by: Pham, H. G., Mai, T. N., and Nguyen, H. M., Hanoi, Vietnam, 22–23 Nov 2010, 159–168, Vietnam National University, Ha Noi, 2010.
Bürgmann, R., Rosen, P. A., and Fielding, E. J.: Synthetic aperture radar interferometry to measure Earth’s suface topography and its deformation, Earth Planet. Sci., 28, 169-209, 2000.
Carnec, C. and Raucoules, D.: Spécificite du milieu urbain tropi-cal pour la cartographie des deformations de surface par interfer-ometrie RADAR (ERS) – Application au pompage dans les sys-temes aquiferes a Djakarta et Hanoi, Bulletin - Société française de photogrammétrie et de télédétection, 161, 40–45, 2001. Cashman, P. M. and Preene, M.: Groundwater lowering in
construc-tion: A practical guide, Spon Press, New York, 2002.
Chai, J. C., Shen, S. L., Zhu, H. H., and Zhang, X. L.: 1D analysis of land subsidence in Shanghai, Lowland Technol. Int., 7, 33–41, 2005.
Chen, F., Lin, H., Zhou, W., Hong, T., and Wang, G.: Surface defor-mation detected by ALOS PALSAR small baseline SAR inter-ferometry over permafrost environment of Beiluhe section, Tibet Plateau, China, Remote Sens. Environ., 138, 10–18, 2013. Cigna, F., Osmanouglu, B., Cabral-Cano, E., Dixon, T. H.,
Ávila-Olivera, J. A., Garduño-Monroy, V. c. H., DeMets, C., and Wdowinski, S.: Monitoring land subsidence and its induced ge-ological hazard with Synthetic Aperture Radar Interferometry: A case study in Morelia, Mexico, Remote Sens. Environ., 117, 146–161, doi:10.1016/j.rse.2011.09.005, 2012.
Crosetto, M., Monserrat, O., and Herrera, G.: Urban applications of Persistent Scatterer Interferometry, in: Radar Remote Sensing of Urban Areas, edited by: Soergel, U., Springer, Hannover, 233– 248, 2010.
Crosetto, M., Monserrat, O., Cuevas-Gonzaìlez, M., Devantheìry, N., and Crippa, B.: Analysis of X-band very high resolution Persistent Scatterer Interferometry data over urban area, Inter-national Archives of the Photogrammetry, Remote Sensing and Spatial Information Science, Hannover, Germany, 21–24 May 2013, 47–51, 2013.
CWRPI: Yearbook for groundwater ressources of Nothtern Plain in 2010, Center for Water Ressources Planning and Investigation (CWRPI), Hanoi, 2011.
Diem, C. T., Doan, D. N., Tran, N. D., Tran, T. V., Luu, T. A., and Nguyen, D. H.: Report on subsidence observation for CT2
build-ing at Van Khe, Ha Dong Vietnam Institute for Buildbuild-ing Science and Technology, Ha Noi, 28 pp., 2010.
Dinh, V. M., Hoang, A. T., Cu, T. H., and Hoang, M. T.: Re-port on measurement of new building in Van Quan ward- Hatay province, HUD-CIC Construction and Investment Consultants Joint Stock Company, Hanoi 35 pp., 2008.
Downing, R. A.: Keynote paper: Falling groundwater levels – a cost-benefit analysis, in: Groundwater Problems in Urban Areas, edited by: Wilkinson, W. B., London, England, 2–3 June 1993, 213–236, Thomas Telford, London, 1994.
Duong, H. A., Berg, M., Hoang, M. H., Pham, H. V., Gallard, H., Giger, W., and Gunten, U. v.: Trihalomethane formation by chlo-rination of ammonium- and bromide-containing groundwater in water supplies of Hanoi, Vietnam, Water Res., 37, 3242–3252, 2003.
Ferretti, A., Prati, C., and Rocca, F.: Nonlinear subsidence rate estimation using permanent scatterers in differential SAR interferometry, IEEE T. Geosci. Remote, 38, 2202–2212, doi:10.1109/36.868878,2000.
Ferretti, A., Prati, C., and Rocca, F.: Permanent Scatterers in SAR Interferometry, IEEE T. Geosci. Remote, 39, 8–21, 2001. Fielding, E. J., Blom, R. G., and Goldstein, R. M.: Rapid subsidence
over oil fields measured by SAR interferometry, Geophys. Res. Lett., 25, 3215–3218, 1998.
Froese, C. R. and Mei, S.: Mapping and monitoring coal mine subsidence using LiDAR and InSAR, GeoEdmonton’08: 61st Canadian Geotechnical Conference, Edmonton, Canada, 21–24 September, 1127–1133, Canadian Geotechnical Society, 2008. Galloway, D. L., Hudnut, K. W., Ingebritsen, S. E., Phillips, S. P.,
Peltzer, G., Rogez, F., and Rosen, P. A.: Detection of aquifer sys-tem compaction and land subsidence using interferometric syn-thetic aperture radar, Antelope Valley, Mojave Desert, California, Water Resour. Res., 34, 2573–2585, 1998.
Galloway, D. L., Jones, D. R., and Ingebritsen, S. E.: Measuring land subsidence from space: http://pubs.usgs.gov/fs/fs-051-00/ (last access: September 2013), 2000.
Gourmelen, N., Amelung, F., Casu, F., Manzo, M. R., and La-nari, R.: Mining-related ground deformation in Crescent Valley, Nevada: Implications for sparse GPS networks, Geophys. Res. Lett., 34, L09309, doi:10.1029/2007GL029427, 2007.
GSO: Population and population density by province in 2009: http://www.gso.gov.vn/default.aspx?tabid=387\&idmid=3\ &ItemID=9865 (last access: 6 March 2013), 2009.
Ha, H. V.: Report on application of remote sensing method for fault investigation supporting soft soil study at Hanoi city, University of Geology and Mining, Hanoipp., 2004.
Haase, D.: Effects of urbanisation on the water balance – A long-term trajectory, Environ. Impact Assess. Rev., 29, 211–219, 2009.
Hoffmann, J., Zebker, H. A., Galloway, D. L., and Amelung, F.: Seasonal subsidence and rebound in Las Vegas Valley, Nevada, observed by synthetic aperture radar interferometry, Water Re-sour. Res., 37, 551–1566, 2001.
Holzer, T. L.: Man-Induced Land Subsidence, Geological Society of America, Boulder, 221 pp., 1984.
Holzer, T. L. and Galloway, D. L.: Impact of land subsidence caused by withdrawal of underground fluids in the United States, in: Hu-mans as geologic agents, edited by: Ehlen, J., Haneberg, W. C.,
and Larson, R. A., The Geological Society of America, Boulder, 87–99, 2005.
Hooper, A.: A multi-temporal InSAR method incoporating both persistent scatterer and small baseline approaches, Geophys. Res. Lett., 35, L16302, doi:10.1029/2008GL034654, 2008.
Hooper, A., Zebker, H., Segall, P., and Kampes, B.: A new method for measuring deformation on volcanoes and other natural ter-rains using InSAR persistent scatterers, Geophys. Res. Lett., 31, L23611, doi:10.1029/2004GL021737, 2004.
Hooper, A., Segall, P., and Zebker, H.: Persistent scatterer interfer-ometric synthetic aperture radar for crustal deformation analysis, with application to Volcan Alcedo, Galapagos, J. Geophys. Res., 112, B07407, doi:10.1029/2006JB004763, 2007.
Hooper, A., Bekaert, D., Spaans, K., and Arıkan, M.: Recent ad-vances in SAR interferometry time series analysis for measuring crustal deformation, Tectonophysics, 514–517, 1–13, 2012. Ikehara, M. E.: Global Positioning System surveying to monitor
land subsidence in Sacramento Valley, California, USA, J. Sci. Hydrol., 39, 417–430, 1994.
Ireland, R. L., Poland, J. F., and Riley, F. S.: Land Subsidence in the San Joaquin Valley, California as of 1980, US, Geological Survey Professional, Washington, 193 pp., 1984.
Johnson, A. I.: A quarter century of IAHS/UNESCO technology transfer regarding land subsidence occurrence and research, in: Fifth International Symposium on Land subsidence, edited by: Barends, F. B. J., Brouwer, F. J. J., and Schroder, F. H., Hague, The Netherlands, 16–20 October 1995, ix–x, IAHS Publication, Oxfordshire, 1995.
Jusseret, S., Baeteman, C., and Dassargues, A.: The stratigraphical architecture of the quaternary deposits as support for hydrogeo-logical modelling of the central zone of Hanoi, Geologica Bel-gica, 13, 77–90, 2010.
Kampes, B. M.: Radar Interferometry: Persistent Scatterer Tech-nique, Springer, Dordrescht, 211 pp., 2005.
Kim, J.-S., Kim, D.-J., Kim, S.-W., Won, J.-S., and Moon, W. M.: Monitoring of urban land surface subsidence using PSInSAR, Geosci. J., 11, 59–73, doi:10.1007/BF02910381, 2007. Labbé, D.: Facing the urban transition in Hanoi: recent urban
plan-ning issues and initiatives, Institut national de la recherche scien-tifique, Montréal, 2010.
Lanari, R., Mora, O., Manunta, M., Mallorqui, J., Berardino, P., and Sansosti, E.: A small-baseline approach for in-vestigating deformations on full-resolution differential SAR interferograms, IEEE T. Geosci. Remote, 42, 1377–1386, doi:10.1109/TGRS.2004.828196, 2004.
Lanari, R., Casu, F., Manzo, M., and Lundgren, P.: Application of the SBAS-DInSAR technique to fault creep: a case study of the Hayward fault, California, Remote Sens. Environ. J., 109, 20–28, 2007.
Lanari, R., Berardino, P., Bonano, M., Casu, F., Manconi, A., Ma-nunta, M., Manzo, M., Pepe, A., Pepe, S., Sansosti, E., Solaro, G., Tizzani, P., and Zeni, G.: Surface displacements associated with the L’Aquila 2009 Mw 6.3 earthquake (central Italy): New evidence from SBAS-DInSAR time series analysis, Geophys. Res. Lett., 37, L20309, doi:10.1029/2010GL044780, 2010. Lazecky, M., Jirankova, E., and Bohmova, D.: Usage of InSAR
techniques to detect and monitor terrain subsidence due to min-ing activities, GeoSci. Eng., LVI, 4, 32–49, 2010.