HAL Id: hal-00316247
https://hal.archives-ouvertes.fr/hal-00316247
Submitted on 1 Jan 1996
HAL is a multi-disciplinary open access
archive for the deposit and dissemination of sci-entific research documents, whether they are pub-lished or not. The documents may come from teaching and research institutions in France or abroad, or from public or private research centers.
L’archive ouverte pluridisciplinaire HAL, est destinée au dépôt et à la diffusion de documents scientifiques de niveau recherche, publiés ou non, émanant des établissements d’enseignement et de recherche français ou étrangers, des laboratoires publics ou privés.
On the current-voltage relationship in auroral breakups
and westwards-travelling surges
A. Olsson, Anders I. Eriksson, P. Janhunen
To cite this version:
A. Olsson, Anders I. Eriksson, P. Janhunen. On the current-voltage relationship in auroral breakups and westwards-travelling surges. Annales Geophysicae, European Geosciences Union, 1996, 14 (12), pp.1265-1273. �hal-00316247�
Correspondence to: A. Olsson
Ann. Geophysicae 14, 1265—1273 (1996) ( EGS — Springer-Verlag 1996
On the current-voltage relationship in auroral breakups
and westwards-travelling surges
A. Olsson1, A. I. Eriksson1, P. Janhunen2,1
1 Swedish Institute of Space Physics, S-755 91 Uppsala, Sweden 2 Finnish Meteorological Institute, Helsinki, Finland
Received: 3 January 1996/Revised: 17 July 1996/Accepted: 22 July 1996
Abstract. Auroral precipitating electrons pass through an acceleration region before entering the atmosphere. Re-gardless of what produces it, a parallel electric field is assumed to cause the acceleration. It is well known that from kinetic theory an expression for the corresponding upward field-aligned current can be calculated, which under certain assumptions can be linearized to jE"K». The K constant, referred to as the Lyons-Evans-Lundin constant, depends on the source density and thermal en-ergy of the magnetospheric electrons; it is an important parameter in magnetosphere-ionosphere coupling models. However, the K parameter is still rather unknown, and values are found in a wide range of 10~8!10~10 S m~2. In this study, we investigated how the type of auroral structure affects the K values. We look at onset and westwards-travelling surge (¼¹S) events and make com-parisons with earlier results from observations of more stable auroral arcs. A new analysis technique for studying those magnetospheric parameters using ground-based measurements is introduced. Electron density measure-ments are taken with the EISCAT radar, and through an inversion technique the flux-energy spectra are calculated. Source densities, thermal energies and potential drops are estimated from fittings of accelerated Maxwellian distri-butions. With this radar technique we have the possibility to study the changes of the mentioned parameters during the development of onsets and the passage of surges over EISCAT. The study indicates that the linearization of the full Knight formulation holds even for the very high potential drops and thermal temperatures found in the dynamic onset and WTS events. The values of K are found to be very low, around 10~11 S m~2 in onset cases as well as WTS events. The results may establish a new technique where ionospheric measurements are used for studying the ionosphere-magnetosphere coupling processes.
1 Introduction
Hot magnetospheric particles move along the geomag-netic field lines, establishing the field-aligned Birkeland currents which tie the magnetosphere and ionosphere together. Especially during active periods, one can ob-serve effects of highly energetic particles causing aurora as they precipitate down to altitudes around 100 km. Alfve&n (1958) proposed the existence of an electric field along the geomagnetic field line, which would accelerate particles to these high energies. Support for this hypothesis was found later above auroral arcs, when particle spectra measured by sounding rockets showed signatures of a monoener-getic peak, which indicated the occurrence of an energiza-tion process of particles along the field line (McIlwain, 1960). Measurements from low-orbiting satellites show inverted-V-like electron spectral features, where the ener-gies of the peak downward flux change with latitude. Such spectral features are interpreted as being the result of field-aligned acceleration within regions of parallel potential drops (Franck and Ackerson, 1971; Gurnett and Frank, 1973) which were found to exist at altitudes approximately between 4 000 and 14 000 km (Thelin et al., 1990). The energies of the peak down-ward flux in the stable arc events are in the range 1—10 keV.
In this study we will discuss the high-potential drops (up to 30 kV) during a very dynamic onset of a substorm expansion phase, as well as in active aurora during the later stage of the substorm. During the auroral breakup, i.e. the onset of the expansion phase of a substorm, a bulge-like formation of intense and dynamic aurora develops, which after a while propagates westwards, and is then referred to as the westwards-travelling surge (WTS) (Inhester et al., 1981; Opgenoorth et al., 1983). In an earlier study (Olsson et al., 1996) the electron spectra for two onset events and two WTS cases, derived from EISCAT-radar data, were discussed in terms of substorm development.
The higher-potential drops occurring during the onset events may be related to a higher parallel current density,
Fig. 1. Plot showing the full Knight current density versus potential drop for different source densities and thermal energies
as a theoretical current-voltage relation would predict (Knight, 1973; Lemaire and Scherer, 1974). To sustain a high current density, an increased parallel potential drop would be needed to open up the loss cone, i.e. causing particles to precipitate which would otherwise mirror. In the derivation of the current-voltage relation, it is assumed that the upward current is carried only by magnetospheric electrons, undergoing adiabatic particle motions (i.e. preserving the first adiabatic invariant). The particles above the acceleration region are assumed to be isotropically distributed. The position where the plasma is closest to isotropic is at the equatorial plane, which is thus used as a source-plasma region. It is further assumed that the source plasma has Maxwellian distribution and is continuously replenished. The field-aligned current den-sity at ionospheric level is, with the assumptions men-tioned, found to be related to the total potential drop by the relation (Knight, 1973; Lemaire and Scherer, 1974):
j"en43#
A
E5)%32nmB
1@2 B*0/0B.C
1!A
1!B*0/0B.B
· expA
! e»E5)%3(B*0/0/B. !1)
BD
, (1)E"nA(E5)%3, n43#)E25)%3
C
B*0/0B. (2E5)%3#e») !
A
B*0/0 B. e»#2A
B*0/0B. !1B
E5)%3B
· expA
! e» E5)%3(B*0/0/B. !1)BD
, (2) where A(E5)%3, n43#)"2n43#n3@2A
2 mB
1@2 1 E3@2 5)%3 ,and e» and E5)%3 are the acceleration and the thermal energies of the source electrons, B*0/0 and B. are the magnetic field at ionospheric and magnetospheric level, respectively, and n43# is the source-plasma density.For 1
@e»/E5)%3@B*0/0/B.!1, the field-aligned cur-rent density is through series expansion of Eq. 1 shown to be linearly proportional to the acceleration voltage (Lun-din and Sandahl, 1978; Fridman and Lemaire, 1980):
j" e2
(2nm)1@2En43#1@2
5)%3
»"K», (3)
and the energy flux becomes
E" e2 (2nm)1@2En43#1@2
5)%3
»2"K»2, (4) where K is known as the field-aligned conductance (Weimer et al., 1987). Figure 1 shows the full Knight current density versus potential drop (Eq. 1) for some typical values of the temperatures and source-plasma densities. We can see that a linear relation between the current density and voltage holds for a rather wide range of voltages, »'1 kV and »(120 kV. From theoretical assumptions, Fridman and Lemaire (1980) estimated
a value of e»/k¹ between 10 and 100 for a linear relation to hold. However, from measurements, Lu et al. (1991) found an almost linear relationship to be valid even for values of e»/k¹ as low as between 1 and 10. In this study we will see whether the assumptions for a linearization of the full Knight formula are valid for a substorm-related events, and if they are, estimate theoretical K values based on n43# and E5)%3. We will not test the relationship with observations, since an estimate of the current density based on ground-based magnetometer data would be too poor to give any accurate value of the K parameter.
In the subsequent section, we shortly describe the EIS-CAT radar facility used in the experiments, and give an introduction to the method used to derive the particle spectra. In Sect. 3, we describe how the potential drop is estimated from the spectra and also comment on how the parameters needed to calculate the K parameter are esti-mated. Plots showing the estimated parameters during each event are shown. Comparisons with earlier estimated source density, thermal energy and K values are discussed in Sect. 4. Finally in Sect. 5 the results are summarized.
2 Instruments and analysis method
2.1 The EISCAT radar
The EISCAT UHF radar is a tristatic incoherent-scatter radar with a transmitting and receiving antenna situated close to Tromsø, Norway, and additional receiving sites in Kiruna, Sweden and Sodankyla( , Finland. The radar
operates on the 930-MHz band and transmits with a peak power of 1.5 MW into the ionosphere. A small fraction of the transmitted energy is scattered back from ionospheric thermal plasma waves. The total power of the echo in each altitude depends on the number density of electrons and gives an estimate of the electron density profile along the transmitting antenna direction. [For more information on the EISCAT facility, see Baron (1984)]. In the experiments used in this report the measured density profiles have a 2-km altitude resolution and 5-s time resolution. Data from 5 October 1986 and 25 January 1993 were taken with a fixed antenna direction along the magnetic field, while for the other two events the radar antenna alternates between four different directions, where one is field-alig-ned directed. For overviews of the density profiles for the four events and further information about the radar ex-periments see Olsson et al. (1996).
Other instruments, like all-sky cameras and mag-netometers, were used to identify the auroral structures as well as to put the observations into the geophysical con-text (Olsson et al., 1996).
2.2 SPECTRUM
We have used a computer algorithm, SPECTRUM, to derive the flux-energy spectrum of precipitating electrons from EISCAT electron density profiles (Kirkwood and Osepian, 1995). The program takes advantage of the capa-bilities of EISCAT to measure data with high altitude and time resolution, by including the time rate of change of ionization in the program. This makes it possible to study small-scale, rapidly varying auroral forms. Since the inver-sion procedure in SPECTRUM is extended to D-region electrons (Osepian and Kirkwood, 1996), it is suitable for studies of substorm-related events, where highly-energetic particles are expected to precipitate to low altitudes (Ols-son et al., 1996). By using the neutral-atmosphere model, MSIS-86 (Hedin, 1987), the energies of the precipitating particles are derived at the altitudes of the density measurements. The flux is calculated for each particle energy through inversion of the ionization rate for precipi-tating electrons estimated from electron density profiles and a calculated value of the ionization rates per unit incident flux for monoenergetic particle beams (Rees, 1963). Comparisons between spectra derived from this inversion method and observations from satellites show good agreement (Kirkwood, 1988; Kirkwood and Osepian, 1995).
3 Interpretation of spectra
3.1 Model for a source region
with an accelerated Maxwellian distribution
By fitting an accelerated Maxwellian function to our ob-servations, we can make interpretations of the spectrum. The acceleration model by Evans (1974) assumes an iso-tropic Maxwell-distributed plasma above the acceleration region acting as a source of electrons with thermal energy
(characteristic energy) E5)%3 and density n43#. The differen-tial directional flux of the electrons above the acceleration region is then f (E)"n43# 2n3@2
A
2 mB
1@2 EE3@25)%3exp ( ! E/E5)%3), a(90, (5)
wherea is the electron pitch angle. For adiabatic motions of the electrons the magnetic moment is conserved,
k"E sin2 (a) B. "(E#e») sin2(a#) B*0/0 , (6) a(a#"sin~1
A
B*0/0B. E#e»EB
1@2 . (7)Liouville’s theorem implies that (Lundin, 1977)
f (E,a1) E "
f (E#e»,a2)
E#e» , (8)
so the directional differential flux of particles accelerated through a parallel potential drop » is
f (E#e»)"n43# 2n3@2
A
2 mB
1@2E#e» E3@2 5)%3 exp (!E/E5)%3). (9) a(a#.The corresponding number flux is
/(E)"f (E#e», a)n sin2 (a#). (10) For the high values of the potential drops inferred from the spectra, Eq. 7 indicates that the particles can be assumed to be isotropically distributed at ionospheric level. The number fluxes, /, calculated on the basis of isotropic electrons from the SPECTRUM routine, are thus related to directional fluxes, f, by f"//n. An example of fittings of the theoretical expression of the accelerated directional flux (Eq. 9) to estimated spectra is shown in Fig. 2. The population of particles with energies lower than the peak energy may consist of reflected back-scattered electrons or secondary electrons produced by the precipitating particles (Evans, 1974).
3.2 Estimation of V, Ether and nsrc
In the acceleration process, the downwards-going primary particles are shifted in energy with an amount correspond-ing to the acceleration voltage. Thus, from the energy of the peak in the spectra, the magnitude of the potential drop » can be estimated. One may expect to see a discon-tinuity at the acceleration energy in the measured spectra, separating the accelerated particle population from the low-energy population of reflected electrons. However, we observe a smoothing of the peak. This may be interpreted as an effect of non-adiabatic processes, like wave-particle interaction. It could also be due to the SPECTRUM-analysis routine, not giving sufficient energy resolution for resolving the different particle populations accurately.
From the slope of the accelerated Maxwellian fit, we can estimate a value of the thermal energy, E5)%3. The
Fig. 2. Accelerated Maxwellian distribution functions for precipita-ting electrons fitted (dotted lines) to 5-s-resolution spectra for the onsets on 5 October 1986 (—*), 27 February 1992 (-) and the WTS events on 24 January 1993 (—· ), 25 January 1993 (—). The potential drop and thermal energy are 30 kV and 6 keV, respectively, for the onset event on 5 October 1986, and for the onset event on 27 February 1992 the values are 20 kV and 8 keV. Corresponding values for the WTS event on 24 January 1993 are 8 kV and 2 keV, and for the WTS event on 24 January 1993 the values are 14 kV and 2.5 keV
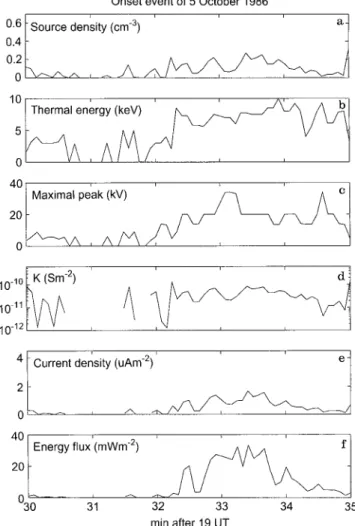
Fig. 3. a Source density, b thermal energy, c field-aligned conduc-tance, d potential drop, e current density and f energy flux esti-mated from each 5-s spectra during the 5 October 1986 event
height of the fitted curve at the acceleration energy gives an estimate of the source density n43#.
3.3 Derivation of K values, current density and energy flux
From the parameters n43# and E5)%3, the field-aligned con-ductance can be estimated, which will hereafter be referred to as KEn (see Eq. 3).A field-aligned conductance estimated from the ratio of the measured current density to the estimated potential drop will be referred to as KjV. However, this KjV para-meter will not be estimated here, but will be discussed in Sect. 4.
In this study, the current density will be estimated from
KEn multiplied by the potential drop, and represents the
value at ionospheric height (see Eq. 3).
The energy flux is derived from the same field-aligned conductance, but multiplied with the square of the esti-mated potential drop (see Eq. 4).
In Sect. 4, we will compare conductances, current den-sities and energy fluxes with previous results from satellite measurements. Often the current densities in these studies have been estimated from magnetometer data on the satellite. These current densities have been mapped down to the ionosphere before comparisons have been made with the corresponding current densities estimated from
KEn.
3.4 Estimated parameter values from EISCAT-derived spectra
In Figs. 3—6, the resulting parameters estimated from each 5-s spectrum of the events are shown. In contrast to satellite studies, which give measurements of the spatial parameter differences during the passage of an active region, we have the possibility with radar studies to study the changes of the source-plasma densities, thermal ener-gies and potential drops during the elapsed time of the development of a substorm.
From magnetograms and all-sky camera images (see Olsson et al., 1996) of the onset event illustrated in Fig. 3,
Fig. 4. a Source density, b thermal energy, c field-aligned conduc-tance, d potential drop, e current density and f energy flux esti-mated from each 5-s spectra during the 27 January 1992 event
Fig. 5. a Source density, b thermal energy, c field-aligned conduc-tance, d potential drop, e current density and f energy flux esti-mated from each 5-s spectra during the 24 January 1993 event
we state the time for the growth phase arc brightening to be 1930 UT. The onset of the expansion phase took place 2 min later, and the arc was leaving the EISCAT beam around 1935 UT. In the other auroral-breakup event (Fig. 4), we can see signatures of the onset of the expansion phase at 2120 till 2125 UT. In Fig. 5, the arrival of a surge over EISCAT can be observed at 1847 UT, and at around 1850 UT it disappears from the EISCAT range of measurement. The data gaps are related to time-periods when no potential drops could be inferred from the spec-trum. However, the time-period at 184945—184980 UT is due to missing radar data. In Fig. 6, the signatures at 1921 UT are associated with the arrival of the surge in the second WTS study.
Most striking in both onset events is the steep increase in both the thermal-energy and potential-drop values dur-ing the 1—2 min followdur-ing breakup (Figs. 3b, c, 4b, c ). During the following 3—4 min the parameter values re-main, with some fluctuations, very high. The source-plasma density shows the same tendency, although not as marked.
Compared to the onset events, the source-plasma den-sity for the surge event on 24 January 1993 shows a more
drastic increase during the time of passage (Fig. 5a), while in the first minutes of the passage of the surge on 25 January 1993, no change in source-plasma density pat-tern is seen until the last minutes of passage of the surge (Fig. 6a). However, a drastic increase in the thermal energy and potential values in both the surges is observed, al-though not with such high values as estimated in the onset cases (b, c of Figs. 3—6). In contrast to the onset events, the parameter values stay more constant, apart from some time-intervals where no fittings of Maxwellian distribu-tions were possible.
In Fig. 7, the full Knight formulation (Eq. 1) is plotted for values of the thermal energy and source-plasma den-sity associated with the highest value of the estimated potential drops for each of the four events (see a—c of Figs. 3—6). Values of the full Knight current densities lie for all events on the linear part of the characteristic for the estimated potential drops (see table in Fig. 7), and thus verifies that a linearization of the full Knight formulation is valid. Estimates of the theoretical KEn values from the source densities and thermal energies are thus reasonable, and the resulting values are seen in d of Figs. 3—6. The
KEn values are for all events rather low, being around
Fig. 6. a Source density, b thermal energy, c field-aligned conduc-tance, d potential drop, e current density and f energy flux esti-mated from each 5-s spectra during the 25 January 1993 event
Fig. 7. Plot showing that the assumptions for a linearization of the full Knight formula is valid for the substorm-related events in this study.
The estimated current density (e of Figs. 3—6) varies between 1 and 4 uA m~2 and the energy fluxes (f of Figs. 3—6) between 2 and 30 mW m~2.
4 Discussion and conclusions
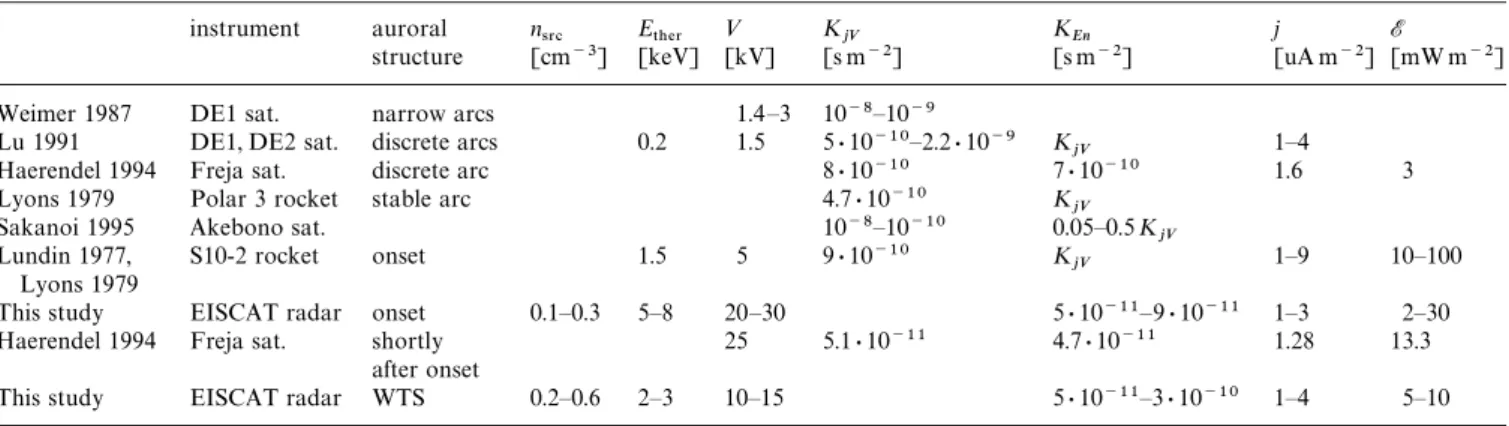
Parameter values of E5)%3, n43# and KEn are usually given without consideration of the kind of auroral structure that is present in the study. We have in this study estimated the corresponding parameters in the very dynamic onset of an expansion phase as well as in the later stage of the expan-sion phase, and in Table 1 we have sorted results from both this and earlier studies into the context of the type of auroral structure. In the top of the table we find events occurring during quieter conditions and thereafter follow results from the substorm-related events.
The magnetospheric properties have been determined from ground-based measurements with the EISCAT radar. When comparing the derived parameters, we should keep in mind the major differences between the methods of using satellite, sounding rocket and radar data, respectively. Part of the differences in the derived
parameters might be due to inaccuracies in the different measurement techniques. For instance, the energy resolu-tion from particle spectrometers on spacecrafts is often much better than that which can be obtained from the spectra based on radar data. However, the possibilities of the radar to make measurements over long time-periods and make follow-up studies of the development of, for instance, a breakup, compensates for the drawbacks. Also, the possibility of estimating the fluxes of precipitating electrons to energies over 100 keV makes possible a study of such dynamic events as substorms. Sometimes there is an instrument limit in measuring the very high energies in the particle spectrometers on satellites. However, the low-energy population measured by satellites and sounding rockets give very accurate flux values, while fluxes derived from radar data become unreliable for particles with ener-gies below 2 keV (Kirkwood and Osepian, 1995). In this study we only use data from events with energies above this limit. Another difference between satellite and radar observations is that satellite instruments observe precipi-tating particles on their way down to the ionosphere, while the radar method directly relates to the particles actually reaching the ionosphere.
4.1 Comparison of parameter values
In the following we comment on Table 1 column-by-column.
We start with the first, second and third columns, where previous measurement techniques and auroral
Table 1. Table of parameters estimated in this study and from previous studies by Weimer et al. (1987), Lu et al. (1991), Haerendel et al. (1994), Lyons et al. (1979) Sakanoi et al. (1995) and Lundin (1977)
instrument auroral n43# E5)%3 » KjV KEn j E structure [cm~3] [keV] [kV] [s m~2] [s m~2] [uA m~2] [mW m~2] Weimer 1987 DE1 sat. narrow arcs 1.4—3 10~8—10~9
Lu 1991 DE1, DE2 sat. discrete arcs 0.2 1.5 5 · 10~10—2.2 · 10~9 KjV 1—4
Haerendel 1994 Freja sat. discrete arc 8 · 10~10 7 · 10~10 1.6 3 Lyons 1979 Polar 3 rocket stable arc 4.7 · 10~10 KjV
Sakanoi 1995 Akebono sat. 10~8—10~10 0.05—0.5 KjV
Lundin 1977, S10-2 rocket onset 1.5 5 9 · 10~10 KjV 1—9 10—100 Lyons 1979
This study EISCAT radar onset 0.1—0.3 5—8 20—30 5 · 10~11—9 · 10~11 1—3 2—30 Haerendel 1994 Freja sat. shortly 25 5.1 · 10~11 4.7 · 10~11 1.28 13.3
after onset
This study EISCAT radar WTS 0.2—0.6 2—3 10—15 5 · 10~11—3 · 10~10 1—4 5—10
conditions for the observations are recorded. The discrete arcs studied by Lu et al. (1991) are traversed by the satellites during the recovery phase of a substorm (Reiff
et al., 1988), and an additional study is made in a diffuse
auroral region. The current sheets discussed by Weimer
et al. (1987) are in the range of 20 km. In an additional
study by Sakanoi et al. (1995), field-aligned conductances for 20 events are estimated without specifying the type of auroral structure, only that the scale size of the acceler-ation region is above 100 km. The study by Haerendel et
al. (1994) shows data from a satellite passage some
min-utes after an auroral breakup.
We now comment on the source plasma densities in column 4. Our original assumption was that the source plasma has a Maxwellian distribution. However, it is known that in reality, a loss cone is usually present. The loss cone is not completely empty but is partially filled by various non-linear processes and adiabatic particle heat-ing durheat-ing each bounce period. Thus it is evident that in order to get the real source-plasma density, one should divide the effective source-plasma density, which appears in Eq. 3 and in Table 1, with the loss-cone filling rate, which is a dimensionless number between 0 and 1. Thus the variations in the effective source-plasma density in Table 1, for example, do not necessarily reflect vari-ations in the true magnetospheric plasma density, but may be at least partly due to variations in the loss-cone filling rate.
In column 5 we can compare the different values of the thermal energy. Note that the thermal energies in the substorm-related events are higher than those values esti-mated for more quiet conditions. The highest values are found in the onset events. A reason for the high values of the thermal energy could be that magnetospheric particles during both the onset and the later stage of the expansion phase are strongly heated due to an energization process in the magnetotail. The higher values observed at onset would then be related to the stronger effect of this mecha-nism during the initial stage of the substorm compared to the later phase. Alternatively, or additionally, the high temperatures of the particles could also be an effect of wave-particle interactions after passage through a
near-Earth potential drop, which would cause a change of the characteristic of the spectra. According to Reiff et al. (1988), a heating of 10—15% of the potential drop in an inverted-V-like structure could be expected, while Shiokawa and Fukunishi (1991) found it to be in the range 5—40% of the potential drop.
In column 6 we can compare the different potential-drop values. Compared to the stable-arc events, very high values of the potential drops were found in the WTS and onset events, with highest values seen in the latter cases. Note that Haerendel et al. (1994) estimated a similarly high potential drop shortly after the onset of a substorm. The potential drops have in most studies been estimated from the flux-energy spectra and ion distribution (Lu
et al., 1991; Sakanoi et al., 1995). However, Weimer et al.
(1987) estimated the parallel potential from electric-field data.
In column 7 we can compare the KjV values and in column 8 the KEn values (notation discussed in Sect. 3.3). Most striking in the comparisons between the different
KEn values are the much lower values estimated for the
substorm-related events compared to the values found for the more stable events. The somewhat higher KEn value estimated by Lundin and Sandahl (1978) using sounding rocket data could be due to the measurement being made in the very early stage of the onset, as the similar corre-spondence between low potential drop and high KEn value was observed during the first seconds of the onset events studied by the EISCAT radar (Figs. 3c, d and 4c, d).
The value of KEn stayed rather constant in three of the EISCAT events (d of Figs. 3—5). However, in one of the surge events, two distinct regions with different KEn values could be estimated (Fig. 6d). This could be due to the probing of the EISCAT beam within different regions of the moving WTS. The similar pattern was observed in one of the studies by Lyons et al. (1979).
When comparing column 7 with column 8 for previous studies, we see that the KEn values calculated from
E5)%3 and n43# are much in the same range as the KjV values
estimated from the division of the measured current den-sity and voltage. However, Sakanoi et al. (1995) obtained a bad correspondence between the differently derived
K values. Since KjV values are calculated from the
field-aligned current density estimated from magnetic-field data, we can expect a slightly higher value on these, since this current takes both precipitating electrons and upward ionospheric electrons and ions into account, while the
KEn values are only based on the precipitating electrons.
However, according to Lemaire and Scherer (1974), the contribution to the downwards-going current from the upwards-going particles is very small.
The low K values found in the substorm-related events could speak in favour of substorm models like the Bal-looning-mode instability (Roux et al., 1991).
In column 9 we make comparisons between the current densities. The current densities in the substorm-related events are estimated from the KEn values, while the current densities given for the more stable arcs are estimated from magnetometer data or particle fluxes.
We cannot compare the current densities and energy fluxes with each other in the four different events, since each situation is probably very dependent on the amount of stored tail energy. However, comparisons between the two onset events show that although the ground magnetic disturbance is six times stronger in one of the events (Olsson et al., 1996), we still obtain the same magnitude of current density in the two cases. It is interesting to note that we also find the equal magnitude of current densities in the surge events. However, the current-density values are found to be lower than those estimated for the more stable conditions, which could imply that the maximal current density may depend on the scale size of the active region, or it could also be due to saturation effects caused by current-driven instabilities.
From the current-voltage relation one would at first sight expect a higher current density corresponding to the higher potential drops in the onsets relative to the surges. However, this is not the case, due to the dependence of the current density on the parameters E5)%3 and n43# (see Eq. 3). In the onset events the E5)%3 is found to be higher, but the
n43# lower compared to the WTS events.Despite the low estimated current densities in
substorm-related events, the current-density values are in the same range as would be expected from any sub-strom model based on a cross-tail current disruption theory.
4.2 Importance of the validity of the linear current-voltage and energy flux-voltage relations
By measuring the current density and the potential drop at different locations (Lu et al., 1991) and in regions with different active structures, average globally valid K values can be estimated. These K values could be useful for any determination of the potential drop when the current density is known, and vice versa. The K parameter is a key parameter in all electrostatic ionosphere-magnetosphere coupling models. Earlier estimated values of the para-meter differ by a factor of 100. We have here shown the possibility to specify the parameter somewhat more by putting it into the context of what kind of structure we are dealing with.
We have in this study shown that the assumptions for a linearization of the full Knight formula are valid, while, we have not tested whether the linear relationship as such is valid for substorms, we hope to do this in a future study using satellite data. However, earlier observational tests with sounding rockets and satellites have verified a linear relationship to hold above auroral arcs during more stable conditions (Lyons et al., 1979; Weimer et al., 1987; Lu et al., 1991).
It is important to note that the validity of the linear current-voltage relationship does not say anything about the origin of the potential drop, only its effect on the precipitating particles (Lysak, 1990). Still, there are some models showing how the potential drop is sustained that directly predict a linear current-voltage relationship. Such a relationship can arise from the models of magnetic mirroring (e.g. Alfve´n and Fa¨lthammar, 1963; Lyons, 1981), anomalous resistivity by double layers (Lysak and Hudson, 1987) and larger-scale Alfve´n waves (e.g. Temerin
et al., 1986). In models using waves to accelerate auroral
electrons (e.g. Bingham et al., 1984; Seyler et al., 1995), there is no direct explanation of the linear relation be-tween energy of the precipitated particles and the field-aligned current.
5 Summary
We have introduced a new technique for studying mag-netospheric processes using ionospheric measurements from radar. From radar data, magnetospheric parameters associated with the current-voltage relationship have been estimated during two onset and two WTS events. We summarize the results as follows:
—Very high thermal energies are found in the WTS events
(2—3 keV) and even higher values in the onset case (5—6 keV).
—The thermal energy and potential drops decrease
grad-ually towards the outer regions of the auroral-breakup zone.
—The assumptions for a linearization of the full Knight
formula are valid.
—Very high potential drops are found in the WTS events
(10—15 kV) and even higher values in the onset case (20—30 kV).
—Very low KEn (10~11 Sm~2) are estimated in the sub-storm-related events, with a factor of 10 lower than
estimated during more stable conditions.
—Although the ground magnetic disturbance is six times
stronger in one of the onsets than in the other, we still get the same magnitude of the field-aligned current density in the two onsets.
—Current densities estimated from the KEn values duringsubstorm-related events are lower than those estimated
during quiet conditions.
It would be of interest to make comparisons between the total field-aligned currents in the different events. Unfortunately measurements over such wide regions as the area of an onset are, for practical reasons, not possible. It would also be interesting to make observations dur-ing the whole stage of an expansion phase to see how the
current density changes and to examine its dependence on the source density, thermal energy and potential drop.
This would give some information on what importance the source region and the source mechanism play in the acceleration of magnetospheric particles, and also the role of the amount of stored tail energy. Unfortunately, this is in practice very difficult, since it would require a chain of radars along the auroral oval. For a better statistical study we would need more events, where considerations are taken as to the amount of stored tail energy and location of observation. However, it is a rare event to obtain an overhead EISCAT auroral breakup. To expand the study, we plan to use satellite observations.
Acknowledgements. The authors wish to thank the staff of EISCAT
for their help in carrying out the experiments. The EISCAT Scient-ific Association is supported by the SA of Finland, CNRS of France, MPG of Germany, NAF of Norway, NFR of Sweden and the SERC of the United Kingdom. We would especially like to thank Sheila Kirkwoood and Harald Frey for valuable discussions.
Topical Editor D. Alcayde´ thanks H. Frey and another referee for their help in evaluating this paper.
References
Alfve{ n, H., On the theory of magnetic storms and aurorae, 10, 104—116, 1958.
Alfve{ n, H., and C. G. Fa~lthammar, Electrodynamics, Clarendon, Oxford, 1963.
Baron, M., The EISCAT facility, J. Atmos. ¹err. Phys., 46, 469—472, 1984.
Bingham, R., D. A. Bryant, and D. S. Hall, A wave model for the aurora, Geophys. Res. ¸ett., 11, 327—330, 1984.
Evans, D. S., Precipitating electron fluxes formed by a magnetic field aligned potential difference, J. Geophys. Res., 79, 2853—2858, 1974.
Frank, L. A., and K. L. Ackerson, Observations of charged particle precipitation into the auroral zone, J. Geophys. Res., 76, 3612—3643, 1971.
Fridman, M., and J. Lemaire, Relationship between auroral electron fluxes and field-aligned electric potential differences, J. Geophys.
Res., 85, 664—670, 1980.
Gurnett, D. A., and L. A. Frank, Observed relationship between electric field and auroral particle precipitation, J. Geophys. Res., 78, 145—170, 1973.
Haerendel, G., H. U. Frey, O. H. Bauer, E. Rieger, J. Clemmons, M. H. Boehm, D. D. Wallis, and H. Lu~ hr, Inverted-V events simulta-neously observed with the Freja satellite and from the ground,
Geophys. Res. ¸ett., 21, 1891—1894, 1994.
Hedin, A. E., MSIS-86 thermospheric model, J. Geophys. Res., 92, 4649—4662, 1987.
Inhester, B., W. Baumjohann, R. A. Greenwald, and E. Nielsen, Joint two-dimensional observations of ground magnetic and iono-spheric electric fields associated with auroral zone currents dur-ing the passage of a westward-travelldur-ing surge, J. Geophys. Res., 49, 155—162, 1981.
Kirkwood, S., Spectrum, a computer algorithm to derive the flux-energy spectrum of precipitating particles from EISCAT electron density profiles, ¹echnical report 034, Swedish Institute of Space Physics, Kiruna, Oct. 1988.
Kirkwood, S., and A. Osepian, Qualitative studies of energetic par-ticle precipitation using incoherent-scatter radar, J. Geomagn.
Geoelectr., 47, 783—799, 1995.
Knight, S., Parallel electric fields, J. Space Sci. 21, 741—750, 1973. Lemaire, J., and M. Scherer, Ionosphere-plasmasheet field-aligned
currents and parallel electric fields, Planet. Space. Sci., 22, 1485—1490, 1974.
Lu, G., P. H. Reiff, J. L. Burch, and J. D. Winningham, On the auroral current-voltage relationship, J. Geophys. Res., 96, 3523—3531, 1991. Lundin, R., Investigations of auroral electron precipitation by means
of sounding rockets, REPORT NO. 77: 1 April 1977.
Lundin, R., and I. Sandahl, Some characteristics of the parallel electric field acceleration of electrons over discrete auroral arcs as observed from two rocket flights, SP-135 125—136, 1978. Lyons, L. R., Discrete aurora as the direct result of an inferred
high-altitude generating potential distributions. J. Geophys. Res., 86, 1—8, 1981.
Lyons, L. R., D. S. Evans, and R. Lundin, An observed relation between magnetic field aligned electric fields and downward electron energy fluxes in the vicinity of auroral forms. J. Geophys.
Res., 84, 457—461, 1979.
Lysak, R. L., Electrodynamic coupling of the magnetosphere and ionosphere, Space. Sci. Rev., 52, 33—87, 1990.
Lysak, R. L., and M. K. Hudson, Effect of double layers on magneto-sphere-ionosphere coupling, and particle beams, 5, 351—366, 1987.
McIlwain, C. E., Direct measurement of particles producing visible aurora, J. Geophys. Res., 65, 2727, 1960.
Olsson, A., M. A. L. Persson, H. J. Opgenoorth, and S. Kirkwood, Particle precipitation in auroral breakups and westward-travel-ling surges, J. Geophys. Res., 1996.
Opgenoorth, H. J., R. J. Pellinen, W. Baumjohann, and E. Nielsen, Three-dimensional current flow and particle precipitation in a westward-travelling surge (observed during the barium-geos rocket experiment), J. Geophys. Res., 88, 3138—3152, 1983. Osepian, A., and S. Kirkwood, High-energy electron fluxes derived
from EISCAT electron-density profiles, J. Atmos. ¹err. Phys., 58, 479—487, 1996.
Rees, M. H., Auroral ionisation and excitation by incident energetic electrons, Planet. Space Sci., 11, 1209—1218, 1963.
Reiff, P. H., H. L. Collin, J. D. Cravan, J. L. Burch, J. D. Winnin-gham, E. G. Shelley, L. A. Frank, and M. A. Friedman, Deter-mination of auroral electrostatic potentials using high- and low-altitude particle distributions, J. Geophys. Res., 93, 7441—7465, 1988.
Sakanoi, K., H. Fukunishi, and T. Mukai, Relationship between field-aligned currents and inverted-V parallel potential drops ob-served at midaltitudes, J. Geophys. Res., 100, 19343—19360, 1995. Seyler, C. E., J. E. Wahlund, and B. Holback, Theory and simulation of low Freja frequency plasma waves and comparison to Freja satellite observations, J. Geophys. Res., 100, 21453—21472, 1995. Shiokawa, K., and H. Fukunishi, Global characteristics of field-aligned acceleration processes associated with auroral arcs, J.
Geomagn. Geoelectr., 43, 691, 1991.
Temerin, M., J. McFadden, M. Boehm, C. W. Carlson, and W. Lotko, Production of flickering aurora and field-aligned electron flux by electromagnetic ion cyclotron waves, J. Geophys. Res., 91, 5769—5792, 1986.
Thelin, B., B. Aparicio, and R. Lundin, Observations of upflowing ionospheric ions in the mid-altitude cusp/cleft region with the Viking satellite, J. Geophys. Res., 95, 5931—5939, 1990. Weimer, D. R., D. A. Gurnett, C. K. Goertz, J. D. Menietti, J. L.
Burch, and M. Sugiura, The current-voltage relationship in aur-oral current sheets, J. Geophys. Res., 92, 187—194, 1987.