https://doi.org/10.4224/17506217
READ THESE TERMS AND CONDITIONS CAREFULLY BEFORE USING THIS WEBSITE. https://nrc-publications.canada.ca/eng/copyright
Vous avez des questions? Nous pouvons vous aider. Pour communiquer directement avec un auteur, consultez la
première page de la revue dans laquelle son article a été publié afin de trouver ses coordonnées. Si vous n’arrivez pas à les repérer, communiquez avec nous à PublicationsArchive-ArchivesPublications@nrc-cnrc.gc.ca.
Questions? Contact the NRC Publications Archive team at
PublicationsArchive-ArchivesPublications@nrc-cnrc.gc.ca. If you wish to email the authors directly, please see the first page of the publication for their contact information.
Archives des publications du CNRC
For the publisher’s version, please access the DOI link below./ Pour consulter la version de l’éditeur, utilisez le lien DOI ci-dessous.
Access and use of this website and the material on it are subject to the Terms and Conditions set forth at
Assessment of Canada’s hydrokinetic power potential
Jenkinson, R. W.
https://publications-cnrc.canada.ca/fra/droits
L’accès à ce site Web et l’utilisation de son contenu sont assujettis aux conditions présentées dans le site LISEZ CES CONDITIONS ATTENTIVEMENT AVANT D’UTILISER CE SITE WEB.
NRC Publications Record / Notice d'Archives des publications de CNRC:
https://nrc-publications.canada.ca/eng/view/object/?id=2ec26a71-a48d-4a95-8068-c2694fe46173 https://publications-cnrc.canada.ca/fra/voir/objet/?id=2ec26a71-a48d-4a95-8068-c2694fe46173
Assessment of Canada’s Hydrokinetic Power Potential
Phase I Report – Methodology and Data Review
Technical Report CHC-TR-070
Prepared for:
Natural Resources Canada
Prepared by:
R. W. Jenkinson Canadian Hydraulics Centre National Research Council of Canada
Ottawa, K1A 0R6, Canada
EXECUTIVE SUMMARY
Natural Resources Canada (NRCan) has identified a need to assess Canada’s hydrokinetic potential as a national renewable resource. To reach this objective a three-phase project was commissioned:
Phase I Methodology Review and Data Review – a review of the methodologies, techniques and available data for conducting a regional hydrokinetic power assessment as well as a selection of proposed methodologies and validation datasets and locations.
Phase II Methodology Validation – the implementation of a recommended set of methodologies against the validation datasets including sensitivity/uncertainty analysis.
Phase III Assessment Determination – the application of the recommended methodologies to conduct a nation-wide assessment on the hydrokinetic potential for theoretical energy extraction.
The National Research Council – Canadian Hydraulics Centre (NRC-CHC) was asked to contribute the first two phases of this project. This report constitutes the findings of Phase I. Section 1 provides an introduction and outlines the goals and structure of this study of hydrokinetic potential, of which this document is a part. The project goals are to ultimately characterize and quantify the hydrokinetic power potential in Canada. Section 2 of this report identifies the need to estimate a number of hydrologic and physical characteristics at ungauged channel reaches to provide an estimate of hydrokinetic energy potential:
• Flow characteristics as flow duration curves (FDCs)
• Channel geometry
• Channel slope; and
• Channel roughness.
Section 3 presents the findings from a literature review investigating methodologies for regional estimation of flow, geometry slope and roughness characteristics in ungauged basins. The investigation identified many techniques for flow regionalization but primarily for extreme value estimations. The use of regionalization techniques for FDC estimation, as required for this study, was much less common but some studies existed and a few studies have been recently published with applications in Canada.
The investigation discovered few studies employing channel geometry estimation techniques at a regional scale. Most of the studies related geometry predictions to a channel-forming discharge, which is not a desirable technique for this study with flows being one of the estimated variables. Other more promising approaches were identified which relate channel geometries to physiographic watershed characteristics or digital maps that include channel widths for larger rivers. The regional estimation of slope showed a predominance of digital elevation model (DEM) use in the studies investigated, although limitations and cautions in their
use for channel slope estimation were identified by many. Some of the limitations of DEMs, including precision issues in low-relief basins, were shown to be surmountable through the use of fitted equations relating channel slope to watershed drainage area. No appropriate regionalization techniques for the estimation of river channel roughness were identified.
In addition to regional estimation techniques for flow and channel characteristics in ungauged basins, uncertainty and error propagation techniques were investigated.
Section 4 presents the results of a data source review and resource investigation. The section identifies a number of national databases that can be employed to act as inputs and validation datasets for the regionalization routines employed in this study. The data sets include measured or calculated properties at a national scale including regional climate data, hydrometric data, digital soil and land use maps, hydro network maps and digital elevation data. Of particular utility is the Water Survey of Canada measurement database, which includes at-site measurements of velocities and cross sections for thousands of water survey hydrometric stations across Canada. This particular database is seen as invaluable in the validation of the various flow and channel geometry regionalization techniques. No databases were discovered that included information that could be used for roughness or slope validation.
Section 5 presents the findings of an investigation of previous hydrokinetic and small hydropower resource assessment studies conducted at a regional or national scale. Many studies were discovered that assessed hydropower resources, usually requiring an average annual flow and an estimated penstock height, and not requiring geometry, slope or roughness estimates. Fewer studies have investigated regional hydrokinetic energy potential, and none at the scale or as inclusive as suggested in this study. Methodology validation of regionalization techniques was rarely performed in the studies examined.
Sections 6 and 7 outline the recommended approach for Phase II and the associated tasks, respectively. It is recommended that a number of flow regionalization techniques be employed and validated in this study including some conceptually simple methods (e.g. Area-Ratio), commonly employed and endorsed methods (e.g. RETScreen) and methods recently developed and employed by the academic community (e.g. CCA with graphical FDC). The recommended approaches for geometry estimation include the use of digital maps of river edges where available, and the use of physiographic and climactic data to drive regression analysis. Channel slope estimation is recommended to be estimated using available DEM data with the investigation of functional smoothing in low-gradient channels. Finally, lacking any regional data or regionalization techniques, roughness is to be estimated as a potential range of values based on published roughness estimates. Validation and uncertainty estimates are to be employed using jack-knife and bootstrap techniques where applicable.
LIST OF ACRONYMS
AAFC Agriculture and Agri-food Canada AFDC Annualized Flow Duration Curve
CanSIS Canadian Soil Information System – Agriculture and Agri-Food Canada CCA Canonical Correlation Analysis
DEM Digital Elevation Model DFO Fisheries and Oceans Canada
DHR Determination of Homogeneous Regions EC Environment Canada
FDC Flow Duration Curve
GIS Geographic Information System GML Geography Mark-up Language
HYDAT Hydrometric Database – Environment Canada, Water Survey of Canada MAD Mean Annual Discharge
MAF Mean Annual Flow
MAP Mean Annual Precipitation MAR Mean Annual Runoff MAT Mean Annual Temperature NASA North American Space Agency NHN National Hydro Network
NIMBY “Not in my back yard”; an expression of opposition by citizens to local public works or civic projects
NRCan Natural Resources Canada
NRC-CHC National Research Council – Canadian Hydraulics Centre PET Potential Evapotranspiration
PMF Probable Maximum Flood
RBLI Regression Based Logarithmic Interpolation
REEEP Renewable Energy and Energy Efficiency Partnership REM Regional Estimation Methods
RETScreen Renewable-energy and Energy-efficient Technologies Screening tool – Natural Resources Canada
RHAM Rapid Hydropower Assessment Model RMSE Root Mean Square Error
ROI Region of Influence regionalization approach. RPM Rotations Per Minute
SLC Soil Landscapes of Canada TSM Taylor Series Method
UNEP United Nations Environment Programme
UPGMA Unweighted Pair Group Method with Arithmetic mean US-DOE United States Department of Energy
USGS United States Geological Survey VDC Velocity Duration Curve
ACKNOWLEDGEMENTS
NRC-CHC would like to acknowledge the contributions of the staff of Environment Canada – Water Survey of Canada who provided valuable input at all stages in this stage of the research and important data source contributions in Section 4. The staff at NRCan also provided valuable insight into the state of the art of hydrokinetic turbine technology and excellent suggestions on improving this document.
NRC-CHC would also like to thank the external reviewers who contributed variously to the final report: Chris Spence (Environment Canada), Robert Metcalfe (Ontario MNR), Taha Ouarda (INRS), Dave Harvey (Environment Canada)
TABLE OF CONTENTS
Executive Summary ... ii
List of Acronyms ... iv
Acknowledgements ... v
Table of Contents... vi
List of Tables ... vii
List of Figures ... vii
1 Introduction ... 1
2 Background ... 3
2.1 Nomenclature ... 3
2.2 Resource Assessment Levels ... 5
2.3 Hydrokinetic Power ... 6
2.4 Hydrokinetic Turbines ... 8
2.5 Hydrological Considerations ... 9
2.6 Hydraulic Considerations ... 10
2.7 Study Scope ... 12
3 Hydrologic and Hydraulic Regionalization Techniques ... 13
3.1 Estimation of Flow Duration Curves at Ungauged Basins ... 13
3.2 Regional Estimation Methods... 14
3.3 Determination of Homogeneous Regions ... 17
3.4 Notable FDC Transposition Studies ... 21
3.5 Channel Geometry Estimation ... 21
3.6 Channel Slope Estimation... 25
3.7 Roughness Estimation ... 25
3.8 Uncertainty Estimation ... 26
4 Data and Resource Review ... 30
4.1 National Hydro Network (NHN) ... 30
4.2 HYDAT ... 30
4.3 Canada Water Survey Measurement Database ... 31
4.4 Canadian Digital Elevation Data ... 31
4.5 Physiographic Datasets ... 31
4.6 Canadian Climate Data ... 32
4.7 RETScreen ... 32
4.8 GreenKenueTM ... 33
5 Previous Hydrokinetic and Hydropower Resource Assessment Studies ... 34
5.1 Hydrokinetic Energy Assessment Studies ... 34
5.2 Hydropower Assessment Studies ... 37
6 Recommended Approach ... 45
6.1 Flow Duration Curve Estimation at Ungauged Basins ... 46
6.2 Slope Estimation ... 47
6.4 Roughness Estimation ... 48
6.5 Hydrokinetic Energy Calculation ... 48
6.6 Uncertainty Considerations ... 48
6.7 Cross-sectional Velocity Distribution Considerations... 49
7 Proposed Phase II Tasks ... 50
7.1 Study Region Selection... 50
7.2 Dataset Preparation ... 50
7.3 FDC Estimation and Validation... 52
7.4 Channel Geometry Estimation and Validation ... 52
7.5 Channel Roughness and Slope Estimation ... 53
7.6 Channel Velocity and Hydrokinetic Energy Validation ... 53
7.7 Uncertainty Calculations ... 53
7.8 Reporting of Results ... 54
8 Summary ... 55
9 References ... 56
LIST OF TABLES
Table 1 - Hydropower Classification by Power Generation ... 3Table 2 – Hydrokinetic and Hydropower Resource Assessment Studies ... 44
LIST OF FIGURES
Figure 1 - Run-of-river Hydro project employing a penstock [107] ... 4Figure 2 - Kinetic Energy Turbine (verdantpower.com) ... 5
Figure 3 - Velocity Contours in an Irregular Channel [2] ... 7
Figure 4 - Turbine Classifications [50] ... 9
Figure 5 - Typical Flow Duration Curve (FDC) identifying firm flow at Q90 [67] ... 10
Figure 6 - Flow, Velocity and Hydrokinetic Power Distribution Curves - WSC Station 02BF009 ... 12
Figure 7 - Variability in Channel Geometry Coefficients [77] ... 23
Figure 8 - Environment Canada Data Explorer (ECDE) ... 31
Figure 9 - UMA Group - River Energy Flux [97] ... 35
Figure 10 - Stream kinetic energy assessment in the GreenKenueTM platform [71] ... 37
Figure 11 - Flow Duration Curve to Turbinable Flow Curve Conversion [2] ... 38
Figure 12 - Drainage Area Adjustment of FDCs [96] ... 40
Figure 13 - RETScreen - Flow Duration Curve Map [67] ... 41
1 INTRODUCTION
There is significant interest in hydrokinetic or in-stream river potential in Canada and internationally for power production using ‘zero head’ turbines, which require no dams or barrages. Canada has a vast network of rivers that have been harnessed for over 100 years to generate electricity from hydropower. These rivers also likely contain significant potential for power production from hydrokinetic resources.
Currently, the market potential for this technology in Canada is unknown. A number of Canadian companies invested in hydrokinetic technologies have attempted to quantify the Canadian potential, but estimates vary widely. Internationally, few studies have been conducted to assess the potential within individual countries with little effort invested in developing adequate methodologies specific to this type of assessment.
Natural Resources Canada (NRCan) has identified a need to assess Canada’s hydrokinetic potential as a national renewable resource. The challenge is to determine an accurate method of assessment of the hydrokinetic potential of river reaches at a regional scale (104 km2 to 107 km2) using hydrometric and physiographic datasets currently available.
This fundamental research provides support to developing the hydrokinetic market in Canada. Assessment of resource potential has long-term benefits of building non-commercial knowledge to support both government and industry and assists in the development of hydrokinetic current resources. For industry, knowledge of the potential, and where it is located, are key pieces of information for early market entry by technology and site developers. Government requires this information for policy and decision-making. It will also benefit remote regions where decentralized power production from renewable energy sources is an economically viable option in offsetting the high cost of diesel power production.
The study has been divided into three phases:
Phase I Methodology Review and Data Review – a review of the methodologies, techniques and available data for conducting a regional hydrokinetic power assessment as well as a selection of proposed methodologies and validation datasets and locations.
Phase II Methodology Validation – the implementation of a recommended set of methodologies against the validation datasets including sensitivity/uncertainty analysis.
Phase III Assessment Determination – the application of the recommended methodologies to conduct a nation-wide assessment on the hydrokinetic potential for theoretical energy extraction.
The final reports of all three phases will be made available to stakeholders in the industry and the general public via website access. The primary deliverable following Phase III will include a comprehensive national assessment of hydrokinetic potential.
This report addresses Phase I of the study. The main objectives of this phase are to:
1. Review the literature to determine the state of the art in methodologies applicable for hydrokinetic resource assessment at the regional scale;
2. Review the available data for use in estimating hydrokinetic resource potential at a regional scale and the data available for methodology validation; and
3. Recommend a short list of applicable methodologies, validation datasets and locations for Phase II.
The report provides a review of available technologies research and data available to conduct the nation-wide assessment:
a) Flow Estimation Techniques – examine other possible techniques relating to flow in ungauged basins, and transposition of flow duration curves (FDCs).
b) Channel Geometry and Slope Estimation Techniques – review of available techniques applicable to a regional study.
c) Data Uncertainty and Uncertainty Analysis Techniques – examine data uncertainty and uncertainty analysis methodologies in using DEM data, flow records, roughness estimations, channel geometries etc., applicable to a regional analysis, and considering the quantity and character of data to be employed in Phase III
d) Regional Channel Current Estimation Studies – investigation of other studies that have attempted to estimate channel currents at a regional scale or techniques that have been developed that could be used to this effect.
2 BACKGROUND
This section provides background and contextual information on hydrokinetic power nomenclature, hydrokinetic power, sometimes termed “river current,” in relation to other types of hydroelectric energy extraction, such as small-scale hydro, and general hydraulic and hydrologic considerations relating to hydrokinetic power assessment.
2.1 Nomenclature
Although not a young science, hydrokinetic power and small-scale hydropower both have an imprecise and varied nomenclature, with similar project types often characterized by different names or descriptors. This section will attempt to briefly summarise the types of classification that will serve as a touchstone throughout this document.
2.1.1 Small Hydro Systems
Hydropower projects are often classified by their power generation potential although there is no universally accepted approach for classifying these systems. The following classifications of hydropower by size have been employed by NRCan [73]:
Table 1 - Hydropower Classification by Power Generation Classification Size in kW
Large >50,000
Small 1,000-50,000
Mini 100-1,000
Micro <100
Although other published classifications vary slightly from this definition [66, 96, 101] this list remains a useful delineation of the various hydropower project types. It is important to know that the classification type relates to the power generation capacity of the project. For instance, some “small hydro” projects require large turbines if they have a low-head and large volumes of water to operate [66].
Projects can also be defined by the degree of hydraulic head required for operation. Low head hydro has been defined as less than about 15 m with normal or “high head” hydro operations generally having hydraulic head greater than this value [39].
Further to the power generation and the hydraulic head requirements, the way in which the deployments control the flow of water in a river can be used to define the project type. Run-of-river systems refer to hydro projects that do not significantly alter the natural elevation of the water in the river system and the hydraulic head in these systems will fluctuate with changes in the stream flow [66]. Often run-of-river hydro projects will employ a penstock to gain hydraulic head by keeping diverted water at a high elevation and then capturing the potential energy further downstream. Figure 1 illustrates a run-of-river hydropower configuration with a penstock [107].
Figure 1 - Run-of-river Hydro project employing a penstock [107] 2.1.2 Hydrokinetic Systems
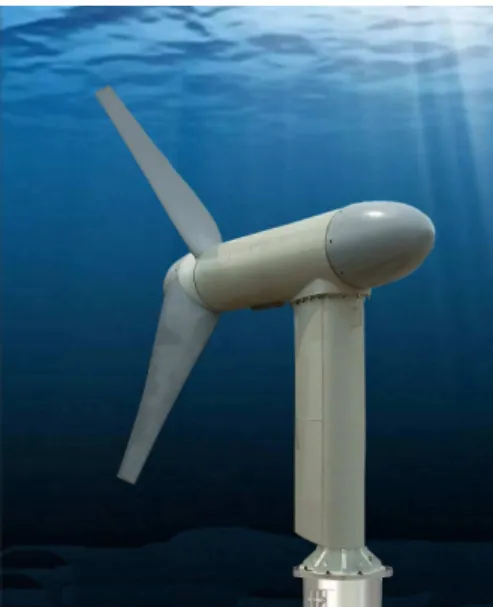
Hydrokinetic systems convert kinetic energy from flowing water into electricity, or other forms of energy [103]. The resource assessment being conducted in this study is designed to characterize and quantify the energy resource specifically for hydrokinetic systems. There are a number of characteristics that make hydrokinetic energy systems distinct from other hydropower systems [50, 103] in that they:
• Rely on existing kinetic energy in the water stream;
• Do not rely on artificial water-head from impoundments, or barrages;
• Do not require large civil works for implementation; and
• May operate in the water stream’s natural pathway and do not require a stream flow diversion.
Figure 2 - Kinetic Energy Turbine (verdantpower.com)
Hydrokinetic systems offer a number of advantages over run-of-river and water storage options, particularly with regards to environmental impact and capital cost. For example, civil works required for the development of run-of-river and water storage hydropower often represent the most significant portion of the project development and can often render a project financially unviable [66]. Works not requiring a barrage or similar have a much lower capital cost. However, the efficiencies and power production capacity of hydrokinetic turbines is also lower than run-of-river or water storage hydropower. Hydrokinetic turbines have other ancillary advantages. They may be deployed on an incremental basis, as a single unit or in a clustered configuration. Additionally they remain below the water surface and not as predisposed to NIMBY issues, and have a lower RPM and fewer noise and vibration issues than conventional turbines.
2.2 Resource Assessment Levels
When considering this study it is important to reflect on the degree of investigation that is involved. When considering a location for hydropower or water resource assessment one can divide the developmental into five basic stages [66, 96]:
1. pre-reconnaissance, 2. reconnaissance, 3. pre- feasibility, 4. feasibility, and 5. final design.
The primary difference among them is the degree of confidence one has in the results obtained. The first level, pre-reconnaissance, can be considered a low confidence analysis, but also a low cost and low effort analysis for the results obtained. It involves desk studies, map analysis, drainage area delineation, and is used for narrowing down sites for investigation. Reconnaissance involves site visits, assessments and rankings. The pre-feasibility and
feasibility stages involve study investigation of selected sites and then detailed physical studies of the selected site. The final design stage is a very high confidence analysis suitable for ultimate deployment and requires a much greater effort and time commitment to obtain the required confidence sought in a design.
This study is designed to quantify the national potential and assist in the pre-reconnaissance stage or screening stage of assessing water resources for hydrokinetic power potential. This study will assist in the identification or screening of promising locations for hydrokinetic power extraction and help focus further efforts of reconnaissance and feasibility level analysis on areas with a high resource potential.
2.3 Hydrokinetic Power
2.3.1 Instantaneous Hydrokinetic Power
The kinetic energy of a flowing fluid can be determined from the density of the fluid, the velocity at which the fluid travels and the cross sectional area at which the energy will be extracted. 3 2 AV PK ρ = (1)
Where PK is the available kinetic power; ρ is the fluid density; A is the cross sectional area of
extraction and; V is the flow velocity. Hydrokinetic power is often reported as a power density which is the power normalized to a unit area.
3
2V
A
PK = ρ (2)
When considering flows in rivers, one can make the reasonable assumption that the density remains essentially constant, even with changes in temperature. The velocity and area remain the only variables required to determine the kinetic power. Consequently the determination of the velocity in a river, specifically the time averaged velocity frequency distribution, is the essential and the primary factor in assessing the available kinetic energy available in a river. The calculation of the kinetic power depends of the cross section area which is either the river cross-sectional area for an assessment of the total energy in the river, or the area of the device that will be used to extract the kinetic energy. For the purposes of this study and to generalize the power potential over such a large land mass, the river cross sectional area will be used.
2.3.2 Time-averaged Hydrokinetic Energy
In fact, the velocity in a river is rarely constant and will be expected to vary significantly on a daily or monthly basis. Determining the average energy at a location requires the integration of the kinetic energy over a period of time. Assuming the velocity will change with time but the area for extraction is unchanged then the following equation applies.
∫
∫
∫
∫
= = dt dt t V A dt dt t P PK K 3 )) ( ( 2 ) ( ρ (3)If one is interested in the entire average kinetic energy available in a river then the area will also change with time, as the flow changes.
∫
∫
∫
∫
= = dt dt t V t A dt dt t P PK K 3 )) ( )( ( 2 ) ( ρ (4)Consequently, the total energy available at a river cross section is also strongly influenced by the velocity and the temporal flow variability plays a significant role when assessing the total available energy.
2.3.3 Representative Flow Velocity
The above equations represent the energy with an average flow velocity across the cross-sectional area of interest, that being the entire river cross-cross-sectional area or the cross-cross-sectional area of the turbine device. In fact the velocity may vary within the cross-sectional area itself. This is particularly the case in natural channels if the turbine cross-sectional area is not small compared to the sectional area of the channel, or if the area considered is the entire cross-sectional area of the channel.
Velocity within a channel at a given cross section will vary substantial both in the vertical and the horizontal directions. Figure 3 illustrates the type of variability that may exist, with zero velocities at the bank edges and maximum velocities near the top of the water column and near the thalweg of the channel (although flow conditions and approach geometry will impact the velocity distributions substantially).
Figure 3 - Velocity Contours in an Irregular Channel [2]
Velocity profiles along the vertical axis are generally required for any type of hydrokinetic device. As power is a function of the velocity cubed, it is necessary to have a complete vertical velocity profile and knowledge of where the device is anchored.
In this study, the total hydrokinetic energy in the stream will be assessed using the predicted average flow velocity across the river cross section. Average velocity of a cross section does not
represent the average kinetic energy flux across a cross section, as the relationship between velocity and power is non-linear. The power available will likely be some value greater than that calculated with the average velocity, depending on the nature of the velocity distribution. While the spatial velocity variability across a river cross section is expected to have an impact on hydrokinetic energy assessment, the complexities associated with predicting that variability at a regional scale across Canada, preclude its consideration in this phase of the study. As this upcoming phase of the study involves the validation of regionalization techniques, it will be sufficient to evaluate the techniques based on their ability to predict flow and average velocity. For the final phase of this study, involving a quantification of the hydrokinetic energy resources, investigations will be made into the impact of velocity distribution across a river cross section in terms of total hydrokinetic energy assessment and quantification.
2.3.4 Integration of Power Potential Over River Length
The evaluation of the available hydrokinetic energy at a cross section within a flowing channel is evaluated by integrating the power over the cross sectional area. To asses the hydrokinetic power potential along a river requires the longitudinal integration of the available hydrokinetic power over the entire length of the river. Integration of this type will require assumptions as to energy extraction by installed turbines, and estimates for the allowable spacing between installed turbines along a river length. Phase II of this study will not attempt to integrate power potential longitudinally as part of the final deliverable. However, Phase III may require the integration of the power potential along the river length. As part of Phase II, techniques for determining longitudinal integration of power potential will be proposed, if not evaluated.
2.4 Hydrokinetic Turbines
Hydrokinetic turbines are designed to extract the kinetic energy of flowing water, driving a generator to produce electricity. Hydrokinetic turbine systems differ from other “run-of-river” or “small hydro” turbine systems in that they are virtually zero-head turbines and are not constrained in a confined, pressurized flow environment. Small hydro turbines, by contrast, tend to be confined in a penstock or other conduit that conveys pressurized water from an elevated hydraulic head through a turbine. As a consequence of the confined flow and the associated turbine designs, the efficiency of small hydro turbines can be very high, approaching 90%.
Turbines that operate in open channels harvesting the kinetic energy of the water with no pressurized flow are hydrokinetic turbines. The nomenclature for this type of turbine is varied, with this turbine type being sometimes called a “water current turbine”, “free flow turbine”, “stream turbine” or “zero-head turbine” [50]. In all cases these describe turbines which:
a) Extract only kinetic energy from the flowing water
b) Operate in an unconfined, open channel environment and do not require a hydraulic head differential; and
c) Do not require a dam or barrage for operation.
Most hydrokinetic turbine designs can take a number of forms, but most are of the vertical or horizontal axis variety. Each has its own engineering and performance advantages, but all operate on the same principle of kinetic energy extraction. The turbines can be anchored in a
number of ways either as bottom mounted, line-anchored or from the surface using a flotation device [103]. Figure 4 illustrates the various types of hydrokinetic turbines, in the three major groups: horizontal axis, vertical axis and cross-flow turbines.
Figure 4 - Turbine Classifications [50]
Hydrokinetic turbines operate at much lower energy extraction efficiency than their pressurized counterparts. Betz derived a theoretical efficiency limit of 59.3% for propeller type turbines in free flow. In practice water current turbines operate with efficiencies between 16% and 42%, depending on the turbine type, make and hydraulic conditions [30, 36]. For turbine energy extraction the calculation must consider the efficiency of the turbine
3
2 AV
PK =ηρ S (5)
where η is the efficiency of the turbine and AS is the swept rotor area of the turbine. In fact,
turbine efficiency is not a constant and will vary with device design and flow conditions [36].
3 2 ) (V AV PK S ρ η = (6)
Considering the Betz limit on turbine rotor efficiency the maximum power extractable from a turbine is 3 2 593 . 0 AV PK−Max = ρ S (7)
where PK-Max is the theoretical maximum power extractable from a turbine as per the Betz limit
(η = 0.593).
2.5 Hydrological Considerations
Hydrologic conditions upstream of a given location play a critical role in determining the available kinetic energy at that location. The meteorological inputs, climactic conditions as well as the hydrological characteristics of a watershed determine the flow in a river, and these flow rates, when constrained by channel geometries, slope and roughness, dictate the flow velocities in the channels.
Specific flow time-series are not required for the assessment of a long-term hydrokinetic power potential at a location. However, the frequency with which a specific flow rate is expected to be observed at a location is important. That is to say, an accurate description of the expected flow frequency would provide enough information to quantify the river power potential at a given site. In hydrological terms, the flow duration curve (FDC) is typically employed to describe the flow frequency at a location and provide a graphical representation of stream flow variability [55, 83]. Figure 5 illustrates a typical flow duration curve.
Figure 5 - Typical Flow Duration Curve (FDC) identifying firm flow at Q90 [67]
Other hydrological considerations are important when considering kinetic energy extraction, particularly regarding probable maximum floods (PMFs) and the design limits of the turbines themselves. The employment of these techniques will have little impact or utility in calculating the time-averaged kinetic energy available at a site. Although very large, PMF values are inherently infrequent and will not contribute meaningfully to energy calculations, but could have an influence on turbine design and deployment considerations.
The estimation of the flow duration curve at a location can be conducted by a number of means including transposition from other locations, empirical or regression methods, and hydrologic modelling. These techniques are further discussed in Sections 3.2 and 3.3.
2.6 Hydraulic Considerations
Hydraulic characteristics of a site must be considered when transforming the hydrologic flow data to velocity data. The channel velocity can be estimated a number of ways, the most common being the use of a hydraulic open-channel flow equation such at the Manning equation.
2 / 1 3 / 2 1 S R n V = (8)
The Manning equation and equations like it relate the average flow velocity V, to a hydraulic radius R, with a known roughness n, and water surface slope S for uniform flow conditions. Consider the continuity equation
VA
Q= (9)
which relates flow rate Q to the average velocity V and the cross sectional area A. The area and the hydraulic radius, which is the channel area divided by the wetted perimeter, are dictated by the channel geometry and the depth of flow. If the geometry is known and the water depth is known then both A and R are also known:
) (D f A= (10) ) (D g R= (11)
where D is the flow depth and f and g are function describing the relationship between flow depth D, and A and R respectively. This provides a system of four equations and four unknowns, which can be solved to provide the flow velocity and cross sectional area, both important in determining the total kinetic energy in a river system.
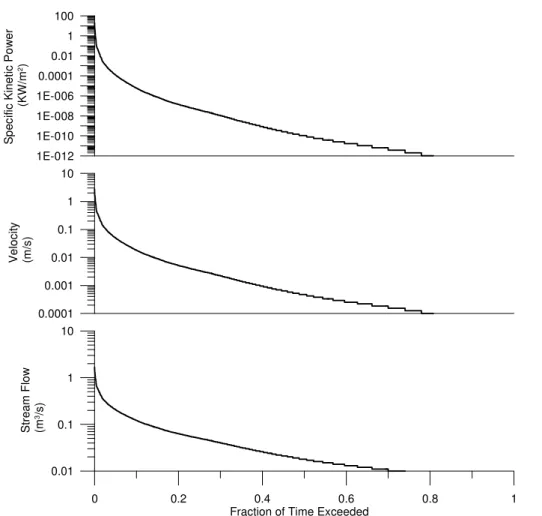
With the average velocity known, the hydrokinetic power can be determined. Figure 6 shows the flow duration curve alongside a velocity duration curve (VDC) and power duration curve (PDC) for a sample Water Survey of Canada gauge (02BF009) from a small drainage basin. This figure illustrates the relationship among the flow, the velocity and the kinetic power frequencies. The exponential relationship among the three characteristics adds weight to the higher flows, with most of the total power available in a stream presenting itself during the highest of flows. In this particular case nearly all of the available energy in the river occurs within only 2% of the time. This highlights the need for accurate estimation of flow velocities over the complete range of return frequencies especially considering that design requirements may be tied to a frequency of exceedence of a particular flow velocity.
0 0.2 0.4 0.6 0.8 1 Fraction of Time Exceeded
0.01 0.1 1 10 S tr e a m F lo w (m 3/s ) 0.0001 0.001 0.01 0.1 1 10 V e lo c ity (m /s ) 1E-012 1E-010 1E-008 1E-006 0.0001 0.01 1 100 S p e c ifi c K in e ti c P o w e r (K W /m 2)
Figure 6 - Flow, Velocity and Hydrokinetic Power Distribution Curves - WSC Station 02BF009
The total time averaged energy available is an integration of the power as represented by the area under the specific kinetic power duration curve.
2.7 Study Scope
The scope of this study has the following limitations:
1. The objective of this study is to provide national/regional level hydrokinetic power potential estimates. It is not intended for site-specific assessment.
2. The study will examine technique to predict flows in unregulated rivers. Predicting the flows in regulated rivers will not be attempted or considered.
3. Impacts of river ice, ice jams or ice cover will not be explicitly considered in this study. 4. This study will consider only average flow velocities within a river cross section and will
not consider the impacts of irregular velocity distributions in terms of hydrokinetic power assessment.
5. The study has precluded the use of hydrological models in the estimation of flow at ungauged locations. Although potentially a useful approach for this study the necessity to reduce the scope to a computationally and resource efficient techniques has excluded the use of hydrological models at this time.
3 HYDROLOGIC AND HYDRAULIC REGIONALIZATION
TECHNIQUES
This section provides a review of published scientific literature that was found to relate to one of the following fields of research:
1. Estimation of Flow Duration Curves at Ungauged Basins; 2. Regional Channel Geometry Estimation;
3. Regional Slope Estimation;
4. Regional Roughness Estimation; and
5. Uncertainty Estimation and Error Propagation Techniques.
Recommendations for this study based on the literature reviewed in this section are presented subsequently in Section 6.
3.1 Estimation of Flow Duration Curves at Ungauged Basins
One of the challenges in determining the river power potential at a regional or national scale occurs in making a reasonable estimation of the flow conditions at all channel reaches. Considering the quantity of data to be processed for a national hydrokinetic energy assessment, the flow estimates need to be acquired in an efficient way with a minimal manual effort. This sub-section examines some of the techniques employed in flow estimation at ungauged sites with special attention paid to Canadian studies and studies that examine FDC regionalization. Some published studies were found to be particularly noteworthy in terms of the analysis flow duration curves and their use in water resources. Vogel and Fennessey [105] provide an excellent review of the development of the FDC, techniques for development and interpretation as well as common applications in water resources [104]. Vogel and Fennessey [105] also examined the utility of the flow duration curve and suggested an annualized interpretation of the FDC to characterize the flow duration for a typical year in what they called the annualized flow duration curves (AFDC). AFDC represents the median hypothetical year not affected by observation of abnormally wet or dry periods. This interpretation allows for the development of confidence intervals around a median flow duration curve based on the distribution around the period of record. The AFDCs are less sensitive to the record length than are the period-of-record FDCs. It should also be emphasized that FDCs are generally more resilient and insensitive to outlying extreme events, as their impact on the shape of the FDC is typically minor and limited to extreme percentiles. Still, changes in climate could alter the shape of an FDC. House [43] authored a literature review for the Ontario Ministry of Natural Resources, Waterpower project. In it the author examined a number of topics relating to hydropower and the ecological impacts associated with it. The review included topics such as water level fluctuations in reservoirs, ecological effects of hydropeaking. Also reviewed were advances in regional flow estimation techniques, although the emphasis was not specifically related to FDC regionalization. As part of a review of contaminant transport estimation techniques for Environment Canada, Durand et al. [26] examined a number of flow transposition techniques, but they were largely restricted to area ratio method techniques (see Section 3.2). Bobee et al. [8, 9] conducted a review of regional flood frequency methods and performed a detailed intercomparison of a number of methods of delineation of homogenous regions and regional estimation methods using data from Quebec and Ontario.
When estimating flow at ungauged basins there are two primary considerations:
1. The nature of the flow characteristics that need to be known at the target locations, e.g. maximum annual flood, flow duration curve, low flow values. 2. The technique employed in regionalizing the flow characteristics from locations
with data, to locations without data.
This second consideration, the regionalization technique can be considered as two separate sub-techniques [8]:
1. The determination of homogenous regions (DHR), which classifies or groups similar source data sites, and
2. The regional estimation method (REM) which transfers the data from the source data sites to the target ungauged sites.
3.2 Regional Estimation Methods
This section reviews a number of techniques from the literature that have shown some connection or promise with regard to FDC estimation in ungauged basins. Castellarin et al. suggested FDC transposition to ungauged basins can be conducted in one of three ways [15].
1. By determining a statistical function and then determining estimates of the shape parameters through regressive means.
2. By parametric means, by which a number of parametric equations are used to describe the shape of the FDC and the parameters are regionalized by some regression function, or
3. By graphical methods, which do not employ fitting a curve to the FDC.
Although not all techniques fit neatly into these three categories it is a useful way to segment the various approaches. In all cases, regardless of classification made by Castellarin et al., assumptions are made about the FDC shape or how the shape is to be captured mathematically and then parameters that describe the shape are regionalized to allow for FDC prediction at an ungauged location.
The remainder of this section summarizes some of the more commonly employed regional estimation methods.
3.2.1 Index flood method
The index flood method was one of the first regional flood frequency assessment methods, originally proposed by Dalrymple [23]. The principle is that the flood frequency curves in a homogenous hydrologic region are identical, varying only by a scale factor that can be described by watershed characteristics. It requires first the identification of homogenous regions and then determining a standardized (or normalized) flood frequency curve. The original method proposed the delineation of physical geographic regions and the employment of the Gumbel distribution. ) ( ) (T Q* T Qk =µk (12)
where Q* is the normalized flood frequency curve as a function of return frequency T, k is the
scale factor and Qk is the flow duration curve at the target basin. Several studies employed an
Consulting [2] employed the index flood method and the FDC was normalized to the 2-year return flow, which needed to be predicted in the target basin. The technique employed by the RETScreen [66, 67] application employs a variation of this approach. In this application a representative FDC was determined for a region normalized to the mean annual flow. The mean annual flow is then estimated at the target basin by employing a published specific runoff map and calculating the drainage area of the basin.
A number of techniques for using the index flood method and FDCs have been considered. Shmakhtin [91] employed the method using FDC curves from gauges closest to the ungauged site within a homogenous region. Other approaches have used a number of curves are averaged to determine a combined representative curve for a region as described in Smakhtin and Masse [89]. In both cases are normalized to the mean annual flow, or some other flow metric, and expanded based on an estimated mean annual flow (MAF) at the site of interest. That is often done by determining a mean annual flow in a region normalized to drainage area and then multiplying by the calculated drainage area at the ungauged location.
3.2.2 Drainage Area Ratio Methods
One of the simplest methods employed to estimate flow in ungauged basins is a drainage area ratio method. This method scales the discharge from a known location to an unknown location by a ratio of the drainage areas. The drainage are ratio method would likely be classed as a “graphical” method based on the categorization by Castellarin et al. [15] because no underlying representative function is prescribed that describes the FDC. In principle the drainage area ratio method is very similar to the index flood method, with the index being a drainage area ratio value rather than a flood index value.
The general area ratio equation is
m g u g u A A Q Q = (13)
where Qu and Qg are the ungauged and gauged flow rates, respectively and Au and Ag are the
ungauged and gauged upstream drainage areas, respectively and m is a calibration factor to account for the non-linearity of the relationship. The exponential parameter m requires calibration, but is often left as unity for simplicity or from lack of calibration data [72, 84]. A complete FDC curve could be generated at an ungauged site using this method by translating a percentile flow on the source FDC to a target FDC using the above equation. Caution is generally warranted when using the drainage area ratio methods as the relationship between runoff and drainage area is affected by a number of factors, drainage area being merely one, and the strength of the relationship drops off quickly as the drainage area ratio diverges significantly from unity [19, 56]. The Sauer Weighting function method is a variation of the drainage area ratio method that uses a combination of drainage area ratios and the predicted flow rates determined from USGS state regression equations for streamflow. Drainage area differences of more than 25 - 50% have been considered limits of applicability for this method by some authors [26, 56]. A number of FDC transposition studies have employed this method [61, 63, 71].
Mohamoud and Parman [61] also employed modified drainage area ratio methods in a study of the US Mid-Atlantic region
= g u g u A A Q Q tan (14) = g u g u A A Q Q arctan (15) 3.2.3 Parametric FDC Characterization
When parametric methods are used to predict the regional FDCs at ungauged sites the FDC is assumed to be represented by analytical equations. These equations could be polynomial or exponential equations, the parameters of which are estimated through regional analysis. One of the first FDC regionalization and transposition studies was conducted by Quimpo [79]. In this study, conducted in the Philippines, regionalization of FDCs was conducted by presenting each FDC as an exponential function of the following form:
cD ae Q
Q= − (16)
where D is the percent of time a flow Q will be exceeded, Qa and c being calibrated positive
parameters. A power equation was also considered, but the natural logarithm decay equation was found to match the observed data better. Stations were selected that had 8 to 21 years of data and point values for Qa and c for each gauge were determined. The values of c, which
controlled the slope or shape of the FDC were regionalized and a contour map of the values for
c was developed for the region. The Qa values were scaled based on the drainage area of the
ungauged basin using the equation
m
a pA
Q = − (17)
where A is the drainage area and p and m are positive constants. A curve was developed using available data for all drainage areas in excess of 100 km2, as smaller basins showed a high degree of variability.
Franchini and Suppo [34] proposed a parametric technique for estimating the flow duration curve by fitting a curve to three quantiles of the FDC. The authors proposed two possible equations for describing the lower portion of the flow duration curve
b a D c Q / 1 1 − = (18) ) (a bD e c Q= + + (19)
where D is the frequency of exceedence and Q is the corresponding flow rate. Parameters a, b, and c are calibrated using ordinary least squares methods to points on the FDC. The authors provide a number of regional regression models to estimate the quantile information as a function of watershed characteristics. Interestingly, this method regionalizes flow quantile values rather than parameters based on watershed characteristics. Castellarin et al. [15]
expanded on this method to employ four percentiles in stead of three and found it improved FDC representation.
3.2.4 Statistical FDC Characterization
Statistical FDC Transposition involves characterizing the source FDC curve as a probability distribution. This is not strictly appropriate, as the auto-correlation inherent in the data used to generate an FDC precludes the data themselves from being described as a pure probability distribution. However the shape of the distribution can be representative and transposition of a properly calibrated distribution can produce meaningful results at ungauged stations.
Leboutillier [52] conducted a flow regionalization study in British Columbia by fitting a two-component, two-parameter lognormal mixture distribution to the flow duration curve data. This distribution is a weighted combination of two lognormal distributions each with a position and shape parameter. The result is a 5 parameter fit for each flow duration curve.
The values of each of the parameters were clustered into 7 regional clusters using a two-stage density linkage cluster analysis technique. The generated clusters showed distinct contiguous regions within the province of BC. The average parameter values were then determined and representative flow duration curves were generated for each of the prescribed cluster regions. The predictive capabilities of the generated FDC curves were not investigated.
3.2.5 Graphical FDC Characterization
Castellarin et al. [15] characterized the technique developed by Smakhtin [91] as being a “graphical” FDC transposition method. In this method FDCs at gauge sites were normalized or standardized to a prescribed index flow and a regional FDC was determined by averaging percentiles of the FDC within the a region. The index flow values at the ungauged sites were estimated using a linear regression technique. Shu and Ouarda [84] concluded that the distinctive characteristic of this technique was that the method made no assumptions about the shape of the FDC, it being derived entirely from the observed site FDCs. This has inherent advantages if the entire FDC is required, or a region of the FDC is required that is not easily or consistently represented by a statistical or other analytical function
Mohamoud [60] employed a percentile flow prediction using step-wise regression by grouping 15 percentile flows into low, median, and high ranges, with five percentile flows in each, and determining unique predictors for each range. The source site selection was based on grouping by pre-defined landscape classifications.
Shu and Ouarda [60] expanded on the techniques of Smakhtin [91] and Mohamoud [60] by employing a regression based logarithmic technique to interpolate between measured or predicted percentile values on the FDC to generate a continuous curve. A stepwise regression analysis was performed for each of 17 percentile flows and the FDC data were transferred to ungauged basins using various distance weighting schemes employing area, positional and physiographic data from multiple sites. In a study in Quebec the authors found the FDC technique outperformed area ratio methods and that the inclusion of multiple source sites consistently improved predictive performance.
3.3 Determination of Homogeneous Regions
At their essence, regionalization techniques for flow estimation in ungauged basins involve procedures for deciding which sites with data will contribute to the estimation of a site with no
data. The principle is that sites with data that are the most hydrologically similar to those of the ungauged site will be the best predictors of flow behaviour at that site and should be included in the estimate calculations. Conversely, sites that are dissimilar to the ungauged site should be excluded. When considering the prediction of FDCs some difficulty arises because the processes that influence the low flow portion of the flow duration curve may not be the same as those that influence the high-flow portion. For instance Dingman [24] and Searcy [83] suggested that the lower flows of a FDC are controlled less by climactic drivers than by basin geology and physiography, whereas in a runoff-dominated watershed, the local climate would have a very significant impact on the higher flows and would impact the FDC accordingly. Regionally, precipitation, temperature and evaporation will affect river flows but locally flows can be controlled by basin physical properties including geology, land use, the presence and position of surface water bodies [42].
There are many possible approaches to determining how data are regionalized; one of the most popular and easiest to interpret is the geographically contiguous region. If an ungauged site falls within a geographic region (on a map) then the characteristics of the region as a whole (or sites within the region) are used to predict the flow characteristics and data from other regions are not included. One of the only studies to identify hydrologic regions nationwide was conducted by Acres Engineering [2] in which 12 Hydrologic regions were identified. This was done by first identifying a number of predefined physiographic regions within Canada and then sub-dividing by the presence or absence of permafrost and regional climactic differences [3].
Gingras provided regionalization studies in Ontario and Quebec, determining nine independent regions with similar flooding characteristics [35]. The regions were delineated using a parametric frequency analysis and relationships between the magnitude of the flood and the drainage area of the basin at the ungauged location could be estimated.
The Ontario Ministry of the Environment delineated the provincial regions differently, depending on the flow characteristics that had to be predicted as described in the Ontario Flow Assessment Techniques (OFAT) manual [17]. For instance, to predict low flows six regions were delineated within the province, but using the index flood method 12 different regions were delineated.
Leboutillier and Waylen [52] conducted a regionalization study to develop flow duration curves for the province of British Columbia. A distance weighting technique was employed for statistical parameters that described FDC shape and magnitudes to develop a surface over the province. These were combined in a cluster analysis to describe seven hydrological regions on a map of the province.
3.3.1 Delineated Homogeneous Regions
Hydrologically homogenous regions are identified areas that behave in a hydrologically similar manner. This approach has been widely used as it provides a conceptually straightforward mapping of regions to facilitate the prediction of behavior in sites that are ungauged or lacking data [52, 66, 67, 75, 92]. This approach can prove problematic; however, as regions that are hydrologically similar may not necessarily be geographically contiguous [1] and a more robust method would be to determine the statistical groupings based on influential parameters and then examine the fit of an ungauged basin within the available groupings.
A commonly employed technique for hydrologic region delineation is cluster analysis [52, 65, 92], which is a technique to assign observations to groups or clusters based on parametric
similarity. In the case of FDC estimation in ungauged basins this clustering is based on similarity of watershed characteristics of a gauged or ungauged site. The goal of clustering is to establish similarity within a cluster and establish dissimilarity between clusters. The results of the clustering analysis will depend on the selection of the similarity measure (e.g. Euclidean distance, absolute differences) and the method that links data to a cluster (e.g. Ward’s method, UPGMA). An ungauged site can then be associated to a cluster using discriminant analysis or similar statistical approach [65].
The problem of ungauged sites being not well placed statistically within any one cluster can be overcome by weighting the contributions from a number of clusters on the target site. Tasker et al. [93] employed multivariate cluster analysis when determining 50-year floods in ungauged basins in Arkansas, USA. The authors also employed a discriminant analysis to determine the probability that a site existed within a delineated cluster. The final prediction of the 50-year flood value was determined by employing weighted averages of predicted values for each cluster, the weights being dictated by the probabilities derived from the discriminant analysis. This technique has also been called fractional membership [1].
The use of hydrological regions, especially as geologically contiguous regions seems to be the most popular approach based on the number of studies conducted that employ the technique [2, 52, 66, 67, 75, 92].
3.3.2 Region of Influence (ROI)
The region of influence (ROI) method identifies homogenous sites based on hydrologic or physiographic characteristics and not necessarily a physical boundary between basins. The technique was originally suggested by Acreman and Wiltshire who suggested dispensing with physical or contiguous geographical regions [1]. Regions are identified based on a watershed’s proximity to other watersheds (Euclidian distance) which can be a determined by a combination of differences in station attributes including physiographical, climatological or hydrologic information. A weighting function is defined to assign the importance of each catchment characteristic in calculating the Euclidean distance.
ROI is generally used to generate larger datasets to allow for more accurate generation of extreme value estimate techniques [12, 13]. Tasker et al. [93] reviewed various regionalization methods for 50-year flood estimation for a study in Arkansas and found ROI gave the best results for that region when compared to various region subdivisions and a cluster/discriminant analysis for region delineation. ROI has also been used to estimate flow characteristics at ungauged sites [109], naturally excluding the use of hydrologic predictor variables in the approach.
It appears that up to now only one attempt to estimate FDCs at ungauged locations using the ROI approach has been conducted. In that study conducted by Holmes et al. [42] the ROI approach was used to predict the Q95 flow value in the ungauged basin. The FDC curves at the
ungauged sites were generated by comparing the predicted Q95 value with Q95 values of
standardized FDCs developed in the region. A linear interpolation between these standardized curves was used to generate the resulting target FDC.
3.3.3 Canonical Correlation Analysis
Canonical Correlation Analysis (CCA) is a multivariate statistical technique that permits the establishment of interrelations between two groups of variables by determining linear
combinations of one group that are most correlated to linear combinations of the second group. The technique has been employed as a regionalization method in flood frequency analysis, where one group of variables represents the flood characteristics and the second represents the physical and climatological characteristics of the basin, the principle being that by knowing the second the first can be predicted [9]. Regions can then be defined by examining the proximity of a gauge to other gauges in the parametric or hydrological space. A Chi-Squared distance is defined and based on judiciously defined confidence level a region influencing each an ungauged basin can be defined.
The procedure has been employed for flood frequency analysis in Quebec [80] and Ontario [76]. Although there appears to be no reason why the CCA regionalization approach could not be applied to a FDC transposition to ungauged basins, in any of a parametric, statistical or graphical context, none of those techniques was found in the literature.
3.3.4 Non-Linear Spatial Interpolation Technique
Hughes and Smakhtin [44] developed a non-linear technique for infilling missing data at proximal gauges, and re-building flow time series using flow duration curves as a transfer function. Although this technique was developed primarily to reconstruct time series data, it is relevant in this current work considering the techniques employed to apply and transfer flow duration curves between gauges. The technique employed monthly 1-day FDCs for each calendar month for both the target and source stations and allowed for time series transfer on a monthly basis. Smakhtin et al [89, 90] developed and extended a technique for ungauged stations where the FDC at the target site was unknown. The authors suggested normalizing FDCs using an index flow, and then determining the target FDC and determining the index flow at the target location. The source FDC is represented as a discharge table for fixed percentage points and data between points was interpolated using a logarithmic interpolation function. Source gauges are used to estimate the target ungauged FDC by a weighted interpolation based on the similarity of the source gauges to the target location. The authors recommended that up to five gauges be used as source sites. The standardized FDCs created for ungauged basins were then standardized with index flows determined by regional regression analysis. The authors also suggested avoiding the direct use of catchment area and preferred the use of mean annual runoff or mean daily flow values at the site of interest in the regression analysis. This information was readily available in the South African case study sited. The authors also suggested 20 to 25 years of data being adequate for the application of the method. This method has been reviewed favourably by Metcalfe et al. [57] for inclusion as a tool for establishing flow regimes in Ontario and is considered a reasonable ungauged basin estimation technique.
3.3.5 Regression Based Logarithmic Interpolation
Shu and Ouarda suggested a method – Regression Based Logarithmic Interpolation (RBLI) – similar to Smakhtin et al. [89, 90] in that it employed the transposition of a number of percentiles on known FDC curves to ungauged locations to construct FDCs at these target locations. Like the Smakhtin technique the FDC curves were interpolated between points using a logarithmic interpolation technique but unlike the Smakhtin technique the regional regression was performed on the FDC percentiles without normalizing to an index flow value.
The authors investigated a number of regionalization approaches and looked at single and multiple source FDC estimation, and also compared the FDC transposition to drainage-area ratio methods. The authors also experimented with the number of source gauges and the distance
weighting scheme used to regionalize the FDCs. The FDC transposition methods outperformed the area ratio methods in this study, conducted in Quebec. Multiple source sites were found to show substantial improvement over using single sites in most cases, and of the distance weighting schemes examined (area, geographic distance, physiographic differences) a geographic distance weighting scheme was found to perform best. A method adapted from the above is being employed by Ouarda in the investigation of ungauged basins for the International Joint Commission (Prof. Taha Ouarda, Personal Communication)
3.4 Notable FDC Transposition Studies
This section examines a number of studies that have looked at FDC transposition studies conducted to compare various techniques used in a region and to determine their predictive capabilities.
Yu et. al. [108] studied 15 watersheds in Taiwan and examined parametric (polynomial equation) and area ratio methods for FDC transposition. The authors used bootstrap resampling to determine the variance around the estimated values for both methods. The polynomial method described the FDCs based on regression equations that included drainage area, mean altitude of the basin, and average annual rainfall and predictive variables. The polynomial representation of the FDCs showed less error, as exhibited by tighter confidence intervals, than did the area ratio method.
Castellarin et al [15] examined a number of techniques for regionalization of flow duration curves, particularly for low flow (Q30 to Q99) transposition. The study examined statistical
techniques proposed by Fennessey and Vogel [31], a parametric technique presented by Franchini and Suppo [34] and a graphical technique described by Smakhtin [91]. The regionalization methods employed drainage area, permeable portion of the basin, maximum, mean and minimum elevations, and elevation range. Climactic variables employed were mean annual temperature, mean annual precipitation, mean annual potential evaporation, and mean annual net precipitation. The models were compared on a 52 station study with a jack-knife cross validation quality assessment. The authors found that all three methods produced results of similar quality, but the techniques produced satisfactory results (based on authors evaluation metric) only 60% of the time. Interestingly, it was discovered that five years of flow data records was enough to produce adequate flow duration curves which was better than any of the regionalization methods. This aspect of the study highlighted the importance of employing observed data whenever possible or practicable.
3.5 Channel Geometry Estimation
An estimate of the channel geometry at the ungauged locations is an essential component in the estimation of the hydrokinetic energy in a river. River geometry prediction generally attempts to relate the channel geometry to some other measurable quantity. The channel geometry is largely dictated by the sediment and water discharge rates to the reach and constrained by the channel geological characteristics.
River geometry pattern prediction advanced significantly with the relationships developed in a landmark paper by Leopold and Maddock [53] who identified a power law relationship between the width, depth and mean velocity and a corresponding discharge. Their work was based on the examination of 20 natural river cross sections. The relationships are:

![Figure 1 - Run-of-river Hydro project employing a penstock [107]](https://thumb-eu.123doks.com/thumbv2/123doknet/14148230.471483/13.892.136.658.203.434/figure-run-river-hydro-project-employing-penstock.webp)
![Figure 3 - Velocity Contours in an Irregular Channel [2]](https://thumb-eu.123doks.com/thumbv2/123doknet/14148230.471483/16.892.108.506.750.915/figure-velocity-contours-irregular-channel.webp)
![Figure 4 - Turbine Classifications [50]](https://thumb-eu.123doks.com/thumbv2/123doknet/14148230.471483/18.892.121.530.227.449/figure-turbine-classifications.webp)
![Figure 5 - Typical Flow Duration Curve (FDC) identifying firm flow at Q 90 [67]](https://thumb-eu.123doks.com/thumbv2/123doknet/14148230.471483/19.892.108.571.317.626/figure-typical-flow-duration-curve-fdc-identifying-firm.webp)
![Figure 7 - Variability in Channel Geometry Coefficients [77]](https://thumb-eu.123doks.com/thumbv2/123doknet/14148230.471483/32.892.117.541.151.499/figure-variability-channel-geometry-coefficients.webp)

![Figure 9 - UMA Group - River Energy Flux [97]](https://thumb-eu.123doks.com/thumbv2/123doknet/14148230.471483/44.892.104.787.459.906/figure-uma-group-river-energy-flux.webp)
