HAL Id: hal-00304252
https://hal.archives-ouvertes.fr/hal-00304252
Submitted on 11 Jun 2008HAL is a multi-disciplinary open access
archive for the deposit and dissemination of sci-entific research documents, whether they are pub-lished or not. The documents may come from teaching and research institutions in France or abroad, or from public or private research centers.
L’archive ouverte pluridisciplinaire HAL, est destinée au dépôt et à la diffusion de documents scientifiques de niveau recherche, publiés ou non, émanant des établissements d’enseignement et de recherche français ou étrangers, des laboratoires publics ou privés.
Radiation transfer in stratus clouds at the BSRN
Payerne site
D. Nowak, L. Vuilleumier, A. Ohmura
To cite this version:
D. Nowak, L. Vuilleumier, A. Ohmura. Radiation transfer in stratus clouds at the BSRN Payerne site. Atmospheric Chemistry and Physics Discussions, European Geosciences Union, 2008, 8 (3), pp.11453-11485. �hal-00304252�
ACPD
8, 11453–11485, 2008 Radiation transfer in stratus clouds at BSRN Payerne D. Nowak et al. Title Page Abstract Introduction Conclusions References Tables Figures ◭ ◮ ◭ ◮ Back Close Full Screen / EscPrinter-friendly Version Interactive Discussion Atmos. Chem. Phys. Discuss., 8, 11453–11485, 2008
www.atmos-chem-phys-discuss.net/8/11453/2008/ © Author(s) 2008. This work is distributed under the Creative Commons Attribution 3.0 License.
Atmospheric Chemistry and Physics Discussions
Radiation transfer in stratus clouds at the
BSRN Payerne site
D. Nowak1,2, L. Vuilleumier1, and A. Ohmura2 1
Federal Office of Meteorology and Climatology MeteoSwiss, Payerne, Switzerland 2
Institute for Atmospheric and Climate Science, ETH Zurich, Switzerland Received: 26 March 2008 – Accepted: 7 May 2008 – Published: 11 June 2008 Correspondence to: L. Vuilleumier ([email protected])
ACPD
8, 11453–11485, 2008 Radiation transfer in stratus clouds at BSRN Payerne D. Nowak et al. Title Page Abstract Introduction Conclusions References Tables Figures ◭ ◮ ◭ ◮ Back Close Full Screen / EscPrinter-friendly Version Interactive Discussion
Abstract
Clouds represent a major source of uncertainty in understanding climate change, be-cause potential changes in the way they affect the atmospheric and surface energy budget are difficult to predict. It is therefore important to determine how clouds af-fect radiation. Stratiform clouds in particular have an important efaf-fect on climate as
5
they cover large areas. This article presents results of radiation transfer calculations with MODTRANTM for well-defined stratus cloud cases detected at the meteorological station of Payerne, Switzerland. These stratus situations are selected in a data set covering the years from 2000 to 2005 with a method using data widely available at national meteorological observing stations. For 18 single layer stratus situations the
10
shortwave radiation fluxes calculated with MODTRANTM are compared to surface ob-servations from the Baseline Surface Radiation Network (BSRN) site at Payerne and top of atmosphere (TOA) observations from the Clouds and the Earth’s Radiant En-ergy System (CERES) experiment. A median bias on the order of 20 Wm−2(<9%) was found for the differences between modeled and observed reflected solar radiation at
15
TOA. At the surface, good agreement is obtained by adjusting the vertical extinction in the modeled cloud layer within reasonable limits for a stratus cloud: The median bias of modeled minus observed shortwave downward radiation is well within instrument pre-cision (<1%). The simultaneous agreement of modeled and observed radiation fluxes at the surface and TOA confirmed that radiation transfer in the atmosphere including
20
a single cloud layer can be well simulated with MODTRANTM. Based on the present results, the absorbance was calculated within the stratus cloud layer (cloud base to cloud top). For the 18 single stratus layer situations the median absorbance is 0.07 [minimum 0.04, maximum 0.1], the median transmittance is 0.29 [0.15 0.39], and the median cloud reflectance is 0.70 [0.63, 0.80].
ACPD
8, 11453–11485, 2008 Radiation transfer in stratus clouds at BSRN Payerne D. Nowak et al. Title Page Abstract Introduction Conclusions References Tables Figures ◭ ◮ ◭ ◮ Back Close Full Screen / EscPrinter-friendly Version Interactive Discussion
1 Introduction
Clouds cover approximately 60% of the earth’s surface (Heymsfield, 1993), and they play a major role in the evolution of climate. The properties of clouds most important for climate are those that affect radiation and precipitation, namely, cloud height, thickness, horizontal extent and horizontal variability, water content, cloud phase, as well as the
5
size of droplets and ice crystals. Therefore it is important to determine how clouds affect the radiation, while distinguishing the different types of clouds (Warren, 2002). Stratus, stratocumulus, altostratus and cirrus clouds are thought to have the greatest effect on climate as they cover large areas. Stratus and stratocumulus cover an area of 34% over ocean surface and 18% of the land surface (Heymsfield, 1993). On average,
10
clouds tend to have a cooling effect on climate (Somerville et al., 2007). But, effects of clouds remain a major source of uncertainty in the simulation of climate changes (e.g. aerosol indirect effect, cloud lifetime effect, response of cloud cover to increasing greenhouse gases, Trenberth et al., 2007).
Many studies were performed using detailed cloud observations and radiation
mea-15
surements. Special emphasis was given to the so called cloud absorption anomaly (CAA, Li et al., 1999). Collocated satellite and surface measurements of solar radia-tion showed significantly higher solar absorpradia-tion by clouds than anticipated, resulting in about 25 Wm−2more absorption than predicted by theoretical models (global mean,
Cess et al., 1995). Two experiments were performed (Atmospheric Radiation
Mea-20
surement Enhanced Shortwave Experiment – ARESE – and ARESE II) in order to determine the reasons for the systematic underestimation of the cloud absorption by the models (Valero et al., 2000; Ackerman et al., 2003). With help of the ARESE II data sets, Li (2004) demonstrated that no significant CAA was observed when accounting for observation and modeling uncertainties, and that it was largely an artifact. Studies
25
like ARESE and ARESE II often include few very well determined cloud cases over a short period of time. For studying the radiative effects of clouds it is difficult and ex-pensive to obtain the requested datasets over long time periods. However, for single
ACPD
8, 11453–11485, 2008 Radiation transfer in stratus clouds at BSRN Payerne D. Nowak et al. Title Page Abstract Introduction Conclusions References Tables Figures ◭ ◮ ◭ ◮ Back Close Full Screen / EscPrinter-friendly Version Interactive Discussion layered stratiform cloud types, methods can be developed for calculating their effect on
radiation using standard meteorological observations combined with satellite observa-tions.
This paper presents results of radiation transfer calculations with MODTRANTM for well-defined stratus cloud situations selected in a data set covering 2000 to 2005.
5
These cloud situations are selected with a method using data widely available at na-tional meteorological observing stations such as the MeteoSwiss Payerne aerological station (PAY). The data include surface weather observations (synops), radiosonde data and weather maps, as well as radiation observations from the PAY Baseline Sur-face Radiation Network (BSRN) station for model comparisons and validation. Our
10
goal is achieving a sufficiently accurate description of the radiation transfer in the at-mosphere (including a cloud layer) so that calculated radiation fluxes match both sur-face and top of the atmosphere observations. This study allows the determination of transmittance, absorbance and reflectance, while focusing on single layered stratiform clouds, more precisely on stratus nebulosus, which often occur during stable winter
15
conditions at PAY.
2 Observation techniques
The PAY aerological station (46.812◦N, 6.942◦E, 491 m above sea level – a.s.l.), lo-cated in the Swiss Plateau between the Jura Mountains and the Alps, is operated by the Federal Office of Meteorology and Climatology (MeteoSwiss). Atmospheric
observa-20
tions are performed operationally following World Meteorological Organization (WMO) standards. For the selection of cloud cases, determination of cloud boundaries and for model to observation comparisons of surface radiation, official meteorological ob-servations and BSRN radiation measurements from PAY were used. Additionally, the cloud case selection was confirmed with surface observations of La Chaux-de-Fonds
25
(CDF, 47.083◦N, 6.792◦E) at 1060 m a.s.l and Jungfraujoch (JFJ, 46.547◦N, 7.985◦E),
ACPD
8, 11453–11485, 2008 Radiation transfer in stratus clouds at BSRN Payerne D. Nowak et al. Title Page Abstract Introduction Conclusions References Tables Figures ◭ ◮ ◭ ◮ Back Close Full Screen / EscPrinter-friendly Version Interactive Discussion Because of the long time period considered, different sources of information were
available at different times for specifying the status of the atmosphere. For a short time period (3 months during winter 2003/2004) an intensive measurement campaign including a cloud radar provided a dataset allowing comparison of the cloud top detec-tion used in this study with cloud radar defined cloud top heights (Nowak et al., 2008a).
5
Since November 2003 ceilometer data is available to define the cloud base height, which can be compared to the heights determined by surface weather observers. 2.1 Synop
Surface weather observations (synop), including cloud information are performed every 3 h at PAY, starting at 00:00 UTC. Cloud cover, type and base height are reported for
10
the three main cloud levels (low, middle, high clouds) as well as the horizontal visibility (M ¨uller, 1982). Despite their subjective character and variations from one observer to another these observations (synop) are very important for climatologists and meteo-rologists (Dai, 2006). These human eye observations are generally of excellent quality and give regular and important information to meteorologists about the state of the sky,
15
the meteorological conditions (fog, snow, rain etc.), and the horizontal visibility. 2.2 Radiosounding
Balloon-borne meteorological radiosoundings including pressure, temperature and hu-midity profiles are measured twice a day at 12:00 and 00:00 UTC. They are launched at 11:00 and 23:00 UTC respectively, an hour before the designated time, in order to
20
account for the balloon ascent. Operational radiosoundings are made with the SRS 400 sonde (Richner 1999; Ruffieux et al., 2006). In addition radiosoundings with the Snow White dew point hygrometer (Miloshevic et al., 2006) are available at irregular time intervals.
ACPD
8, 11453–11485, 2008 Radiation transfer in stratus clouds at BSRN Payerne D. Nowak et al. Title Page Abstract Introduction Conclusions References Tables Figures ◭ ◮ ◭ ◮ Back Close Full Screen / EscPrinter-friendly Version Interactive Discussion 2.3 Weather map
The daily synoptic weather situation for Switzerland and Europe is published on a weather map including the distribution of the atmospheric pressure, fronts and informa-tion on the cloud situainforma-tion, wind, sunshine durainforma-tion, relative humidity and precipitainforma-tion at 12:00 UTC. The 500 hPa geopotential height is given including wind direction and
5
strength. Additionally, meteorological observations of several observation stations of the measurements network from MeteoSwiss are included on these weather maps for 06:00, 12:00 and 18:00 UTC. A satellite image (Meteosat) is shown for 12:00 UTC, as well as the PAY radiosonde ascent for the 00:00 and 12:00 UTC temperature and hu-midity profiles. The satellite imagery, even if of low resolution, gives valuable additional
10
information on the cloudiness seen from top of the clouds. 2.4 Radiation
One of 39 operative BSRN radiation observation sites (Ohmura et al. 1998) spanning over the globe is located at PAY. High quality shortwave and longwave surface radi-ation flux measurements are performed at a high sampling rate. Diffuse and global
15
shortwave downward radiation (SDR) are measured with shaded and unshaded Kipp & Zonen CM21 pyranometers, respectively, at a sampling rate of 1 Hz. One-minute mean values are recorded, as well as the sample minimum and maximum values, and the sample standard deviation. The pyranometers for the diffuse and global SDR mea-surements are ventilated and heated. In addition, the instruments are calibrated at the
20
World Radiation Center (WRC) at Davos, Switzerland and are regularly compared with reference instruments using recent calibration from the WRC. The errors of the global and diffuse SDR have been estimated for BSRN PAY for a one year measuring period (October 2004–October 2005) (Ruckstuhl, 2008). The monthly mean error (RMSE) of the global SDR measured with an unshaded CM21 is about 1.6% (2.3 Wm−2) with a
25
bias of about −2.3 Wm−2. More details on the radiation observations at BSRN PAY and the instruments settings are given by Nowak et al. (2008b).
ACPD
8, 11453–11485, 2008 Radiation transfer in stratus clouds at BSRN Payerne D. Nowak et al. Title Page Abstract Introduction Conclusions References Tables Figures ◭ ◮ ◭ ◮ Back Close Full Screen / EscPrinter-friendly Version Interactive Discussion 2.5 Cloud radar
During the COST 720 Temperature, hUmidity and Cloud (TUC) experiment performed at PAY from 15 November 2003 to 15 February 2004 (Ruffieux et al., 2006), a Fre-quency Modulated Continuous Wave (FMCW) cloud radar was operated for determin-ing cloud boundaries. In some stratus cloud cases used in this study, the cloud top
5
height was determined using cloud radar data. The height of the upper boundary determined by the cloud radar was compared with the height of this boundary deter-mined using humidity radiosounding profiles. The method to determine the cloud upper boundary and results of the comparison are described in Sect. 3. Further information on this method and its performance are provided by Nowak et al. (2008a).
10
2.6 Ceilometer
Since the beginning of the TUC experiment in November 2003, cloud base information inferred from ceilometer data is available at PAY. From November 2003 to August 2004, a Vaisala CT25K ceilometer was operational at PAY. Afterwards ceilometer data was retrieved from a nearby military airport (about 4 km from PAY), where the same type
15
of ceilometer is operated at each end of the runway. When available, ceilometer data were used to provide cloud base height. In the other cases, the information from the synop observations was used. Cloud base detection with ceilometers is described by Nowak et al. (2008a) and Kollias et al. (2004).
3 Case selection and cloud boundaries detection
20
Stratus nebulosus is a low level cloud that is frequent at PAY, especially during the win-ter half year. It occurs either in combination with strong and stable high pressure con-ditions situated north of the Alps, together with easterly winds on the Plateau, or with the center of the high pressure being located over Switzerland and the Alps (Sch ¨uepp,
ACPD
8, 11453–11485, 2008 Radiation transfer in stratus clouds at BSRN Payerne D. Nowak et al. Title Page Abstract Introduction Conclusions References Tables Figures ◭ ◮ ◭ ◮ Back Close Full Screen / EscPrinter-friendly Version Interactive Discussion 1979). In both cases, a distinct temperature inversion can be observed at the altitude
where the cloud top is located. While the stratus layer over the Swiss Plateau hardly dissipates during the day, fair weather conditions dominate in the Jura Mountains and in the Alps (Hack, 2006). In such cases, it is possible to find single layered stratus cloud situations.
5
Surface observations (synops) are used for the primary selection of the cloud cases. Observations performed at 12:00 UTC were considered, including stratus nebulosus only at coverage of 8 octas (100%). A known limitation is the restriction to the lowest cloud layer in the case of multi-layer clouds with full sky coverage of the lowest layer. As the focus of this study is on low level single layered stratus clouds, the surface
10
observations of CDF and JFJ were used for verifying the absence of clouds above the cloud layer detected at PAY. Only situations where CDF and JFJ observations include 0 or 1 octa of clouds were chosen. The daily synoptic weather map was verified with a focus on the atmospheric pressure distribution over Switzerland and Central Europe. The pressure distribution at the surface was used for verification of the general weather
15
situation. The emphasis was set on stable high pressure conditions over Switzerland and the Alps. Under these conditions single layered stratus nebulosus situations most commonly occur.
The radiosounding profile was used to determine the cloud top height (Wang et al., 1999; Dong et al., 2000). Cloud layers were identified as regions with a relative
humid-20
ity above a given threshold, and cloud upper boundaries were determined by finding sudden decrease in relative humidity (Nowak et al., 2008a). In two cases, data of the FMCW cloud radar could be used for the cloud top height detection. The limi-tation to two cases is due to the restriction for the cloud type and definition (single layer, noon observation, coincidence with satellite observation) and to the short
opera-25
tional period of the cloud radar at the PAY site. However, Nowak et al. (2008a) did not follow the above mentioned restrictions, and they could confirm on a larger data set (25 independent cases), the validity of the radiosounding profile method for determin-ing the cloud upper boundary. In their study, they found an average difference between
ACPD
8, 11453–11485, 2008 Radiation transfer in stratus clouds at BSRN Payerne D. Nowak et al. Title Page Abstract Introduction Conclusions References Tables Figures ◭ ◮ ◭ ◮ Back Close Full Screen / EscPrinter-friendly Version Interactive Discussion the radiosounding and cloud radar determination of the cloud upper boundary of 53 m
(radiosounding minus cloud radar).
In the majority of the cases, the cloud lower boundary was inferred from the synop observations. However, for cases after 15 October 2003, ceilometer data were avail-able for cloud base determination, and also allowed verification of the synop
observa-5
tion method. The agreement between the cloud base height detected with ceilometer data and the height reported in the surface observations is on the order of 25 m (median difference for 39 stratus cases found for this study or the study presented by Nowak et al., 2008a). Note that the altitude of the cloud base is measured by the ceilome-ter exactly above the instrument, but not for the surroundings; whereas the surface
10
observations represent a mean altitude of the stratus covering the hemisphere. If the cloud base is not totally homogenous, large differences may occur between the local ceilometer data and the hemispherical synop observation.
4 Satellite observations
Clouds and the Earth’s Radiant Energy System (CERES) experiment satellite
instru-15
ments were developed for the National Aeronautics and Space Administration (NASA) Earth observation system (EOS). CERES belongs to an investigation to examine the role of cloud/radiation feedback in the earth’s climate system (Wielicki et al., 1996). The instruments are flown aboard the Tropical Rainfall Measuring Mission (TRMM) and on the EOS Terra and Aqua satellites. The CERES instrument consists of a three
chan-20
nel scanning broadband radiometer, which uses precision thermistor bolometers to achieve radiometric measurements with high accuracy and stability. The instrument’s field of view is of 20 km (about a factor 2 smaller than for the Earth Radiation Budget experiment). Three spectral channels measure the thermal radiation emitted from the earth’s surface in the 8–12 µm window, the shortwave broadband 0.2–5 µm and total
25
broadband 0.2–100 µm radiation. The CERES product used in this study is the Clouds and Radiation Swath (CRS) for the period of December 2000 to December 2005. This
ACPD
8, 11453–11485, 2008 Radiation transfer in stratus clouds at BSRN Payerne D. Nowak et al. Title Page Abstract Introduction Conclusions References Tables Figures ◭ ◮ ◭ ◮ Back Close Full Screen / EscPrinter-friendly Version Interactive Discussion product includes CERES observed TOA fluxes, cloud properties derived by the CERES
team from MODIS pixels collocated within the larger CERES footprints, and the results of a fast radiation transfer code for each CERES footprint included in the file. More information on this product is given by Charlock et al. (1997) and Rutan et al. (2001). The reflected solar irradiance observed at the top of atmosphere (TOA) was used for
5
comparison with our model results. Cloud properties given in the CRS include infor-mation on cloud fraction, cloud type and phase (water/ice). These variables were used for confirming that the CERES instrument observed conditions similar to single layered stratus cloud situations, which we assume in our model.
For a short time period, data from the Geostationary Earth Radiation Budget (GERB)
10
project (Harries et al., 2005) were available. GERB is a highly accurate, visible-infrared broadband radiometer designed to operate on a spinning geostationary satellite to make measurements of the reflected solar and emitted thermal radiation from the Earth (Harries and Crommelynck, 1999). The GERB instrument is in operation on the first Meteosat Second Generation (MSG) satellite. Total broadband reflected radiation
15
(0.32–100.0 µm), shortwave reflected radiation (0.32–4.0 µm), and longwave emitted radiation (4.0–100.0 µm by subtraction of SW from total) observations are available. The data used in this study is the High Resolution (HR) product provided over a grid size of 3×3 SEVIRI pixels (i.e. 9×9 km at nadir). Fine scale estimates of the broadband radiances from SEVIRI are combined with GERB observations (44.6 km×39.3 km at
20
nadir) to produce the GERB HR data. The HR values are provided each 15 min as an instantaneous value at the time of the SEVIRI observation. Observations collo-cated with the PAY station are available since February 2004. During the period from February 2004 to December 2005 four situations were found answering our requisites for model simulations and model to observation matching at surface and top of
atmo-25
sphere.
For few stratus cases, observations of the medium-spectral resolution imaging spec-trometer (MERIS) were available, and used for a verification of the cloud type (classified according their height and optical thickness) and cloud albedo (Fischer et al., 2000a,
ACPD
8, 11453–11485, 2008 Radiation transfer in stratus clouds at BSRN Payerne D. Nowak et al. Title Page Abstract Introduction Conclusions References Tables Figures ◭ ◮ ◭ ◮ Back Close Full Screen / EscPrinter-friendly Version Interactive Discussion b). Especially the cloud type information was valuable for verifying that the selected
case is a single cloud layer situation.
5 Radiation transfer model MODTRANTM
MODTRANTM is a state of the art column radiative transfer model to calculate short-wave and longshort-wave radiation fluxes at the Earth’s surface or at any other point in the
5
atmosphere from the UV (0.2 µm) to the thermal infrared (>100 µm). The version used for this study is MODTRAN5v2r11TM (called MODTRANTM in this paper for conve-nience). For detailed information about MODTRANTM and the range of applications see Berk et al. (1998, 2003).
The performance of a former MODTRAN4TM release for clear-sky radiation transfer
10
at PAY has been tested in a previous study of cloud free situations at noon (Nowak et al., 2008b). In the study of the cloud free situations, the diffuse SDR was found to be generally overestimated by the model (median bias 4.5 Wm−2), and the model to obser-vation linear regression slope and zero-intercept were found to differ significantly from their ideal values of 1 and 0. However, better agreement was obtained when restricting
15
the data set to cases where model 550 nm aerosol optical depth input is inferred from observations using nine spectral channels, and BSRN observations were performed with a new and more precise shading disk and sun tracker system. In this case, the median bias between model simulations and observed diffuse SDR was −0.4 Wm−2 (<1%).
20
Beside the introduction of a cloud layer, the description of the atmospheric state and the incoming radiation were developed similarly for this study and the previous one concerning clear-sky radiation. A detailed description of the model settings for SDR calculations is given by Nowak et al. (2008b), including the method for calculating CO2and O3 concentrations and the implementation of the temperature, pressure and
25
absolute humidity profile.
ACPD
8, 11453–11485, 2008 Radiation transfer in stratus clouds at BSRN Payerne D. Nowak et al. Title Page Abstract Introduction Conclusions References Tables Figures ◭ ◮ ◭ ◮ Back Close Full Screen / EscPrinter-friendly Version Interactive Discussion in the model setup is the introduction of a cloud layer. In the present study, a single
uniform stratus cloud layer is used. Cloud base height is determined using synop ob-servation or ceilometer data as described in Sect. 3. The cloud geometrical thickness is derived from the cloud base height and determination of cloud top height using ra-diosounding profiles or cloud radar data (see Sect. 3). In the MODTRAN™ framework,
5
model properties determining the simulation of radiation transfer in cloud are the cloud liquid water droplet vertical extinction [km−1] (hereafter called cloud vertical extinction), and the water droplet vertical column density [km g m−3]. None of these parameters
are routinely available at PAY. Consequently, the model default settings of these two parameters for stratus clouds were used for initial model simulations. Then, the
ver-10
tical cloud extinction was adjusted within limits adequate for stratus cloud, in order to minimize the differences between modeled and observed surface diffuse SDR. Such an adjustment seemed legitimate since there were no measurements available to de-termine this parameter, and the agreement found between model and observation in our former study (Nowak et al., 2008b) demonstrated the good skill of the model at
15
least for clear-sky radiation transfer.
6 Results
6.1 Surface radiation
In our data set covering the years from 2000 to 2005, we found 32 independent cases where a single stratus cloud layer could be unequivocally identified at the time of the
20
noon radiosonde launching (11:00 UTC) using the information described in Sects. 2 and 3. For these cases, we could simulate the transfer of radiation through the atmo-sphere (including the single cloud layer). As mentioned above, the first simulation was performed using the stratus clouds default model settings for describing the cloud layer between the lower and upper boundaries determined as described in Sect. 2. The
25
ACPD
8, 11453–11485, 2008 Radiation transfer in stratus clouds at BSRN Payerne D. Nowak et al. Title Page Abstract Introduction Conclusions References Tables Figures ◭ ◮ ◭ ◮ Back Close Full Screen / EscPrinter-friendly Version Interactive Discussion around this simulated time t (11:00 UTC in this case). The mean is calculated from the
minute-averaged observed radiation from t minus 2 min to t plus two minutes. In 13 of the 32 cases, a difference on the order of, or less than 10 Wm−2 was found between the simulated and observed values. In the remaining cases, we checked whether it was possible to obtain a better agreement by adjusting the vertical cloud extinction
5
within a reasonable range for stratus clouds (40 to 80 km−1). In a study presented by Lindberg et al. (1984), profiles of the extinction within stratus clouds were obtained with lidar returns from ground based measurements and spectrometers and a point visibility meter carried aloft by a tethered balloon. Their extinction values within the stratus cloud vary between the aforementioned limits with a maximum extinction on the
10
order of 100 km−1. Since we do not have measurements of the vertical extinction, it is
reasonable to adjust this model parameter within the range observed by Lindberg et al. (1984), in order to obtain a good agreement between model results and observation at the ground. In case a subsequent reasonable agreement is obtained between model results and satellite observations at TOA, we can conclude that the MODTRANTM
sim-15
ulation of radiation transfer in the atmosphere including the cloud layer is satisfactory. Such adjustment of an unobserved cloud property for obtaining good agreement be-tween simulated radiation fluxes and the corresponding observations was also applied in other studies (e.g. Dong et al., 2000 and Ackerman et al., 2003). After such an adjustment, it was in all cases possible to reduce the difference to be on the order of,
20
or less than 17 Wm−2. Table 2 provides different statistical indicators of the agreement
between model simulations and observations. 6.2 Top of atmosphere reflected radiation
As stated in the introduction, we aim at achieving a description of the radiation trans-fer in the atmosphere, including a single cloud layer, in a sufficiently accurate manner
25
so that the calculated radiation fluxes match observed values both at the surface and at the top of the atmosphere. For 31 of the 32 cases studied here, CERES observa-tions of the reflected shortwave radiation at the top of atmosphere (later referred to as
ACPD
8, 11453–11485, 2008 Radiation transfer in stratus clouds at BSRN Payerne D. Nowak et al. Title Page Abstract Introduction Conclusions References Tables Figures ◭ ◮ ◭ ◮ Back Close Full Screen / EscPrinter-friendly Version Interactive Discussion SURtoa) were available within a ±1 h window around the radiosonde launching time.
However, the simulation results exhibited large discrepancies with the SURtoaCERES
observations (large positive bias in the modeled minus observed SURtoa).
Two reasons were found that can explain such discrepancies. First, in some cases, the viewing zenith angle between the CERES instrument and the PAY station is large,
5
which results in large uncertainties in SURtoa. Restricting this angle to values below
40◦ further restricted the data set to 18 cases, which show a better agreement, but still have significant differences. Second, the CERES observation time is within a ±1 h window with respect to the radiosonde launching time, but generally a time mismatch remains. The most important effects arising from this time mismatch are differences in
10
solar zenith angle and in the characteristics of the cloud layer. In our stringent cloud selection, several criteria privileged stable situations. Thus, in most of the cases, the cloud layer should not evolve significantly between the time of radiosonde launching and the time of CERES observation, but changes in the location of the cloud upper and lower boundaries, as well as the cloud vertical extinction can occur.
15
Therefore, for the 18 cases where both the top of atmosphere and surface radiation flux simulation results could be compared with observation, we performed new simula-tion at the time of the CERES observasimula-tion, and compared them with the 5-min mean of surface observation around this time (similarly to Sect. 6.1). In order to compen-sate the possible evolution of the cloud layer between the time of radiosonde launching
20
(determination of the cloud layer altitude) and the time of simulation, the cloud verti-cal extinction was adjusted within reasonable limits (30 to 85 km−1) in order to obtain a good agreement between the surface SDR model calculation and observation. In 12 of the 18 cases an agreement better than ±10 Wm−2 was obtained, while in the other cases differences up to ±25 Wm−2 remained. As mentioned in Sect. 6.1, this
25
adjustment was performed within limits compatible with observations from Lindberg et al. (1984), and is reasonable given the absence of measurements of this parameter at PAY, and given the fact that we obtain a satisfactory agreement at TOA, while adjusting for agreement at the surface.
ACPD
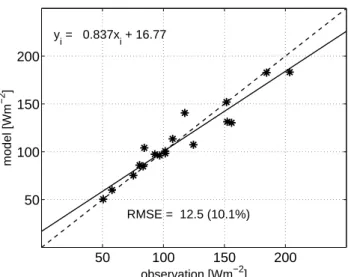
8, 11453–11485, 2008 Radiation transfer in stratus clouds at BSRN Payerne D. Nowak et al. Title Page Abstract Introduction Conclusions References Tables Figures ◭ ◮ ◭ ◮ Back Close Full Screen / EscPrinter-friendly Version Interactive Discussion Figure 1 shows a comparison between modeled and observed surface SDR for the
18 cases described in the previous paragraph, using the CERES observation time. Again, Table 2 provides different statistical indicators of the agreement between model simulations and observations. It can be seen that the majority of the simulation results could be well adjusted to the observation, but some cases present relatively significant
5
differences. The correlation (0.96) is high, and the median bias (−0.11 or −0.22%) is well below the instrument precision, which is expected, because the simulation is ad-justed to yield a good agreement in this quantity. However, the slope of the regression line and its zero-intercept are 0.84 and 16.8 Wm−2, respectively, and are significantly different from their expected value of 1 and 0 (see Table 2). It is due to the fact that the
10
majority of outliers are significant model underestimation for cases featuring high SDR observation: On Fig. 1, four of the seven cases with SDR observation above 110 Wm−2 are significantly below the X=Y line.
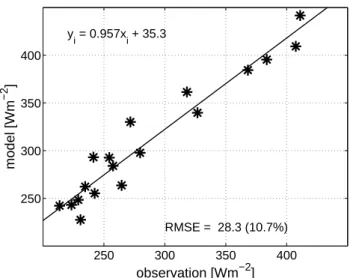
The model simulation values of the reflected shortwave radiation at the TOA (SURtoa) for the 18 studied cases are compared to corresponding CERES observations in Fig. 2,
15
and the related statistical indicators are also listed in Table 2. The agreement between simulation values and CERES observation is relatively good. The correlation remained as high as for surface radiation fluxes (0.96), but a more significant positive median bias is present (20.0 Wm−2or 8.9%). Furthermore, the 5 to 95 percentile range of the model minus observation difference distribution just includes zero. Even though the sample is
20
small, there seems to be a systematic positive bias between the model results and the CERES observation. On the other hand, the slope and zero-intercept of the regres-sion line (0.96 and 35.3 Wm−2, respectively) demonstrate the satisfactory agreement
between model and observations, for they are compatible with their expected values of 1 and 0 at the 95% confidence level (see Table 2). In addition to the CERES
ob-25
servations, preliminary values for SURtoaobservations by the GERB HR product (see Sect. 4) have been made available, but are not yet released for publication. In four cases, GERB observations could be compared with our simulations and differences less than 21 Wm−2were found for all these cases.
ACPD
8, 11453–11485, 2008 Radiation transfer in stratus clouds at BSRN Payerne D. Nowak et al. Title Page Abstract Introduction Conclusions References Tables Figures ◭ ◮ ◭ ◮ Back Close Full Screen / EscPrinter-friendly Version Interactive Discussion 6.3 Cloud absorbance, transmittance and reflectance
The results presented above show that radiation transfer in the atmosphere including a single cloud layer can be well simulated with MODTRANTM using our best knowl-edge of the atmospheric state derived from the data presented in Sects. 2 and 3, and reasonable assumptions for the parameters that were not measured. In addition, we
5
showed in a previous study (Nowak et al., 2008b) that the radiation transfer model we use also performed well in simulating transfer in a non-cloudy atmosphere.
Therefore the absorbance and reflectance of stratus cloud single layers can be in-ferred from our simulations using the calculated fluxes at the surface, the top of at-mosphere and at the cloud boundaries. The shortwave absorbance and
transmit-10
tance, as well as reflectance were calculated for the 18 cases where the matching with CERES observation at TOA was possible. Furthermore, the good performance of MODTRANTM for these 18 cases lead us to also compute absorbance and reflectance for all the 32 cases where single stratus cloud layers could be unequivocally identified, regardless of the availability of TOA observations. However, in the latter case, the time
15
of radiosonde launching was used as simulation time, because it allowed a better cloud description.
For determining the absorbance A in an atmospheric layer, we first calculated the net shortwave radiation flux (SNR) at the layer boundaries by subtracting the short-wave upward radiation (SUR) from the shortshort-wave downward radiation flux (SDR,
in-20
cluding both diffuse and direct radiation when any direct solar radiation is remaining): SNR=SDR–SUR. SNR is calculated from model simulated flux at the surface (sfc), cloud base (cba), cloud top (cto) and top of atmosphere (toa). We then calculated the absorbance A similarly to Valero et al. (2000). The absorbance of the cloud layer is therefore calculated as:
25
Acld =
SNRcto− SNRcba
ACPD
8, 11453–11485, 2008 Radiation transfer in stratus clouds at BSRN Payerne D. Nowak et al. Title Page Abstract Introduction Conclusions References Tables Figures ◭ ◮ ◭ ◮ Back Close Full Screen / EscPrinter-friendly Version Interactive Discussion The transmittance τ is then obtained as
τ=SDRcba
SDRcto, (2)
therefore as the ratio of the incoming radiation at the lower and upper boundary of an atmospheric layer. These calculations were performed for the following layers: above cloud (acl, from toa to cto), cloud (cld, from cto to cba), below cloud (bcl, from
5
cba to sfc), and for the whole atmosphere (all, from toa to sfc). The reflectance r of a layer is the ratio of outgoing flux and incoming flux at the top of the selected layer (r=SUR/SDR). In this study, r is calculated for the cloud top (cto) and for the whole atmosphere at TOA (all). The median, minimum and maximum values of absorbance, transmission and reflectance are given in Table 3. Finally, besides the absorbance it is
10
interesting to calculate the absorbed irradiance (absorption) in the cloud layer in Wm−2. We calculated the absorption as Oreopoulos et al. (2003) by subtracting the net flux (SNR) at cloud base from SNR at cloud top.
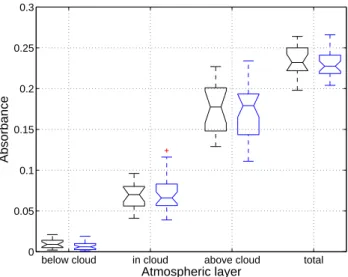
Figure 3 presents box plots summarizing the distribution of absorbance for the 18 cases where matching with CERES observation was possible (black box plots),
15
and for the whole 32 cases where the model runs were performed at radiosounding launching time (blue box plots). While the absorbance below the cloud layer is almost negligible, the median absorbance in the cloud is 0.07 varying between 0.04 and 0.1 for the 18 CERES cases. For the entire remaining atmosphere above the cloud, the absorbance is about 2 to 3 times higher with a median of 0.18, and minimum and
20
maximum values of 0.13 and 0.23. Figure 4 presents box plots summarizing the distri-bution of transmittance for the 18 cases (CERES, black box plots), and for the 32 cases (11:00 UTC model runs, blue box plots). While the transmittance below the cloud layer is almost 1, and is on the order of 0.8 (0.72 to 0.86) above the cloud layer, it goes down to about 0.3 (0.15 to 0.39) for the cloud layer. Ideally, the absorbance, reflectance and
25
transmittance of an atmospheric layer should add to 1 (ideal case with albedo being 0). When the median values of these parameters are added, the result for the layer below cloud (bcl) is significantly larger than for the ideal case (A + r + τ=1.17). However for
ACPD
8, 11453–11485, 2008 Radiation transfer in stratus clouds at BSRN Payerne D. Nowak et al. Title Page Abstract Introduction Conclusions References Tables Figures ◭ ◮ ◭ ◮ Back Close Full Screen / EscPrinter-friendly Version Interactive Discussion the cloud layer (cld) and the entire atmosphere (all) the addition results in 1.06 and
1.04, respectively.
The absorption depends on the solar elevation, cloud geometrical thickness and cloud droplet characteristics, such as number concentration, and the size distribution. As mentioned before, no information about cloud droplet characteristics was available
5
for this study, therefore model default were assumed for these characteristics, except that the vertical extinction was adjusted when necessary. The main absorption within the cloud is due to molecular absorption between the cloud particles, the cloud parti-cles however promote absorption by increasing the optical path lengths of radiation due to scattering. For the 18 CERES cases the mean absorption is on the order of 28 Wm−2
10
varying between 13.7 and 51.7 Wm−2. Below the cloud, approximately 1 Wm−2 is
ab-sorbed [minimum 0.2 Wm−2, maximum 4 Wm−2], and 91 [60, 111] Wm−2 above the cloud top to the TOA.
7 Discussion
The performance of MODTRANTM in simulating radiation flux at the surface for an
15
atmosphere including a single stratus cloud layer was satisfactory. The atmosphere was defined in large part using observations at the site as model input. Similarly, the cloud layer elevation and extent were derived from observations, but no information was available to define the other cloud optical properties. Nonetheless, it was possible to obtain an agreement between modeled and observed surface SDR within instrumental
20
uncertainty in about a third of the 32 cases considered. For the rest of the cases, it was possible to obtain comparable agreement by adjusting the cloud vertical extinction within reasonable limits for a stratus cloud.
TOA radiation flux measurements by the CERES satellite instruments that were suit-able for comparison with our model simulations were found in 18 of the 32 cases.
25
However, for sensible comparison we had to use the CERES observation time for both our simulations and surface radiation observations. This resulted in an increased
mis-ACPD
8, 11453–11485, 2008 Radiation transfer in stratus clouds at BSRN Payerne D. Nowak et al. Title Page Abstract Introduction Conclusions References Tables Figures ◭ ◮ ◭ ◮ Back Close Full Screen / EscPrinter-friendly Version Interactive Discussion match with the time of the observations used to derive the cloud layer elevation and
extent. Consequently, additional uncertainty was introduced, and we had to adjust the cloud vertical extinction for a larger fraction of the cases. Nonetheless, a reasonably good agreement was obtained for the 18 CERES cases while keeping the adjusted cloud vertical extinction within limits reasonable for a stratus cloud. The slope of the
5
linear regression between the simulated and observed SURtoais compatible with 1.
On the other hand, we found a mean error (RMSE) of 10.7% and a bias on the order of 20 Wm−2. Loeb et al. (2007) performed consistency tests comparing CERES TOA
fluxes of the same scene from different viewing geometries. These TOA fluxes are not direct observations, but results from the application of angular distribution models on
10
measurements. For overcast low clouds, they found a consistency of 8.5% that can be compared with our flux error. This seems lower than the RMSE and bias we found. But it should be emphasized that such error determination is difficult to compare with our results: We analyze 18 independent cases at a defined time, and the issue of the accuracy regarding a single CERES footprint is a problem difficult to address. Error
15
can only be established for averages of views, and not for a single view. Our RMSE and the consistency found by Loeb et al. (2007) seem on the same order. On the other hand, the bias can be explained by the size of the CERES footprint and the geometry of our column model.
Using a column model forbids reproducing 3-D effects of clouds. The footprint for the
20
CERES products includes parts of the nearby Jura Mountains and foothills of the Alps. These regions exhibit strongly different topographies than the PAY station. Since our study focuses on situations where the cloud deck is generally low, it must be assumed that the Jura and the Alp foothills often stick out of the stratus cloud layer. When these regions are not snow-covered, this can have an important influence on the reflectance
25
(albedo) and therefore on the SURtoa satellite observations. Instead of the uniform cloud we assume in the model, the footprint also includes in such case the much darker ground surface, resulting in a model overestimation of SURtoa satellite observations.
ACPD
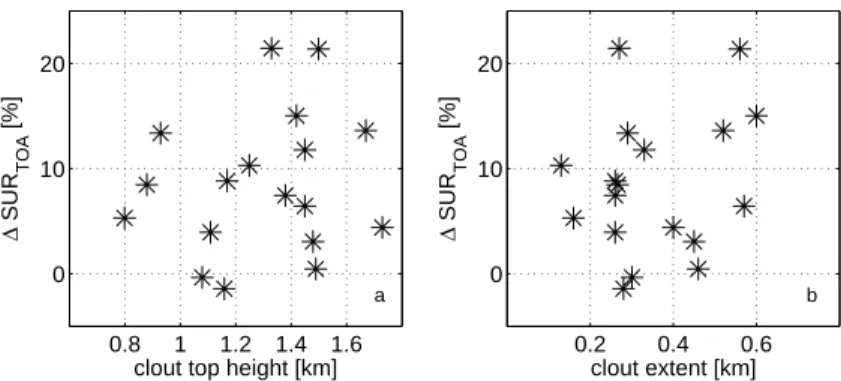
8, 11453–11485, 2008 Radiation transfer in stratus clouds at BSRN Payerne D. Nowak et al. Title Page Abstract Introduction Conclusions References Tables Figures ◭ ◮ ◭ ◮ Back Close Full Screen / EscPrinter-friendly Version Interactive Discussion and we would expect such overestimation to be more important when the clouds are
lower. But differences between the modeled and observed SURtoa do not show any correlation with increasing cloud top height or vertical extent as can be seen in Fig. 5.
Stratus nebulosus is a cloud type that can exhibit large variations in cloud extent, cloud droplet concentrations, optical depth and liquid water path (Dong et al., 2000).
5
In the 32 stratus cases presented in this study, the cloud extent varied between 130 and 600 m, with cloud bases between 55 and 660 m, and cloud tops between 310 and 1180 m above the ground. The absorbance values found in our study are compara-ble to those found in other studies (Oreopoulos et al., 2003; Ackerman et al., 2003), if we use the same layer limits than used in these studies. In order to compare our
10
results to those obtained in other studies, we used the model inferred absorbance and transmittance values for the same atmospheric layer as presented in these studies. In these two studies, the absorbance is inferred using surface measurements or mea-surements from an aircraft flying below the cloud and meamea-surements from an aircraft flying above the cloud (7 and 13 km for ARESE and ARESE II, respectively). We infer
15
the absorbance for the selected layer from our model calculations. The absorbance values observed between surface observations and aircraft measurements by Acker-man et al. (2003, ARESE II) vary between 0.178 and 0.217 (flight averages) for three selected days of measurements. The median absorbance for the corresponding atmo-spheric layer obtained with MODTRANTM calculations in our study is 0.177 and varies
20
between 0.146 and 0.203.
CERES products include the TOA reflectance. However, this does not use the same SURtoa that we use for our comparisons. The SURtoa values we used were directly
inferred from measured radiances. However, for its TOA reflectance products, CERES uses values of SURtoa and SDRtoa that are both consistent with their model of the
25
atmospheric radiation transfer. Nevertheless, the median CERES-derived reflectance for the 18 cases we studied is 0.59, therefore identical to the value we deduced from our simulations. The minimum CERES-deduced reflectance was lower (0.49), while the maximum was on the same order than our determination.
ACPD
8, 11453–11485, 2008 Radiation transfer in stratus clouds at BSRN Payerne D. Nowak et al. Title Page Abstract Introduction Conclusions References Tables Figures ◭ ◮ ◭ ◮ Back Close Full Screen / EscPrinter-friendly Version Interactive Discussion
8 Conclusions and outlook
This study presents a method to deduce absorption, absorbance, transmittance and reflectance of solar radiation in stratiform clouds, determined with a state of the art RTM and with widely available atmospheric observations. Such observations include radiosonde profiles, synop observations, cloud remote sensing information and
radia-5
tion measurements. Solar radiation flux matching between model and observations at both surface and top of atmosphere was obtained within reasonable agreement.
The results presented in this study offer a method for the monitoring of the effect of stratiform clouds on the solar radiation. Especially in a changing climate, track-ing changes in radiation budgets due to potential cloud changes becomes important
10
(e.g. changes of the stratiform cloud cover have been reported over the United States over a period from 1940 to 2002 by Sun and Groisman, 2004). Additionally cloud radiative properties may not remain constant when climate changes (Slingo, 1989).
Detailed atmospheric observations are required for improving the knowledge of the absorbance and reflectance of different cloud types. Ample data sets such as for
15
ARESE (Valero et al., 2000) and ARESE II (Oreopoulos et al., 2003) are rare and expensive to obtain. This study demonstrates a method using an alternative data set to obtain valuable information on cloud effects on solar radiation. Therefore we highly recommend carrying on similar future studies on longer time span for more cloud types (e.g. altostratus, nimbostratus), with the help of a growing set of data (e.g. additional
20
satellite information), and for different locations over the globe (e.g. BSRN sites with radiosonde data and synop observations).
The value of this study would have been significantly enhanced if the cloud optical properties had been available. Some cloud continuous operational monitoring with remote sensing instruments would be the most valuable addition from the point of view
25
of such studies. Similarly, the performance of the future GERB high resolution products (Harries et al., 2005) should be noted here, which combine the excellent radiometric performances of the GERB instrument with the finer spatial resolution of the SEVIRI
ACPD
8, 11453–11485, 2008 Radiation transfer in stratus clouds at BSRN Payerne D. Nowak et al. Title Page Abstract Introduction Conclusions References Tables Figures ◭ ◮ ◭ ◮ Back Close Full Screen / EscPrinter-friendly Version Interactive Discussion imager. Unfortunately, these products are still under validation, and we urge the GERB
community to release as soon as possible these very valuable data sets for publication.
Acknowledgements. This study is supported by the National Centre of Competence in
Cli-mate Research (NCCR CliCli-mate) sponsored by the Swiss National Science Foundation. Spe-cial thanks to G. P. Anderson at AFRL/Space Vehicles Directorate, Hanscom AFB, MA 01742
5
(USA) for her great support with the model MODTRANTM. The CERES (MODIS) data were obtained from the NASA Langley Research Center Atmospheric Science Data Center and we would like to specially acknowledge D. Rutan from Science Systems & Applications, Inc. for his valuable help and assistance, and N. Clerbaux from the Institut Royal M ´et ´eorologique, Belgium for the support and assistance when using GERB data. Thanks also to R. Lindstrot at Institut
10
f ¨ur Weltraumwissenschaften, Freie Universit ¨at Berlin for providing MERIS data.
References
Ackerman T. P., Flynn, D. M., and Marchand, R. T: Quantifying the magnitude of anomalous solar absorption, J. Geophys. Res., 108, 4273, doi:10.1029/2002JD002674, 2003.
Cess, R. D., Zhang, M. H., Minnis, P. , Corsetti, L., Dutton, E. G., Forgan, B. W., Garber, D.
15
P., Gates, W. L., Hack, J. J., Harrison, E. F., Jing, X., Kiehl, J. T., Long, C. N., Morcrette, J.-J., Potter, G. L., Ramanathan, V., Subasilar, B., Whitlock, C. H., Young, D. F., and Zhou, Y.: Absorption of solar radiation by clouds: Observations versus models, Science, 267, 496– 499, 1995.
Charlock, T., Rose, F. G., Rutan, D. A., Alberta, T. L., Kratz, D. P., Coleman, L. H., Smith, G.
20
L., Manalo-Smith, N., and Bess, T. D.: Compute Surface and atmospheric fluxes (System 5.0). Clouds and the Earth’s Radiant Energy System (CERES), Algorithm theoretical basis document (ATBD), Release 2.2., NASA Langley Research Center, USA, 1997.
Dai, A., Karl, T. R., Sun, B., and Trenberth, K. E.: Recent trends in cloudiness over the United States, Bull. Am. Meteorol. Soc., 87, 597–606, 2006.
25
Dong, X., Minnis, P., Ackerman, T. P., Clothiaux, E. E., Mace, G. G., Long, C. N., and Lilje-gren, J. C.: A 25-month database of stratus cloud properties generated from ground-based measurements at the Atmospheric Radiation Measurement Southern Great Plains Site, J. Geophys. Res., 105, 4529–4537, 2000.
ACPD
8, 11453–11485, 2008 Radiation transfer in stratus clouds at BSRN Payerne D. Nowak et al. Title Page Abstract Introduction Conclusions References Tables Figures ◭ ◮ ◭ ◮ Back Close Full Screen / EscPrinter-friendly Version Interactive Discussion D ¨urr, B, Philipona, R., Schubiger, F., and Ohmura, A.: Comparison of modeled and observed
cloud-free longwave downward radiation over the Alps, Meteor. Z., 14, 47–55, 2005.
Fischer J., Sch ¨uller, L., and Preusker, R.: Cloud albedo and cloud optical thickness, Algorithm Theoretical Basis Document 2.1, 2.2, Freie Universit ¨at Berlin, Germany, 2000a.
Fischer J., Sch ¨uller, L., and Preusker, R.: Cloud top pressure, Algorithm Theoretical Basis
5
Document 2.3, Freie Universit ¨at Berlin, Germany, 2000b.
Hack, K. H.: Typische Wetterlagen im Alpenraum, Bundesamt f ¨ur Meteorologie und Klimatolo-gie MeteoSchweiz, Zurich, Switzerland, 2006.
Harries, J. and Crommelynck, D: The geostationary earth radiation budget experiment on MSG-1 and its potential applications, Adv. Space Res., 24, 9MSG-15–9MSG-19, MSG-1999.
10
Harries, J. E., Russell. J. E., Hanafin, J. A., et al.: The geostationary earth radiation budget project, Bull. Amer. Meteor. Soc., 86, 945–960, 2005.
Heymsfield A. J.: Microphysical structures of stratiform and cirrus clouds, in: Aerosol – Cloud – Climate Interactions, Hobbs, P. V., Academic Press Inc., California, 97–121, 1993.
Kollias, P., Fairall, C. W., Zuidema, P., Tomlinson, J., and Wick, G. A.: Observation of marine
15
stratocumulus in SE Pacific during the PACS 2003 cruise, Geophys. Res. Lett., 31, L22110, doi:10.1029/2004GL020751, 2004.
Li Z., Trishchenko, A. P., Barker, H. W., Stephens, G. L., and Partain, P.: Analyses of Atmospheric Radiation Measurement (ARM) program’s Enhanced Shortwave Experiment (ARESE) multiple data sets for studying cloud absorption, J. Geophys. Res., 104, 19 127–
20
19 134, 1999.
Li, Z.: On the solar radiation budget and cloud absorption anomaly debate, in: Observation, Theory and Modeling of the Atmospheric Variability, Zhu, X., Li, X., Cai, M., Zhou, S., Zhu, Y., Jin, F.-F., Zou, X., Zhang, M., World Scientific Publishing Co., New Jersey, 437–456, 2004. Lindberg, J. D., Lentz, W. J., Measure, E. M., and Rubio, R.: Lidar determinations of extinction
25
in stratus clouds, Appl. Opt., 23, 2172–2177, 1984.
Loeb, N. G., Kato, S., Loukachine, K., Manalo-Smith, N., and Doelling, D. R.: Angular distribu-tion models for top-of-atmosphere radiative flux estimadistribu-tion from the Clouds and the Earth’s Radiant Energy System instrument on the Terra satellite. Part II: Validation, J. Atmosph. Oceanic Technol., 24, 564–584, 2007.
30
Miloshevic, L. M., Voemel, H., Whiteman, D. N., Lesht, B. M., Schmidlin, F. J., and Russo, F.: Absolute accuracy of water vapor measurements from six operational radiosonde types launched during AWEX-G and implications for AIRS validation, J. Geophys. Res., 111,
ACPD
8, 11453–11485, 2008 Radiation transfer in stratus clouds at BSRN Payerne D. Nowak et al. Title Page Abstract Introduction Conclusions References Tables Figures ◭ ◮ ◭ ◮ Back Close Full Screen / EscPrinter-friendly Version Interactive Discussion D09S10, doi:10.1029/2005JD006083, 2006.
M ¨uller, G.: Handbuch f ¨ur Beobachter des automatischen Beobachtungsnetzes, Schweiz-erische Meteorologische Anstalt, Zurich, Switzerland, 1982.
Nowak, D., Ruffieux, D., Agnew, J. L., and Vuilleumier, L.: Detection of fog and low cloud boundaries with ground-based remote sensing systems, J. Atmos. Oceanic
5
Technol., in press,http://ams.allenpress.com/archive/1520-0426/preprint/2007/pdf/10.1175
2007JTECHA950.1.pdf, 2008a.
Nowak, D., Vuilleumier, L., Long, C. N., and Ohmura, A.: Solar irradiance com-putations compared with observations at the BSRN Payerne site, J. Geophys. Res., in press, http://www.agu.org/contents/journals/ViewPapersInPress.do?journalCode=
10
JD#id2007JD009441, 2008b.
Ohmura, A., Dutton, E. G., Forgan, B., Fr ¨ohlich, C., Gilgen, H., Hegner, H., Heimo, A., K ¨onig-Langlo, G, McArthur, B., M ¨uller, G., Philipona, R., Pinker, R., Withlock, C. H., Dehne, K., and Wild, M.: Baseline Surface Radiation Network (BSRN): New precision radiometry for climate research, Bull. Americ. Meteor. Soc., 79, 2115–2136, 1998.
15
Oreopoulos L., Marshak, A., and Calahan, R. F.: Consistency of ARESE II cloud absorption estimates and sampling issues, J. Geophys. Res., 108, 4029, doi:10.1029/2002JD002243, 2003.
Richner, H.: Grundlagen aerologischer Messungen speziell mittels der Schweizer Sonde SRS 400, Tech. Rep. 61, Federal Office of Meteorology and Climatology, Zurich, Switzerland,
20
1999.
Ruckstuhl, C.: Surface Radiation Changes and their Impact on Climate in Central Europe, Ph.D. Thesis, Diss ETH Zurich No. 17578, Switzerland, 2008.
Ruffieux, D., Nash, J., Jeannet, P., and Agnew, J. L.: The COST 720 temperature, humidity and cloud profiling campaign: TUC, Meteor. Z., 15, 5–10, 2006.
25
Rutan, D. A., Rose, F. G., Smith, N. M., and Charlock, T. P.: Validation data set for CERES surface and atmospheric radiation budget (SARB), WCRP/GEWEX Newsletter, 11, 11–12, 2001.
Sch ¨uepp, M.: Witterungsklimatologie, Klimatologie der Schweiz, Band III, Schweizerische Me-teorologische Anstalt, Zurich, Switzerland, 1979.
30
Slingo, A.: A GCM parameterization for the shortwave radiative properties of water clouds, J. Atmos. Sci., 46, 1419–1427, 1989.
ACPD
8, 11453–11485, 2008 Radiation transfer in stratus clouds at BSRN Payerne D. Nowak et al. Title Page Abstract Introduction Conclusions References Tables Figures ◭ ◮ ◭ ◮ Back Close Full Screen / EscPrinter-friendly Version Interactive Discussion and Prather, M.: Historical Overview of Climate Change, in: Climate Change 2007: The
Physical Science Basis, Contribution of Working Group I to the Fourth Assessment Report of the Intergovernmental Panel on Climate Change, Solomon, S., Qin, D., Manning, M., Chen, Z., Marquis, M., Averyt, K.B., Tignor, M., and Miller, H.L., Cambridge University Press, Cambridge, United Kingdom and New York, N.Y., USA, 93–128, 2007.
5
Sun, B. and Groisman, P. Y.: Variations in low cloud cover over the United States during the second half of the twentieth century, J. Clim., 17, 1883–1888, 2004.
Trenberth, K. E., Jones, P. D., Ambenje, P., Bojariu, R., Easterling, D., Klein Tank, A., Parker, D., Rahimzadeh, F., Renwick, J. A., Rusticucci, M., Soden, B., and Zhai, P.: Observations: Surface and Atmospheric Climate Change, in: Climate Change 2007: The Physical Science
10
Basis, Contribution of Working Group I to the Fourth Assessment Report of the Intergov-ernmental Panel on Climate Change, edited by: Solomon, S., Qin, D., Manning, M., Chen, Z., Marquis, M., Averyt, K. B., Tignor, M., and Miller, H. L., Cambridge University Press, Cambridge, United Kingdom and New York, NY, USA, 235–336, 2007.
Valero, F. P. J., Minnis, P., Pope, S. K., Bucholtz, A., Bush, B. C., Doelling, D. R., Smith Jr., W. L.,
15
and Dong, X.: Absorption of solar radiation by the atmosphere as determined using satel-lite, aircraft, and surface data during the Atmospheric Radiation Measurement Enhanced Shortwave Experiment (ARESE), J. Geophys. Res ., 105, 4743–4758, 2000.
Wang, J., Rossow, W. B., Uttal, T., and Rozendaal, M.: Variability of cloud vertical structure during ASTEX observed from a combination of rawinsonde, radar, ceilometer and satellite,
20
Mon. Weather Rev., 127, 2484–2502, 1999.
Warren S. G. and Hahn, C. J.: Clouds / Climatology, in: Encyclopedia of atmospheric sciences, edited by: Holton, J. R., Curry, J. A., and Pyle, J. A., Academic Press, 476–483, 2002. Wielicki, B. A., Barkstrom, B. R., Harrison, E. F., Lee III, R. B., Smith, G. L., and Cooper, J.
E.: Clouds and the Earth’s Radiant Energy System (CERES): An earth observation system
25
ACPD
8, 11453–11485, 2008 Radiation transfer in stratus clouds at BSRN Payerne D. Nowak et al. Title Page Abstract Introduction Conclusions References Tables Figures ◭ ◮ ◭ ◮ Back Close Full Screen / EscPrinter-friendly Version Interactive Discussion
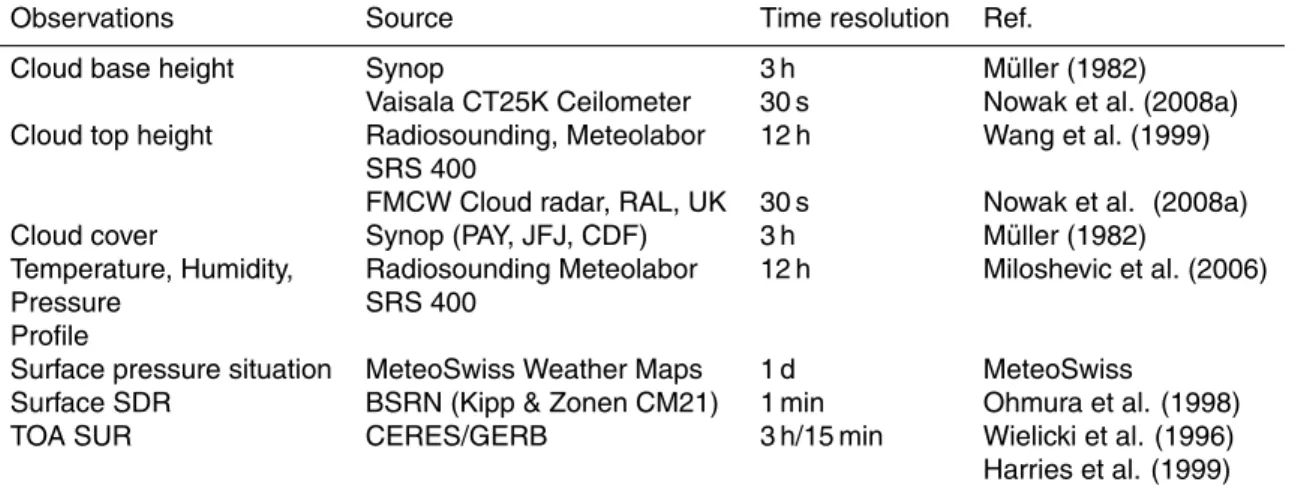
Table 1. List of the used variables with source information, time resolution, and reference for
further details.
Observations Source Time resolution Ref.
Cloud base height Synop 3 h M ¨uller (1982) Vaisala CT25K Ceilometer 30 s Nowak et al. (2008a) Cloud top height Radiosounding, Meteolabor 12 h Wang et al. (1999)
SRS 400
FMCW Cloud radar, RAL, UK 30 s Nowak et al. (2008a) Cloud cover Synop (PAY, JFJ, CDF) 3 h M ¨uller (1982)
Temperature, Humidity, Radiosounding Meteolabor 12 h Miloshevic et al. (2006) Pressure SRS 400
Profile
Surface pressure situation MeteoSwiss Weather Maps 1 d MeteoSwiss
Surface SDR BSRN (Kipp & Zonen CM21) 1 min Ohmura et al. (1998) TOA SUR CERES/GERB 3 h/15 min Wielicki et al. (1996)
ACPD
8, 11453–11485, 2008 Radiation transfer in stratus clouds at BSRN Payerne D. Nowak et al. Title Page Abstract Introduction Conclusions References Tables Figures ◭ ◮ ◭ ◮ Back Close Full Screen / EscPrinter-friendly Version Interactive Discussion
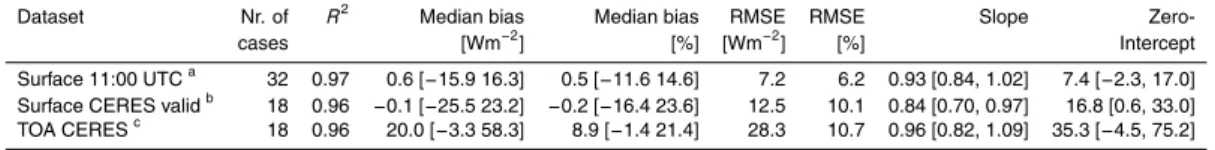
Table 2. Statistic indicators of the agreement between model simulation and observations for
the datasets at surface and top of atmosphere (TOA): (a) surface diffuse shortwave downward radiation (SDR) measurements at 11:00 UTC, (b) surface SDR measurements at the CERES observation time for possible CERES TOA observation matching, and (c) TOA reflected short-wave radiation from CERES. For each dataset: number of cases, correlation (R2), median bias in Wm−2and % (the 2.5 and 97.5 percentiles are indicated in brackets), RMSE in Wm−2and %, slope and zero-intercept of model to observation linear regression (95% confidence intervals for the slope and zero-intercept are indicated in brackets).
Dataset Nr. of R2 Median bias Median bias RMSE RMSE Slope
Zero-cases [Wm−2] [%] [Wm−2] [%] Intercept
Surface 11:00 UTCa 32 0.97 0.6 [−15.9 16.3] 0.5 [−11.6 14.6] 7.2 6.2 0.93 [0.84, 1.02] 7.4 [−2.3, 17.0] Surface CERES validb 18 0.96 −0.1 [−25.5 23.2] −0.2 [−16.4 23.6] 12.5 10.1 0.84 [0.70, 0.97] 16.8 [0.6, 33.0] TOA CERESc 18 0.96 20.0 [−3.3 58.3] 8.9 [−1.4 21.4] 28.3 10.7 0.96 [0.82, 1.09] 35.3 [−4.5, 75.2]
ACPD
8, 11453–11485, 2008 Radiation transfer in stratus clouds at BSRN Payerne D. Nowak et al. Title Page Abstract Introduction Conclusions References Tables Figures ◭ ◮ ◭ ◮ Back Close Full Screen / EscPrinter-friendly Version Interactive Discussion
Table 3. Median, minimum and maximum values of the 18 valid CERES cases for the
ab-sorbance A and transmittance τ in the atmospheric layers below cloud (bcl), in cloud (cld), above the cloud (acl) and the entire atmosphere from surface to toa (all). The same information is given for the reflectance r, at the surface (sfc) the top of the cloud (cto) and the top of the atmosphere (toa).
A, median min max τ,median min max r, median min max bcl 0.009 >0.00 0.02 0.97 0.94 0.99 sfc 0.19 0.16 0.27
cld 0.07 0.04 0.10 0.29 0.15 0.39 cto 0.70 0.63 0.80
acl 0.18 0.13 0.23 0.78 0.72 0.86 – – – –
ACPD
8, 11453–11485, 2008 Radiation transfer in stratus clouds at BSRN Payerne D. Nowak et al. Title Page Abstract Introduction Conclusions References Tables Figures ◭ ◮ ◭ ◮ Back Close Full Screen / EscPrinter-friendly Version Interactive Discussion 50 100 150 200 50 100 150 200 y i = 0.837xi + 16.77 RMSE = 12.5 (10.1%) model [Wm −2 ] observation [Wm−2]
Fig. 1. Modeled versus observed surface diffuse shortwave downward radiation (SDR), 18
cases each calculated at the time of CERES satellite observation over Payerne. The correlation is on the order of 0.96.
ACPD
8, 11453–11485, 2008 Radiation transfer in stratus clouds at BSRN Payerne D. Nowak et al. Title Page Abstract Introduction Conclusions References Tables Figures ◭ ◮ ◭ ◮ Back Close Full Screen / EscPrinter-friendly Version Interactive Discussion 250 300 350 400 250 300 350 400 y i = 0.957xi + 35.3 RMSE = 28.3 (10.7%) model [Wm −2 ] observation [Wm−2]
Fig. 2. Modeled versus observed top of atmosphere reflected shortwave radiation, 18 cases
each calculated at the time of CERES satellite observation over Payerne. The correlation is on the order of 0.97.
ACPD
8, 11453–11485, 2008 Radiation transfer in stratus clouds at BSRN Payerne D. Nowak et al. Title Page Abstract Introduction Conclusions References Tables Figures ◭ ◮ ◭ ◮ Back Close Full Screen / EscPrinter-friendly Version Interactive Discussion
below cloud in cloud above cloud total 0 0.05 0.1 0.15 0.2 0.25 0.3 Absorbance Atmospheric layer
Fig. 3. Box plots for shortwave absorbance in the atmospheric layer between surface and cloud
base (below cloud), within the cloud (in cloud), between cloud top and top of the atmosphere (above cloud) and for the entire atmosphere (total). The black box plots represent absorbance for the 18 cases with CERES time of observation, the blue box plots represent the absorbance for the 32 cases calculated for 11:00 UTC (radiosounding launch time).
ACPD
8, 11453–11485, 2008 Radiation transfer in stratus clouds at BSRN Payerne D. Nowak et al. Title Page Abstract Introduction Conclusions References Tables Figures ◭ ◮ ◭ ◮ Back Close Full Screen / EscPrinter-friendly Version Interactive Discussion
below cloud in cloud above cloud total 0 0.2 0.4 0.6 0.8 1 Transmittance Atmospheric layer
Fig. 4. Box plots for shortwave transmittance in the atmospheric layer between surface and
cloud base (below cloud), within the cloud (in cloud), between cloud top and top of the at-mosphere (above cloud) and for the entire atat-mosphere (total). The black box plots represent transmittance for the 18 cases with CERES time of observation, the blue box plots represent the transmittance for the 32 cases calculated for 11:00 UTC (radiosounding launch time).
ACPD
8, 11453–11485, 2008 Radiation transfer in stratus clouds at BSRN Payerne D. Nowak et al. Title Page Abstract Introduction Conclusions References Tables Figures ◭ ◮ ◭ ◮ Back Close Full Screen / EscPrinter-friendly Version Interactive Discussion 0.8 1 1.2 1.4 1.6 0 10 20 a
clout top height [km]
∆ SUR TO A [%] 0.2 0.4 0.6 0 10 20 b clout extent [km] ∆ SUR TO A [%]
Fig. 5. Relative differences of modeled minus observed SURtoafor the 18 CERES cases com-pared to the cloud top height (a) and the cloud vertical extent (b).