Development and Implementation of an Inventory Location Optimization
Algorithm for Improved Distribution Center Picking Rates
by
Dov Hochsztein
Bachelor of Science in Mechanical and Aerospace Engineering
Rutgers School of Engineering, Rutgers University, 2016
SUBMITTED TO THE DEPARTMENT OF MECHANICAL ENGINEERING IN PARTIAL
FULFILLMENT OF THE REQUIREMENTS FOR THE DEGREE OF
MASTER OF ENGINEERING IN ADVANCED MANUFACTURING AND DESIGN
AT THE
MASSACHUSETTS INSTITUTE OF TECHNOLOGY
SEPTEMBER 2018
2018 Dov Hochsztein. All rights reserved.
The author hereby grants MIT permission to reproduce and distribute publicly paper and
electronic copies of this thesis document, in whole or in part, in any medium now known or
hereafter created.
Signature of Author...
D
Certified by ...
S ig n a
Signature redacted
Dov Hochsztein
epartment of Mechanical Engineering
August 10, 2018
ture
redacted
...
Davidl Hardt
Ralph E. and Eloise F. Cross Professor in Mechanical Engineering
Thesis Advisor
Accepted by ...
.. ...Siqjnature redacted
%/ Rohan AbeyaratneQuentin Berg Professor of Mechanics, Mechanical Engineering
Chairman, Committee for Graduate Students
MASSACHUSETTS INSTITUTEOF TECHNOLOGY
OCT 0.2 2018
LIBRARIES
This page was intentionally left blank.
Development and Implementation of an Inventory Location Optimization
Algorithm for Improved Distribution Center Picking Rates
by
Dov Hochsztein
Submitted to the Department of Mechanical Engineering on August 10, 2018 in Partial Fulfillment of the requirements for the Degree of Master of Engineering in Advanced
Manufacturing and Design
ABSTRACT
A strategic roadmap was developed for Waters Corporation detailing four central themes
and twelve project proposals to direct future projects and innovations at the company over the next 3-10 years. Specific attention was paid to the growing need at Waters to shift processes from manual to automatic and to convert data collection and usage techniques from analog to digital. Pilots of two projects, Warehouse RFID-based Dock Door System and Inventory Relocation, were developed in conjunction with the preparation of the roadmap in order to provide proofs of concept and technology and to serve as reference points for future projects. The Inventory Relocation Pilot Project is discussed in this thesis.
An automatic inventory relocation tool was developed to recommend product locations within Waters' Global Distribution Center (GDC). The tool was configured to allow full region reorganization, relocation of a specified number of stock keeping units, and recommendation of put-away locations for incoming shipments. The pilot was constrained to the high bay area at
GDC due to the amount of available data for that region, but was designed to be easily
extendable to include other regions in GDC and other Waters distribution centers.
Simulations were run that showed greater than 40% reductions in the objective function that correspond to approximately 5% less time spent picking orders by material handlers, given the amount of available supporting data.
Thesis Supervisor: David Hardt
Title: Ralph E. and Eloise F. Cross Professor in Mechanical Engineering
This page was intentionally left blank.
ACKNOWLEDGMENT
I would like to take the opportunity to extend thanks to those who helped make this possible:
To Gabriel Kelly and Lichung Pan for their constant guidance and availability at Waters Corporation in seeing this project through to completion.
To Kathleen Wright, Ryan Cashman, Kwaku Manu-Tawiah and the team at GDC for opening up their home to us and helping us with anything we needed.
To everyone at Waters Corporation for their assistance throughout this project, including Dan Welch and Jim McPherson for their support in making the collaboration between MIT and
Waters possible.
To my teammates, Rushil Batra and Akshay Harlalka for their collaboration, ingenuity, and endless discussions.
To the rest of the M.Eng. crew for a year I will never forget.
To our advisor, David Hardt for keeping us on track and reminding us to be selfish.
To Jose Pacheco for welcoming us to the M.Eng. Program and leading us for the past 12 months.
To my parents and siblings for supporting me in everything I do.
To my wife, Talia, for keeping me sane all year long.
This page was intentionally left blank.
TABLE OF CONTENTS
A BST RAC T ... 3 A C K N O W LEDG M ENT ... 5 TA BLE O F C O N TENTS ... 7 LIST O F FIG UR ES ... I I LIST O F TA BLES ... 12 IN TR O D UC TIO N ... 13 1.1 PROBLEM STATEMENT...
13
1.2 M OTIVATION ... 13 1.3 O BJECTIVE ... 13 1.4 TASK D IVISION ... 13 1.4.1 Corporate Roadm ap ... 13 1.4.2 Pilot Projects ... 14 1.5 RELATED W ORK ... 14 1.6 THESIS STRUCTURE ... 15 BAC K G R O UN D ... 162.1 W ATERS CORPORATION: CORPORATE PROFILE ... 16
2.2 W ATERS - M IT A LLIANCE ... 16
2.3 A DVANCED M ANUFACTURING CENTER ... 17
2.4 G LOBAL D ISTRIBUTION CENTER (G DC) ... 17
2.5 W ATERS PRODUCTS ... 18
2.5.1 H igh Pressure Liquid Chromatography Instrum ents ... 18
2.5.2 M ass Spectroscopy Instrum ents ... 19
2.5.3 Consum ables ... 19
STRA TEG IC R O A D M A P ... 20
3.1 THE N EED ... 20
3.2 O UTLOOK ... 21
3.3 THEMES ... 22 3.3.1 O ptim ization ... 22 3.3.2 D igitalization... 22 3.3.3 A utom ation ... 23 3.3.4 Standardization ... 23 3.4 PROJECT PROPOSALS ... 23
3.4.1 D istribution N etw ork Redesign ... 25
3.4.2 Lot Sizing Optimization for Lot-Controlled Consumables ... 27
3.4.3 Box Erection A ssistive Technologies ... 29
3.4.4 Inventory Relocation w ithin DC ... 30
INVENTORY RELOCATION PROBLEM... 32
4.1 PROJECT O VERVIEW AND PROBLEM STATEMENT ... 32
4.2 TASK D IVISION ... 34
4.3 O BJECTIVE FUNCTION ... 35
4.3.1 Cost Functions ... 36
4.3.2 Constraints ... 39
4.4 PLACEM ENT A LGORITHM ... 40
4.4.1 A lgorithm O ptim ality... 44
4.4.2 Sum m ary of N ecessary A ssum ptions ... 47
INVENTORY RELOCATION IMPLEMENTATION... 50
5.1 PYTHON 3.6 ENVIRONMENT ... 50
5.1.1 O pen Source D evelopm ent ... 51
5.1.2 Fully Supported Libraries ... 51
5.2 M ICROSOFT EXCEL D ATASHEETS ... 53
5.2.1 Static D ata... 54
5.2.2 Sem i-Static D ata ... 56
5.2.3 Dynam ic D ata ... 58
5.2.4 O utput D ata... 59
5.3 D EVELOPED SCRIPTS... 60
5.3.1 Update Sem i-Static Data... 60
5.3.2 Inventory Relocation Tool ... 61
5.4 IMPLEMENTED TOOLS ... 62
5.4.1 Section Specific Inventory Relocation... 62
5.4.2 Cost of Situation Estim ation ... 62
5.4.3 Full Inventory Relocation ... 63
5.4.4 Replace X Relocation ... 63
5.4.5 Recom m ended Put-Aw ay ... 63
5.5 FLEXIBILITY FOR FUTURE IMPROVEMENTS ... 64
5.5.1 Handling of M issing Data... 64
5.5.2 N ew Storage Areas in GDC ... 66
5.5.3 Extension to A DC and EDC ... 66
SA P INTEG RA TIO N ... 68
6.1 O PTIONS... 68
6. 1.1 Offline ... 68
6.1.2 Autom atic... 69
6.1.3 Reim plem entation ... 69
6.2 CURRENT SOLUTION ... 70
6.3 PLAN FOR M OVING FORWARD ... 70
RESULTS AND DISCUSSION ... 71
7.1 IMPLEMENTATION ON HIGH BAY A REAS ... 71
7.2 RELOCATION SIMULATION... 71
7.2.1 Tim e Savings A nalysis ... 72
C O NC LUSIO N S...75
8.1 STRATEGIC ROADMAP ... 75
8.2 INVENTORY RELOCATION PROJECT ... 75
FUTU RE W O RK... 77
9.1 PROJECT EXTENSIONS ... 77
9.1.1 Extend to Rest of GDC ... 77
9.1.2 Interface Recommended Shipment Locations with RFID Technology ... 77
9.1.3 Extend to EDC and ADC ... 78
9.1.4 Recommended Relocation During Picking/Receiving ... 78
9.1.5 Use Code Skeleton to Inform Other Optimization Problems ... 78
9.2 ALGORITHM IMPROVEMENT ... 78
9.2.1 Relax Constraint of SKU Specific Location Costing ... 79
9.2.2 Refinement of Cost Analysis ... 79
9.2.3 Refinement of Objective Function... 79
9.2.4 Improve Placement Algorithm ... 80
9.2.5 Include Routing Algorithm ... 80
9.3 INTERFACE IMPROVEMENTS ... 80
9.3.1 Develop SAP-Python GUI... 80
9.3.2 Develop Platform for Algorithm Refinement ... 81
REFERENCES... 82
APPENDIX - PYTHON CODE ... 84
LIST OF FIGURES
Figure 1 - C orporate R oadm ap... 25
Figure 2 - Process Flow Diagram: Picking [8]... 34
Figure 3 - Step-wise distribution of time for Picking, Packaging & Shipping [8]... 34
Figure 4 - Placement Algorithm Flow Chart Representation... 41
Figure 5 - Spyder Developm ent Interface ... 51
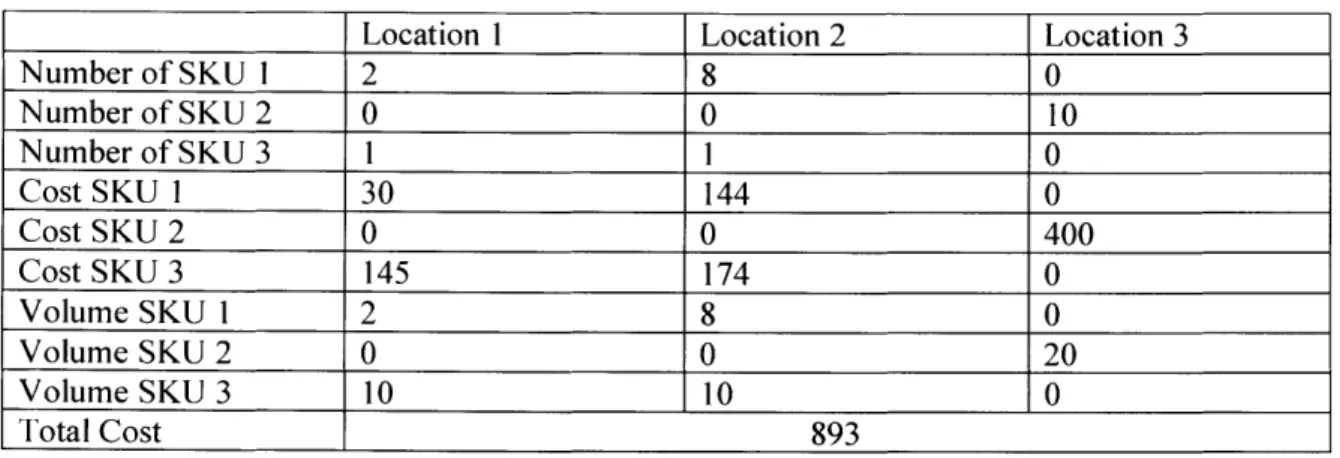
Figure 6 - Inventory Relocation Tool Environment Overview ... 54
Figure 7 - Update Semi-Static Data Script Flow... 61
Figure 8 - Inventory Relocation Tool Script Flow ... 62
LIST OF TABLES
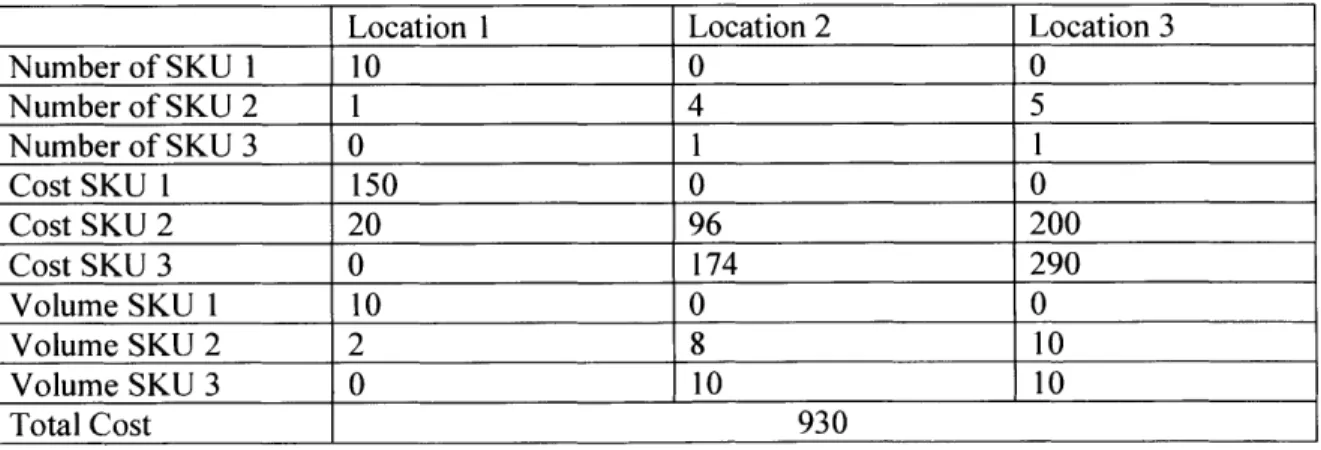
T able I - E xam ple 1 SK U s...42
Table 2 - Exam ple 1 Locations ... 42
Table 3 - Example 1 Results Following Pure, Frequency-Based Placement ... 42
Table 4 - Example 1 Results Without Following Pure, Frequency-Based Placement... 43
T able 5 - Exam ple 2 SK U s... 46
Table 6 - Exam ple 2 Locations ... 46
Table 7 - Example 2 Results Following Placement Algorithm... 46
Table 8 - Example 2 Results Without Following Placement Algorithm... 47
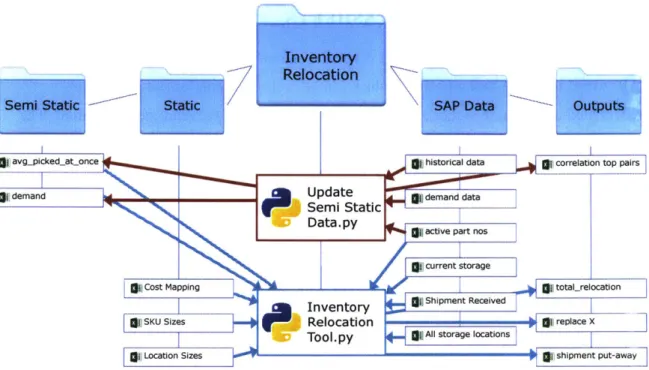
Table 9 - Sensitivity Analysis of Packing Fraction... 56
Table 10 - Time Savings Analysis Simulation Results ... 73
CHAPTER 1
INTRODUCTION
1.1 PROBLEM STATEMENT
The purpose of this project is to find opportunities for process improvement within various business verticals under the umbrella of digitalization and automation. The team was expected to find opportunities, develop and present them, and research and implement a pilot project on one or more of them.
The focus of this thesis is the implementation of an Inventory Relocation Tool capable of recommending new storage layouts for a distribution center based on product data.
1.2 MOTIVATION
The motivation for an Inventory Relocation Tool stems from a lack of regarding the stock in distribution centers. Furthermore, due to the daily need to visit different stock storing locations in a distribution center to fulfil orders, optimizing the choice of storage locations is crucially important. Suboptimal storage layouts can lead to many wasted man-hours of traveling,
searching, and maneuvering associated with handling material. It is therefore valuable to develop a tool that automatically calculates and recommends location improvements to distribution center managers.
1.3 OBJECTIVE
The objective for Inventory Relocation is to develop a tool that automatically
recommends new storage layouts based on the current layout, product data, and storage location data, which increases the efficiency of the warehouse by shortening the amount of time
associated with visiting the storage locations.
1.4 TASK DIVISION
1.4.1 Corporate Roadmap
The corporate roadmap was developed as a group. The team deliberated on fundamental themes and considered multiple projects in order to construct a corporate plan for future projects.
Individual projects were developed by individual members of the team and those proposals appear separately in each thesis.
1.4.2 Pilot Projects
The team developed and implemented two pilot projects, a Warehouse RFID-based Dock Door System and an optimal Inventory Relocation problem. With two projects and three
members, the team took a dedicated/floater approach toward allocating its resources. The author of this thesis participated and contributed during the general planning and research phase of the RFID project, but was otherwise dedicated exclusively to the Inventory Relocation project. Likewise, A. Harlalka participated in the ideation and planning phase of the Inventory
Relocation project, but was otherwise dedicated exclusively to the RFID Project. On the other hand, R. Batra was engaged directly on both projects and conducted research, analysis, and testing in service of both objectives. This hybrid approach between direct collaboration and task division was crucial to the success of both projects within the time constraints of the shortened project timeline.
1.5 RELATED WORK
Lots of research has been conducted in the area of warehouse optimization. While most of the works that exist do not apply directly to this problem, many are related, and they informed some of the development and formulations of the methods in this thesis.
In terms of the optimal location for a distribution center, the so called "Uncapacitated Warehouse Location Problem" (UWLP) has been studied extensively. It is well known that the general UWLP is NP-hard, meaning that solutions are non-deterministic and can be verified in polynomial time [1], and various attempts at solving it heuristically have been made [2].
Warehouse optimization has also been studied. It has been suggested that for automated warehouse systems with grid-like storage location arrays, genetic algorithms can be used to optimally place items [3]. Approaches have also been studied to consider class-based storage [4]
and consolidation [5]. There are also discussions of using linear programming techniques [6].
Optimal methods for order picking have been studied as well [7].
1.6 THESIS STRUCTURE
The remainder of this thesis is divided into three sections. The first section, containing the second and third chapters introduce Waters Corporation and discuss the Proposed Strategic
Roadmap. The next section, containing the fourth, fifth, and sixth chapters, discusses the implementation of the Inventory Relocation Project, including the mathematical formulations, technical implementations, and interfaces for existing enterprise software. The final section, containing the final three chapters, discusses the results of the Inventory Relocation Project as well as the project conclusions and future work.
CHAPTER 2
BACKGROUND
This section introduces Waters Corporation, the host of this thesis project and the primary subject of the corporate and technical analyses. It details the history of the partnership between Waters and MIT. The chapter also introduces Waters' manufacturing business unit, its
Massachusetts based distribution center, and the main elements of its technology and product lines.
2.1 WATERS CORPORATION: CORPORATE PROFILE
Founded in 1958 by James Waters, Waters Corporation is a $2.2 billion publicly traded corporation headquartered in Milford, Massachusetts. It is a global leader in complementary analytical technologies like mass spectroscopy, liquid chromatography, rheometry and microcalorimetry with presence in over 125 countries [11], [12].
The company boasts of an advanced design division, sprawling manufacturing facilities and service network focused on ultra-performance liquid chromatography (UPLC), high-performance liquid chromatography (HPLC), chromatography columns and chemistry products, mass spectrometry (MS) systems, thermal analysis and rheometry instruments. Waters employs over 7200 people worldwide. The company has segregated its operations into two separate divisions: Waters Division and TA Instruments [12].
The Waters Division is responsible for design, development and production of UPLC, HPLC and MS instruments and consumables which are used in a broad range of industries to measure the chemical, physical and biological composition of materials. Their products are primarily used by pharmaceutical, life science, biochemical, industrial, academic and
government organizations. Meanwhile, TA instruments is responsible for the thermal analysis, rheometry and microcalorimetry instruments which are used for determining the applicability of various chemical substances used in industrial, consumer goods and health care products [12].
2.2 WATERS
-
MIT ALLIANCE
Incorporated in 2013, Waters - MIT Alliance has led to multiple projects in areas ranging
from Research & Development to Manufacturing to Operations to Supply Chain. Every
academic year, a team of student consultants from the Master of Engineering in Advanced Manufacturing & Design program at MIT come in to augment various teams at Waters realize their strategic goals and at times, help them set a vision for the future.
The projects have resulted in patent-worthy scientific implementations and have made it possible to bring fresh innovative ideas into the scientific legacy existing at Waters. The
company benefits from the out-of-the-box thinking and an outsider's perspective to their challenges. In addition to the student team, a faculty member provides the necessary subject matter expertise required to take these ideas forward. Meanwhile, the students develop systemic thinking by getting a holistic view of the business and gaining unparalleled industry experience.
2.3 ADVANCED MANUFACTURING CENTER
Located in Milford, MA, the Waters Advanced Manufacturing Center is a state-of-the-art manufacturing facility which houses the Advanced Instrument Assembly & Accessory Kitting Operations area, a Class 10000 clean room and the Global Machining Center [10].
The Advanced Instrument Assembly & Accessory Kitting Operations area is responsible for assembling the standalone kits and the HPLC instruments. The 8,500 sq. ft. clean room produces optics, micro valves and critical parts for Waters products [10].
The Global Machining Center is responsible for manufacturing various components like columns and valves which are critical to the performance of Waters instruments for distribution worldwide. Around 85% of manufacturing is outsourced to contract manufacturers; however, high- precision components and parts for New Product Development (NPD) are manufactured in this facility. The process flow in the factory is primarily job-shop in nature with different areas corresponding to turning and milling operations. The valve cell and the column area are exceptions for the existent flow is product based [10].
2.4 GLOBAL DISTRIBUTION CENTER (GDC)
Waters' worldwide distribution is centralized in three primary distribution centers across the world, the Asian Distribution Center (ADC) in Singapore, the European Distribution Center
(EDC) in the Netherlands, and the Global Distribution Center (GDC) in Franklin, Massachusetts. GDC handles most of Water's outbound shipments, sending over 1500 lines per day both
directly to customers and to other distribution centers as well.
In October 2017, Waters moved its Global Distribution Center into its current home in Franklin, MA. GDC is currently at a facility with 56,000 square feet of space outfitted with various types of storage, ranging from high bay areas, to standard shelving, to refrigerator and freezer locations in order to maintain over 11,000 distinct stock keeping units in over 20,000 separate storage locations. GDC has two separate loading docks and employs the traditional "flow-through" warehouse model. While GDC has dedicated staff for receiving, international and domestic picking, and international and domestic packing, many of its experienced material handlers are cross trained to enable flexibility when confronting different order patterns and daily, quarterly, and seasonal trends.
2.5
WATERS PRODUCTS
This section introduces the products which form the most significant part of product line-up for Waters.
2.5.1 High Pressure Liquid Chromatography Instruments
High Liquid Chromatography (LC) is a technique to separate a substance/material into its constituents by using a pressurized liquid solvent. The most significant markets for LC
instruments are the life sciences and pharmaceutical industries which require the technique to identify new drugs, test the purity of certain pharmaceuticals and diagnose diseases. Waters manufactures highly customizable LC instruments for the end user. There are various configurations and degrees of automation which the customer can choose from, starting with component configured systems for research and teaching applications to fully automatic systems which can provide much higher throughputs in industrial settings [13].
In 2004, Waters introduced a novel technology called the Ultra-performance Liquid Chromatography (UPLC). This technology enabled the use of very small but uniform sized particles as a packing material for its columns. These packed columns when used with the Acquity UPLC system helped the customers separate the materials more reliably and achieve the separations in a faster time frame. These systems are Waters' current workhorses in the LC instrument segment [13].
2.5.2
Mass Spectroscopy Instruments
Mass Spectroscopy (MS) primarily allows users to identify unknown
compounds/materials by measuring the weights of the molecules that get converted into ions during the process [13]. In September 1997, Waters transformed itself from a minor player in the
MS instrument industry to a leader by acquiring MicroMass Ltd. based in Manchester, England. MS is frequently used with other analytical techniques like LC or gas chromatography for drug
testing, nutritional safety testing and environmental testing procedures [13].
2.5.3
Consumables
For LC, the primary consumables are columns, which are essentially steel tubes packed with the separation media [13]. These columns have a much shorter life cycle than instruments and are typically replaced at regular intervals. The packing material for the columns is typically made from Silica or Polymeric resins. During the liquid chromatography process, the sample is introduced into the column at a high pressure and its subsequent interaction with powder initiates the separation[ 13].
CHAPTER 3
STRATEGIC ROADMAP
This section details the strategic roadmap that was researched and developed during the
exploration phase of the 2018 Waters - MIT Alliance project. While the complete roadmap was
submitted to Waters in a unified document, the proposed projects are listed below to help understand the significance of the roadmap, themes and some of the ideas.
3.1 THE NEED
The major markets served by Waters Corporation include pharmaceutical, food and materials. However, the majority of revenue (over 50%) is derived from the pharmaceutical industry slated to grow at 6% for the next few years [14]. This requires the company to ramp up production volumes amidst increasing cost pressures from the market to continue to beat benchmark indices. The scenario in the industry is changing rapidly owing to the high-growth markets in Asia, lingering fears of protectionism and the economic conditions in Europe. Waters requires a strategic overhaul to provide them the necessary edge and make their value chain agile enough to respond to any event effectively.
Traditionally, Waters has led the industry owing to its high-quality instrument portfolio that has resonated with the customers spanning from the pharmaceutical industry to the food industry. The competition is now catching up by providing innovative designs with a shorter turnaround time by incorporating feedback from detailed customer studies. For instance, some of the competitors have focused more on enhancing the overall user interface (UI) of their
instruments by inclusion of smooth touch-displays whereas most of Waters instruments have an
LCD screen controlled by buttons. With the passage of time, the customer needs have evolved
towards UI being a major buying factor in addition to the all-round performance. The design teams should scout for such drifts in customer requirements and work towards adapting the next generation products to the same.
Industry experts cite the development of Artificial Intelligence as the game-changer in this decade. A plethora of applications of the technology has altered the way the businesses
operate. The ever-increasing complexity of the supply chain has long warranted a systemic
overhaul to prune inefficiencies and work towards productivity improvements. It is
recommended that the supply chain of the future be quick to adapt and pivot according to the mood of the market. The latest technological revolution can aid in better capture and utilization of data for effective decision making. However, these technologies are only as good as data input for analysis which makes it all the more important to streamline data collection procedures and use technology there as well. For instance, the use of Automatic Identifications (Auto-ID) technologies in conjunction with machine learning and data science can unearth hidden
inefficiencies in the supply chain by improving visibility of product and information flow. The first set of checkpoints in transition to the organization of the future would be to revisit the business processes and explore use cases of latest technological trends. This should be followed by a detailed technical feasibility as well as economic viability study ensuring that the suggested alterations are in line with the strategic goals. The MIT team during the exploratory phase interacted with different teams at Waters to take the first step in rethinking the way business is conducted and laid the strategic roadmap presented in this chapter. The following sections discuss about the importance of certain themes and how they fit into the roadmap and subsequently touches upon each idea in detail.
3.2
OUTLOOK
The purpose of this roadmap is to document the findings of the exploration phase in a way that identifies and directs future projects at Waters Corporation. After considering the observations and points of view of various managers, the MIT team weighed the different goals and pain points to find an overall direction for the next three to ten years.
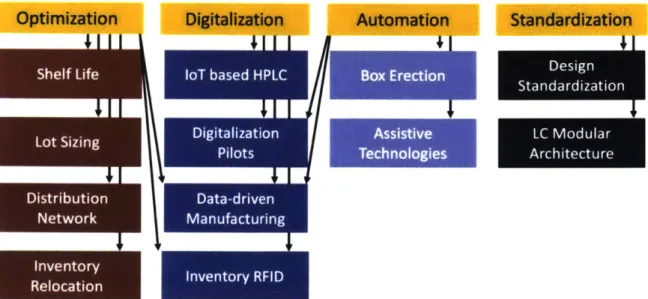
The team highlighted four overarching themes that encompass the direction that Waters seems to want to move toward as well as twelve specific high-value projects that fit into those themes and address some of Waters' most crucial needs. Many of these projects are pilot projects envisioned to bring new approaches, thought processes, and technology into Waters' field of vision in order to drive and inform other possibilities for growth and improvement.
As this roadmap is designed to illuminate future projects, it can potentially serve as a menu for teams of interns or MIT M.Eng. teams to select projects. Guided by the leadership team at Waters, two of the projects, Inventory Management using RFID and Inventory Relocation were selected as pilots for this year's team.
3.3 THEMES
The strategic roadmap is centered around four central themes: Optimization, Automation, Digitalization, and Standardization. These have been identified as key areas for improvement across all business areas.
3.3.1 Optimization
Perhaps the simplest objective is for Waters to optimize aspects of its processes. For a very long time, Waters has relied on its industry leading products and quality to ensure consistent consumption, profitability, and growth. As most of Waters' projects sell at extremely high margins, it has been very easy for the company to sit comfortably atop the market and sustain its high level of success.
However, a recent shift in the mindset of Waters' management is in favor of working to improve process flows and efficiencies to increase product quality and reduce direct and indirect costs. It is extremely important for Waters to optimize whatever it can so that it is better
equipped to keep pace with its competitors in this age of continuously evolving technology and markets.
3.3.2 Digitalization
Large corporations like Waters face challenges in sufficiently collecting, storing, maintaining, and utilizing the massive amount of data that describes its day-to-day processes. Business specific data is crucial for decision makers to carve out the competitive strategy and streamline operations. Managers across all of Waters' business units need to be able to monitor the activity and availability of their resources, machines, and materials, and the task of handling all of these concerns becomes increasingly difficult as the company grows.
On one hand, this theme involves an effort to collect more digital data from various parts of the company. And it is equally important that the data collected using conventional methods be ideal for digital processing and use. On the other hand, Waters is already collecting
tremendous amounts of information in many of its business units. Effort is necessary to find uses for data that is already collected and continue to find ways to make the information profitable.
3.3.3
Automation
Currently, Waters' experiences tremendous waste through manual tasks. From repetitive physical tasks like box erection to tedious computer tasks like data entry and manual analytics, thousands of man-hours are spent doing tasks that don't necessarily require the attention of human staff members. While it is not the intention of the corporation to downsize its staff and lay off its workers, Waters still has room to grow by enabling its workers to spend more time on value-adding activities. Machines have the power to augment the ability of humans and allow them to perform more effectively.
3.3.4 Standardization
The final theme is focused on unifying aspects of Waters' business. As with many corporations, the larger Waters' grows, the more difficult it becomes to ensure that output results of work in many business areas is sufficiently homogeneous.
It was decided that effective standardization would be ensured if it's included in the upstream processes like product design. Teams responsible for design are often so pressed by their release deadlines that individual parts of the teams end up diverging in direction from other parts. Without time to realign the entire teams, the resulting work ends up with aspects from many different perspectives that do not have common features. Having processes, protocols, and component designs that do not share any portions results in increased work for staff and
customers who have to deal with those protocols, as well as larger families of parts and documents to support the wide variety of entities. It is therefore proposed that making concentrated, team-wide initiatives to introduce strategic standardizations to homogenize the output of the business units will bring great value to the corporation.
3.4 PROJECT PROPOSALS
In service of the roadmap and its themes, twelve project proposals were prepared, four of which appear in this thesis, with the rest distributed between Batra [8] and Harlalka [9]. The MIT team brainstormed multiple ideas across the central themes and met with the key stakeholders in different departments to learn about their problems in more detail. It is believed that streamlining the existing business processes would be the first step in this roadmap.
Under the Optimization theme, four main ideas were considered: inventory relocation within DC, distribution network redesign, redefining shelf life to reduce scrap and determining optimal lot sizes. The team believes that an algorithm for optimal location of the inventory in warehouse could help GDC reduce its costs. Similarly, after learning that Waters' current distribution network involves significant back and forth shipping, the team believes that there could be an opportunity to optimize the current network, especially given the fact that freight costs Waters $40 million dollars each year. A meeting with the demand planning team resulted in the generation of the other project ideas based on their recommendations. One of their
suggestions involved evaluating the potential of lengthening the expiration periods for certain products while the other sought to determine the optimal lot sizing structure by analyzing customer behavior and balancing trade off with manufacturing costs. It is believed that these ideas can be augmented by better quality data that can be analyzed to unearth inefficiencies.
Digitalization of some of their processes would prove essential for getting access to high fidelity data. This theme encompassed four main ideas: data-driven manufacturing, digitalization pilots for manufacturing and assembly, inventory tracking using RFID, and loT-based HPLC system architecture. During the MIT team's interview with the manufacturing team, it was learned that many machines in the shop floor were "MTConnect ready" referring to the common data protocol shared by these machine tools. By leveraging the capability of MTConnect, the team believes that a dashboard representing the real time activity on the shop floor could be
created for the shop manager, thus saving him time to inspect shop operations physically. During the team's visit to the shop floor, it was also learned that certain valuable shop floor metrics were being calculated manually. The team suggested shifting to digital methods of measurement and
recommended the Digital Factory Kit offered by Tulip as a possibility. The visit to GDC, where the team observed the painstaking process of scanning individual items, convinced them of the
potential of using RFID for inventory tracking. Similarly, learning about the intricacies in capturing consumer data led the team to propose the idea of introducing an IoT Based HPLC System Architecture. In addition to better data, it's required to augment the workforce with necessary machines to improve productivity.
To ensure that humans work only on value-adding activities, certain parts of the
processes need to be automated. Within this broad theme of Automation, the team proposed two ideas: box erection technologies and assistive technologies for material handlers in GDC. The
team discovered that the lack of communication between TrackWise & SAP necessitated manual checks for inventory levels of raw material for LC columns. Automating the raw material as part of the larger theme of automation could help shorten the effective lead time. In a similar manner, automated box erection technology could help reduce the time required for the material handler to package and ship orders. It's also known that these improvements can only be sustained in the long term if the processes are standardized.
Within the Standardization theme, two main ideas were proposed: design standardization and modular design of HPLC system architecture. The design standardization idea focused on reducing inconsistency in product architecture that lead to greater assembly and service times. Meanwhile, the modular design aspect focused on creating a common rack architecture for LC equipment that would allow for independent disassembly of the individual modules.
The Roadmap is shown in Figure 1:
Optimization
Digitalization
Automation
Standardization
Figur 1 -orpoateeRadma
3.4.aizaio Distribui NeLCr Redesigr
Cuoet Sizne
Watrscuretl sens Piloxt l $4 echnlologieasl ofegt Ayh ter
Dnrcce fWtr'spl n
istribution Dt-rv newksaemtaedbvaiscsosarf,
igur I - Coprt Roadm
Waer curnl spnd aproiatl $4 milo anulyo rigt ayoh
and taxes associated with conducting business in all of the relevant countries. Additionally, some of the channels and nodes in the distribution network exist due to historical decisions that may
not be applicable today. And it is only because of the inertia of the shipping process and associated real estate and hardware that these channels and nodes still exist.
It is currently the case that products are being shipped in their completed form from the manufacturing plant to a distribution center and then to a customer. For example, Waters customers in the United Kingdom interested in a particular product will end up receiving a product that originated in a plant in the UK, but was sent first to Wexford, Ireland before returning back to the UK.
There are currently many such inefficiencies in Waters' distribution network and while it would be costly to make changes, the possibilities and benefits ought to be explored fully. Such
an undertaking would not fit the scope or timeline of the M.Eng. program and MIT - Waters
Alliance, but it still remains an integral part of the future planning for Waters at the corporate level.
Proposed Solution
In general, network redesign endeavors tend to be expansive and affect all aspects of the business. As such, it is extremely crucial that care be taken in determining which aspects of Waters' network can be changed in which absolutely cannot. For the aspects that can be changed, it is important to obtain estimates associated with various options that reflect how costly it would be to alter the existing system (be it overhead costs, capital costs, downtime costs, or inventory costs).
These estimates would provide an outer framework for a network redesign project
-indicating which shipping steps can be changed, and at what cost. From there, tools and techniques for optimization of distribution networks can be used to find shipping channels and
nodes that can be reconfigured or eliminated entirely.
Next Steps
As this project involves searching for a solution that could potentially restructure large portions of the corporation, it is essential that Waters create a taskforce that it trusts in order to conduct this project. Assigning such a project to a group of interns or graduate students without
consultation of higher level management would be a waste of time, as any solution such a team could come up with would then need to be validated by Waters executives. It would be
extremely easy (and perhaps prudent) for an executive to shy away from implementing such an
extensive change without first reexploring it. Therefore, it is recommended that Waters only task such a project to a team of external consultants if it constrains the problem so that the team can provide suggestion without having to implement the change. Alternatively, an internal taskforce of Waters personnel skilled in distribution network studies would be ideal for approaching this problem. This project has a potential to bring great value to Waters, but it is crucial that Waters is ready for such a change before investing its resources in tackling this problem.
3.4.2
Lot Sizing Optimization for Lot-Controlled Consumables
Current State
Waters sells many consumable components that are lot-controlled, meaning that the lot number is relevant in differentiating parts (as opposed to traditional parts that are identical as long as they have the same part number). Specifically, columns that contain particular powder chemistries are controlled because the manufacturing process that produces the powder guarantees that all columns made in the same batch have sufficiently identical chemical compositions, but it does not guarantee that columns from different batches have sufficiently
identical compositions. Many of Waters' customers are required to perform validations on these columns that are specific to the lot before conducting experiments using Waters instruments and columns and that validation would need to be repeated if the customer were to conduct the experiments with columns from another lot. As such, Waters has the practice of differentiating column lots for the purpose of these customers, and is capable of filling orders that have lot specific requests.
At present, lot specific ordering has caused Waters problems from both overstocking and understocking perspectives. As customers continue to request columns from the lots as their previous orders, it often happens that orders are impossible to satisfy as the necessary products are completely out of stock, and producing new columns that are identical is impossible to accomplish. On the flipside, certain lots that are purchased by smaller customers with less demand end up scrapped because the expiration date comes before many of the units can be sold.
Waters has also made some unwritten purchasing agreements with customers who requested specific lots be reserved for their use only. However, as there were no binding legal contracts, Waters was not protected from the eventuality that these customers would not buy enough units from the lots and Waters has had to scrap many units on account of its generosity.
Both the manufacturing department and the order fulfillment are affected by the choice of lot sizing. For extremely large lot sizes, the cost to the manufacturing department associated with delaying other production will be very high. Conversely, tiny lot sizes introduce very high setup time to production time ratios that also tax the manufacturing department. Likewise, overly large lot sizes often cause product scrapping, while overly small lot sizes cause missed orders. As both concerns are mitigated by a "middle of the road" approach, the lot sizing is currently set by the production schedule and designed to fit approximately with the demand. This gives the status quo "medium" lot sizing. Unfortunately, there are still a lot of orders that are missed as well units that are scrapped.
Past work [17] has shown that in a manufacturing system, effective lot scheduling and sizing can be used to increase efficiency using an EQQ model originally developed by Harris
[18].
Proposed Solution
The recommended optimization problem is to select a periodic schedule of lot sizes (that can still change with demand) that minimizes the costs incurred by manufacturing scheduling, missed orders, and unit scrapping. It is hypothesized that it is not necessarily most effective to have all lots be the same size as the flexibility of having some larger lots and some smaller can enable Waters to more efficiently serve its customers.
Procedures can be put in place when a customer wants a new lot to match the customer with an appropriately sized lot considering the particular customers purchasing behavior regarding lot specific ordering. Customers with the propensity to order many columns in the
same lot can be 'assigned' to larger lots while smaller customers with little to no evidence of needing to repeat their orders can be fulfilled from lots that don't have quite as many units remaining.
An analysis tool can be developed to recommend ideal lot sizing that can, in conjunction with customer lot assigning practices, optimize the lot sizing to reduce costs. This tool would need to analyze the current situation and customer behavior to interpret the lot sizing
possibilities. Development of a tool that takes the current situation as an input and returns a solution is extremely important so that the instead of solving the problem once, it can be solved
over and over as circumstances change. Likewise, the methods, assumptions, and parameters can be adjusted in subsequent trials so that the optimization can be improved.
Next Steps
To move forward with such a project, it is important for the scope to be well defined. While it is easy for a project planner to list all of the concerns that need to be considered in an ideal solution, every constraint has the potential to cause the optimization problem to grow with complexity. Great care needs to be exercised when determining and monetizing the costs and benefits that arise from different lot schedules so that the resulting problem is feasible to solve. It can be beneficial for some simplifying assumptions to be made during the first-pass attempt at solving this problem (i.e. assuming homogeneity in the manufacturing plant to simplify
changeover cost calculation or assuming that all products have the same shelf life to simplify the scrapping considerations).
This project is well suited to be tackled by a team with a background in data analytics and machine learning. While this project would be an excellent candidate to give to a team of interns or graduate students, it would be essential for continued success of such a procedure that
permanent data-oriented resources be involved. This will require multiple iterations and refinement that can only be done with time, so dedicating personnel to furthering this project would be a responsible course of action.
3.4.3 Box Erection Assistive Technologies
Current State
Waters currently has many business areas that require manual assembly of corrugated cardboard boxes. Particularly in the distribution centers, where outbound orders require consolidation of multiple products into shipping boxes, material handling staff members are spending large amounts of time estimating the ideal box size and assembling it. While these tasks are relatively quick when done once, the amount of time spent doing them is actually quite great when considering how often they have to be done.
Proposed Solution
There are automated technologies in existence both for box size determination (estimation based on solving the rectangular prism packing problem) and box erection. Commercially software can be explored in order to find a solution that will automatically
recommend box sizes and packing layouts to material handling staff. Reducing the planning time and wasted time due to incorrect box selection can significantly improve the packing rate at
GDC. Likewise, mechanical automation for box erection and bottom sealing can be explored to
find an ideal solution. Shortening the packing time by preparing boxes automatically for packing can also significantly improve the packing time. There are possibilities that allow for erection of various box sizes without any changeover. The former employer of the author of this thesis is an example of an Original Equipment Manufacturer that specializes in automated packaging solutions (information has been provided to Waters but is omitted from this document for privacy).
Next Steps
Much of this project will be a technology exploration study and cost/benefit analysis. As solutions to these problems exist and are available commercially, the primary goal would be to evaluate existing solutions in order find the most appropriate solution for GDC and then to validate the selection for a favorable return on investment.
3.4.4
Inventory Relocation within DC
Current State
The layouts of Water's distribution centers were determined by planned, one-time analysis and continue to be altered by day-by-day observations and a fair amount of "tribal knowledge." In Franklin, MA in particular, where GDC has made its home since October 2017, the current layout was determined before the move in. Shelving, high bay areas and specialty storage locations (refrigeration, freezer, HAZMAT, etc.) were set up to efficiently handle material receiving and picking. The basic model used is the flow-through model, where the two loading docks are completely divorced from each other. One dock, by the front of the building, handles receiving exclusively, while the other dock, in the rear of the building, handles outbound shipping. One basic principle of inventory location - placing the fastest moving products in the
most efficient locations - was followed, thus the shelving areas are closer to the shipping area while the high bay storage area, which contains larger less frequently ordered parts, is farther
from shipping. While the location of the storage hardware (the shelves and high bays themselves) would be extremely costly and non-trivial to move, the storage locations of
individual parts is much simpler to relocate.
The management at GDC is interested in gaining visibility about the efficiency of the current layout and to learn easily of any alterations that could be made at any given moment that would increase the average picking rate.
Proposed Solution
Like many large corporations, Waters collects data on many of its day-to-day operations and stores records of many kinds of transactions. Much of this data is stored in its corporate
enterprise software, SAPTM. As part of the digitalization theme of this roadmap, it is important to
Waters that it starts utilizing the data it collects to improve its business. Here lies an opportunity: to study the shipping patterns, picking patterns, and receiving patterns, to determine a way to optimize the layout at the distribution centers. Such a technique can be automated, so that distribution center managers can have a software tool that can be consulted and will recommend material relocation endeavors and initial material put-away locations.
Next Steps
The pilot for this project has been developed and is discussed in detail in the remainder of this thesis. The pilot considers high bay storage locations storage locations in GDC and primarily
deals with the SKUs located in that area at the time of this study. It includes some measurement of storage locations and SKUs as well as a preliminary location cost assignment analysis.
Success of this project hinges on careful implementation and ramp-up followed by additional data collection, reevaluation, refinement, and ultimately, extension beyond the scope of the initial pilot.
CHAPTER 4
INVENTORY RELOCATION PROBLEM
This chapter details the problem, approach, and solution for automated inventory relocation recommendations. It describes the problem statement and task division between members of the team and documents the development of the objective function, constraints, and placement algorithm step.
4.1 PROJECT OVERVIEW AND PROBLEM STATEMENT
GDC shifted from its location in the Milford campus to a stand-alone warehouse in
Franklin, MA around a year ago. However, the storage location for various SKUs was kept unchanged even after the drastic changes in the overall layout for the 56,000 sq. ft. space. Given the huge area, delivering over 1,500 lines every day requires the pickers to walk miles across the
facility.
There have been no attempts to optimize the locations of various SKUs within the DC before or after the shift. After researching this problem, it became clear that while the GDC staff do their best to make sure to place incoming material intelligently, computationally driven recommendations would improve on their decisions and save them the time spent making those decisions. Three key areas were highlighted as ways an automatic software tool could be used by distribution center managers and personnel to improve productivity:
1. Total Relocation: A relocation of all SKUs currently in a particular section of the
warehouse (or the entire warehouse at once). This goal involves creating a report that will list the new location of every SKU and estimate the resulting improvement to the
warehouse's picking speed.
2. Replace X: A tool that allows the manager to request recommendations for inventory relocation procedures that involve relocation of x SKUs within a particular section. This goal is intended to give control over how extensive a particular relocation effort should be, as it will often be the case that a manager desires to improve the picking speed but does not have sufficient time and resources to relocate every SKU in the section. This too
will create a report listing the new layout and the estimated improvement, as well as a list of actual moves required.
3. Recommended Put-Away: A tool that recommends storage locations for every SKU
present in an incoming shipment.
With all three goals, it is crucial that they be implemented as recommendations, so that each particular SKU suggestion can be considered by a human and then ignored if it is believed that there is a reason to disregard the suggestion. Especially at the initial implementation of this system, when there will be many instances of information available to the software tool being incomplete, many of the recommendations will need to be recognized by a human as not meaningful (i.e. if the system has no information on the size of a SKU and then recommends placing it in a location where it clearly will not fit, a human familiar with the materials needs to be able to disregard the recommendation).
As it is necessary to test an inventory relocation system to properly determine its benefits, it was decided that the implementation cannot involve excessive spending. For this reason, the algorithm was to be developed from scratch and tailored directly to GDC. By doing so, any costs associated with purchasing and/or applying commercial solutions (should any exist) to GDC could be avoided. As such, the need to validate the inventory relocation in terms of return on investment can be avoided as the implementation requires no capital expenditure.
In addition to the requirement that the algorithm produce relevant and mathematically sound solutions, it is also necessary for it to interface easily with existing Waters systems and people. Specifically, it must be able to grab whatever information it needs from the databases, and the output results need to be readable and manipulatable by staff members that have basic backgrounds in using computers (text files, emails, Microsoft Excel tables) but not in coding environments.
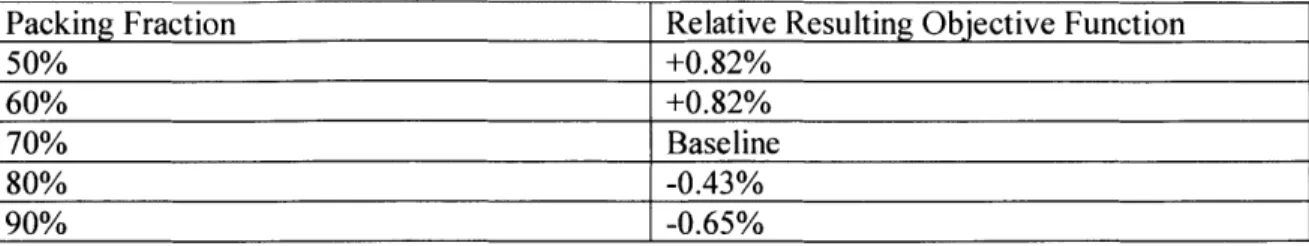
The process flow for picking operations appears in Figure 2:
Figure 2 - Process Flow Diagram: Picking [8]
Traversing the aisles accounts for roughly 40% of the time spent in the picking, packing,
and shipping process at GDC [8], s0 it would be extremely beneficial if that time could be
shortened.
Time Study - Picking, Packaging & Shipping
Drop Order * Plan Route
P Pick p Pick-Verify in SAP
a Box Erection & Product Placemnent Paperoork d
Figure 3F- Step-wise distribution oftime
for
Picking, Packaging & Shipping [8]4.2 TASK DIVISION
This portion of the "DC of the Future" pilot was handled primarily by the author of this thesis and by R. Batra. While this thesis should be considered the primary reference for the
implemented inventory relocation project, multiple aspects of the analysis were conducted in
collaboration with R Batra. Much of the necessary data collection, assessment, management, and
the location cost assignment analysis for the high bay area of GDC as well as a full cost savings analysis were done by R. Batra [8].
4.3 OBJECTIVE FUNCTION
As inventory relocation is inherently an optimization problem, it needs to be described by an objective function. At its most basic level, the goal for inventory location is to find a layout that minimizes the cost incurred by the warehouse associated with the layout. This is
accomplished by finding an objective function that corresponds most directly to labor costs associated with the layout. It need not be the case that the actual labor cost be equal to or even proportional to the objective function. It is sufficient for the objective function to be related to the actual cost in that it increases/decreases whenever the actual cost increases/decreases. This way, it follows that minimizing the objective function will serve to minimize the actual cost as well with decent certainty.
Let L be the set of all storage locations and S the set of all SKUs. Let the contents of a
particular storage location 1j
E
L be represented by the following set indicating the existence ofSKU si
E S in location Ij with quantity qij > 0:
Ij = f{(si, qij)} 1
Let a particular total layout L be defined as a set of all triples (si, qij, ii) such that SKU si exists in location 1j with quantity qij > 0:
L = {(si, qij, ij) 1 3 ((si, qij) E 1j) (2)
Then the objective function, J0, can be represented as a sum of the costs associated with picking, receiving, and overhead associated with a particular layout L.
Jo (L) = Cpick (L) + Crec (L) + Coverheaa
(L)
(3) In general, the primary concern was with costs that change from layout to layout, so efforts were made to determine portions of the cost that do not vary when the storage layout is changed. These simplifications, as well as some others, are discussed in the next section. The general approach with these formulations was to start with the most general and exact forms of the equations and then make simplifying assumptions to model the cost in a way that is feasible to calculate.4.3.1
Cost Functions
For a particular horizon H (set to six months in the pilot project), all tasks require a particular number of man-seconds to be completed. Thus, the cost functions
Cpick, Crec, Coverhead, represent the amount of time spent on the task on account of the layout.
Overhead costs were estimated to remain relatively invariant across different layouts. I.e.,
8 Coverhea (L) 0 (4)
Likewise, costs associated with receiving were estimated to vary much less than costs associated with picking from layout to layout, as the average number of like units put away in a received shipment was found to be much greater than the average number picked at once. Because of this, the amount of time spent traveling from location to location was much less important when more units were received at once. I.e.,
aC ec(L) a Cpick (L
Crec(L) < Cpick(L); '
(
<< (5)Because of this situation, it was determined that the most important cost for which to optimize the layout is the picking time. The objective function was therefore reduced to:
J(L) = Cpick(L) (6)
At its core, the cost associated with picking items is simply the amount of time pickers spend walking from location to location in order to pick items during a particular horizon H on account of the current layout L. So, for all instances of traveling from a to b, the total cost associated with the layout is:
Cpick(L) = d(a, b)] (L) (7)
Where d(a, b) is the cost associated with traveling the distance from a to b.
Unfortunately, determining how this function behaves for different layouts proved to be very difficult. Pickers take a variety of different approaches to order picking (single order picking, batch picking, wave picking) and build in additional efficiencies and inefficiencies to their tasks. Ultimately, it was decided to define the total cost for this optimization by determining individual
cost amounts associated with the choice of a particular SKU being placed in a particular location. Thus, the cost function was rewritten as:
Cpick(L) = c(si, qij, (8)
(si,qij,1j)EL
Where the individual cost function c(si, qij, 1j) is defined as some function of the
physical volume of the SKU vi, the quantity of the SKU qij, the frequency of the SKU
fi
(number of times expected to be ordered, regardless of quantity), the expected transit time
contribution from the particular SKU/location pairing dT(si, Ii):
c(si, qij, ij) = F (vi, qij,
fi,
dT(si, ii)) (9)The behavior of this function was studied by observing the day to day operations at GDC. Ultimately, a few key discoveries were made about the different factors:
1. The cost associated with a unit being in a location did not seem to be affected much by
the number of like units present, thus the cost function was assumed to be linearly proportional to the number of units.
2. It was also not much affected by the sizing, as pickers were virtually always picking up all units of a necessary SKU at once and increases in picking time were small compared to transit time (it will eventually be shown that the location and size will be related, so the extra picking time of large, palleted SKUs will be captured by the location).
3. In terms of frequency, it was estimated that the cost function was also linearly
proportional to the expected number of trips (i.e. the expected demand divided by the average number of units ordered in a line).
4. The transit time contribution appeared to be affected by a variety of factors, including the distance from the shipping area of the location, the method of picking (which depended on the type of material and whether or not it was palleted), the distance from other identical SKUs (to facilitate the primary-overflow storage strategy), the distance from other different SKUs (depending on the cross correlations or those SKUs).
Because of these observations and calculations, the individual cost function was refined as:
c(si, qij, 1j) = qij -
![Figure 2 - Process Flow Diagram: Picking [8]](https://thumb-eu.123doks.com/thumbv2/123doknet/14731986.573173/34.917.114.770.135.378/figure-process-flow-diagram-picking.webp)