HAL Id: hal-00316764
https://hal.archives-ouvertes.fr/hal-00316764
Submitted on 1 Jan 2001
HAL is a multi-disciplinary open access
archive for the deposit and dissemination of
sci-entific research documents, whether they are
pub-lished or not. The documents may come from
teaching and research institutions in France or
abroad, or from public or private research centers.
L’archive ouverte pluridisciplinaire HAL, est
destinée au dépôt et à la diffusion de documents
scientifiques de niveau recherche, publiés ou non,
émanant des établissements d’enseignement et de
recherche français ou étrangers, des laboratoires
publics ou privés.
characteristics of decametre-wavelength E region
backscatter and the relationship with optical auroral
forms
S. E. Milan, M. Lester, N. Sato, H. Takizawa
To cite this version:
S. E. Milan, M. Lester, N. Sato, H. Takizawa. On the altitude dependence of the spectral characteristics
of decametre-wavelength E region backscatter and the relationship with optical auroral forms. Annales
Geophysicae, European Geosciences Union, 2001, 19 (2), pp.205-217. �hal-00316764�
Annales
Geophysicae
On the altitude dependence of the spectral characteristics of
decametre-wavelength E region backscatter and the
relationship with optical auroral forms
S. E. Milan1, M. Lester1, N. Sato2, and H. Takizawa3
1Department of Physics and Astronomy, Leicester University, Leicester LE1 7RH, UK 2National Institute of Polar Research, Tokyo 173, Japan
3Tohoku University, Sendai 980–8578, Japan
Received: 30 August 2000 – Revised: 22 January 2001 – Accepted: 24 January 2001
Abstract. Observations of E region backscatter by the
Ice-land East SuperDARN HF radar from the 30 minute pe-riod 2330 to 2400 UT on 13 September 1999 are presented, along with simultaneous observations of auroral luminosity from two all-sky cameras. Interferometric techniques are employed to estimate the altitude of origin of each echo observed by the radar. Under investigation is a region of backscatter which is L-shell aligned and exists in a region of low auroral luminosity bounded to the north and the south by two auroral arcs. The spectral characteristics of the backscat-ter fall into three main populations: broad, low Doppler shift spectra; narrow, high Doppler shift spectra; and exception-ally narrow, low Doppler shift spectra. The first two pop-ulations are similar to type II and type I spectra observed with VHF radars, respectively. These populations scatter from near the peak of the E region. The high Doppler shift population appears to exist in a region of sub-critical elec-tric field. The third population originates below the E re-gion peak at altitudes between 80 and 100 km. We argue that a non-coherent scattering process is responsible for this backscatter.
Key words. Ionosphere (auroral ionosphere; ionospheric
ir-regularities)
1 Introduction
The SuperDARN (Super Dual Auroral Radar Network) HF radars (Greenwald et al., 1995) employ coherent backscatter from F region ionospheric irregularities as a diagnostic of the bulk plasma motion of the ionosphere under the influence of the convection electric field. Backscatter from the E region is also routinely observed, though as the phase velocity of the E region irregularities is not, in general, directly related to the applied electric field, such backscatter cannot give a reliable measure of ionospheric convection. This backscat-ter does, however, allow the study of the plasma instability Correspondence to: S. Milan ([email protected])
mechanisms at work in the lower ionosphere. Most previ-ous work in this field has been conducted using VHF radars operating at frequencies between 50–150 MHz, which probe irregularities in the 1–3 m wavelength range (see review by Haldoupis, 1989, and references therein). The SuperDARN radars are frequency-agile between 8–20 MHz and hence can achieve backscatter from irregularities with wavelengths be-tween 7.5–18.75 m. Theoretical work has suggested that E region instability mechanisms display a significant k-depen-dence (e.g. St.-Maurice et al., 1994), and hence this ability to extend the wavelength regime under investigation is of great importance. Indeed, observationally, Villain et al. (1987, 1990), Hanuise et al. (1991), Milan and Lester (1998) and especially Milan and Lester (1999, 2001) have demonstrated that a wide variety of spectral classes exist in SuperDARN HF radar backscatter from the auroral E region. The aim of the present paper is to extend these studies by determining the altitude dependence of E region backscatter characteris-tics, and to study the relationship between the radar backscat-ter and optical auroral forms.
The radar measurements from the present study were made by the Iceland East SuperDARN radar located at Þykkvibær (63.77◦N, 339.46◦E), shown in Fig. 1. The radar sounds along sixteen different beam directions, separated by 3.24◦ in azimuth, with the radar boresite pointing at a azimuth of 30◦east of north. SuperDARN radar returns are gated into 75 range bins, usually of 45 km in length, with a range of 180 km to the first gate, giving a maximum range of 3555 km. However, E region backscatter can only be unambigu-ously identified in the near ranges of the radar field-of-view, and hence the “myopic" radar scan mode, designed specif-ically for studying E region echoes, reduces the length of the 75 range gates to 15 km each, thus increasing the spatial resolution in the “usable" portion of the field-of-view. The maximum range of this mode is 1305 km. The extent of this reduced field-of-view is illustrated in Fig. 1, along with the locations of range gates 0, 15, 30 etc. In the present study, the 16 beams are scanned clockwise from beam 0 to beam 15 with a dwell time of 3 s each; a full scan of the
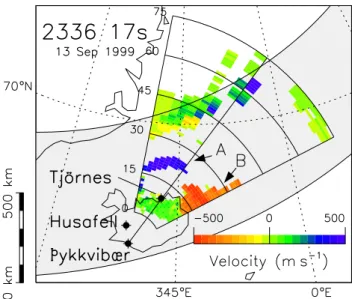
field-of-Fig. 1. A map indicating the location of the Iceland East
Super-DARN radar at Þykkvibær and the Husafell and Tjörnes all-sky camera sites employed in the present study. The statistical location of the auroral oval for quiet geomagnetic conditions is also shown for context. Line-of-sight Doppler velocity determined for the radar scan starting at 2237.17 UT is presented, backscatter features A and B being indicated by arrows.
view is completed every 49 to 50 s. All radar times quoted are at the start time of each scan. The radar is operating at a frequency of 10.5 MHz, corresponding to a wavelength
λ ≈28.6 m. Bragg scatter is then observed from irregulari-ties with a wavelength of 14.3 m. In each radar cell, the spec-tral characteristics of the backscatter, power, mean Doppler shift and spectral width are determined directly from a 17-lag complex auto-correlation function: the spectral width is a measure of the decorrelation time of the ACF, while the velocity is obtained from the rate of change of phase with lag; the reader is directed to Hanuise et al. (1993) for a full description of the ACF analysis technique.
Backscatter from field-aligned irregularities, i.e. Bragg scatter through an angle of 180◦, can only be observed where the radar wave-vector is perpendicular to the local magnetic field, known as the orthogonality condition. At VHF fre-quencies, where the radar beam is not significantly refracted by the ionosphere, and also at auroral latitudes, the orthog-onality condition can be achieved only near the peak of the E region over a relatively narrow latitudinal range, and only with a poleward-directed radar looking close to the horizon. HF radars, on the other hand, exploit the refractive nature of high frequency radio-wave propagation in the ionosphere to achieve orthogonality over a range of altitudes both in the E and F regions (see, for instance, Milan et al., 1997a). The altitude from which backscatter originates can be estimated from a knowledge of the range to the backscatter volume, and a measurement of the elevation angle of the radar returns, determined using the interferometric technique described by Milan et al. (1997b). Without a detailed knowledge of the
electron density profile, straight-line propagation must be as-sumed. The elevation angle 1, radar slant range r, and the altitude of the scatter volume h are then related by
h = (RE2 +2RErsin 1 + r2)1/2−RE (1) where REis the radius of the Earth. Simple ray-tracing sug-gests that this straight-line propagation assumption is reliable for the determination of altitude in both the lower ionosphere and at short ranges, and thus leads to a small (∼10–20 km) over-estimate of the true altitude for returns from the peak and upper-E region. However, individual altitude estimates are susceptible to fairly large errors under a variety of con-ditions, for instance if a given range gate contains backscat-ter from a range of altitudes or even two discrete altitudes. For this reason, we will, in general, employ ensemble esti-mates of altitude for any particular population of backscatter echoes.
Two all-sky cameras (ASC) are also employed in the study, located at Husafell (64.67◦N, 338.97◦E) and Tjörnes (66.20◦ N, 342.90◦E), Iceland (see Fig. 1). As discussed at length in our previous study of the relationship between radar and optical auroral forms, Milan et al. (2000), a fundamental limitation of ground-based observations of the aurora is the ambiguity in determining the location of an optical feature without a detailed knowledge of the altitude profile of the emission intensity. Only auroral features situated directly over the observing site can be located with certainty. Our previous study employed only the Husafell camera, which is located outside the Iceland East radar field-of-view, and hence suffered from this inherent uncertainty in comparing the locations of optical and radar aurora. This limitation is somewhat mitigated in the present study by the inclusion of the Tjörnes camera, which is located directly underneath the field-of-view of the radar.
2 Observations
We present radar and all-sky camera obervations of the au-rora from the 30 minute period 2330 to 2400 UT on 13 Sep-tember 1999, when the near-range radar field-of-view is lo-cated near 00 magnetic local time. Figure 1 shows the line-of-sight velocity (Doppler shift) of radar backscatter observed during the scan starting at 2336.17 UT, near the beginning of the interval of interest. Positive line-of-sight velocities correspond to irregularity phase motion towards the radar. Several backscatter features are observed, but only those at the nearest ranges, marked A and B, are of interest to the present study. Interferometric measurements indicate, as will be demonstrated below, that these backscatter features origi-nate from near E region altitudes. These backscatter regions are roughly L-shell aligned, a characteristic feature of E re-gion backscatter (Villain et al., 1987, 1990; Milan and Lester, 1998, 2001), and hence, progress from low ranges in beam 0, the western-most beam, to higher ranges in more east-ern beams. The spectral characteristics of these regions of backscatter will be discussed in more detail below.
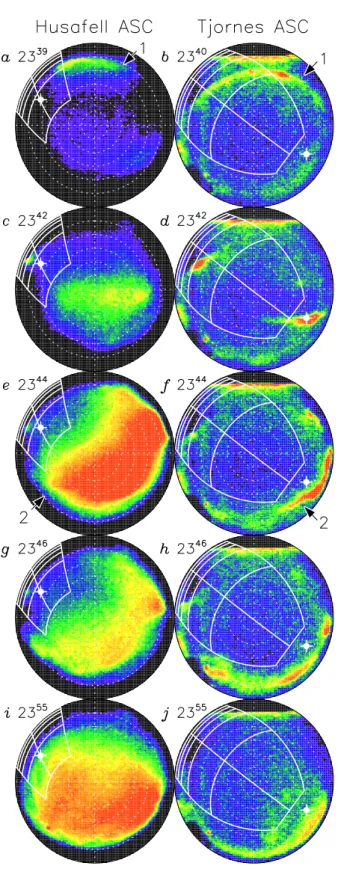
Fig. 2. False-colour all-sky camera images from Husafell and Tjörnes for five times from the interval of study. Red regions are those of greatest intensity. The images are aligned such that geo-magnetic North and West are directed towards the top and right of each panel. Auroral features 1 and 2 are indicated by arrows. The location of the radar field-of-view (the same grid system presented in Fig. 1) is indicated in each image, along with the location of the zenith of the other all-sky camera; this projection assumes an emission altitude of 110 km.
Figure 2 presents false-colour images from the Tjörnes and Husafell all-sky cameras. Black and red represent minimum and maximum intensity, respectively. The horizontal feature at the top of each of the Tjörnes images is an artefact of the data processing. Superimposed on these images is the loca-tion of the radar field-of-view, assuming that the altitude of peak optical emission is 110 km. In addition, to aid com-parison of the images from the two cameras, the location of the zenith of the Husafell camera is indicated in the field-of-view of the Tjörnes’ field-field-of-view and vice versa, again assuming an emission altitude of 110 km. At approximately 2340 UT (panels a and b), an east-west aligned auroral arc was observed to the north of both ASC sites; we will refer to this as arc 1. In addition, a very dim, east-west aligned auroral arc was present near the zenith of the Husafell cam-era and to the south of Tjörnes, which we will refer to as arc 2. By 2342 UT, arc 1 was becoming dimmer and arc 2 was brightening (panels c and d). Arc 2 subsequently reached a maximum in brightness, dominating the auroral images, and moved slightly to the southwest of Husafell (panels e and f). By 2346 UT (panels g and h), arc 2 had dimmed once again and the intensity of arc 1 had become very low indeed. For the next 15 or so minutes, this auroral configuration remained more or less static, except that towards the end of the inter-val, the poleward portion of arc 2 expanded across the near ranges of the radar field-of-view (panels i and j). Although not apparent in the snapshots presented in Fig. 2, by this time arc 2 was pulsating. Irregular patches within the aurora vary quasi-periodically in intensity, with periods of the order of several seconds.
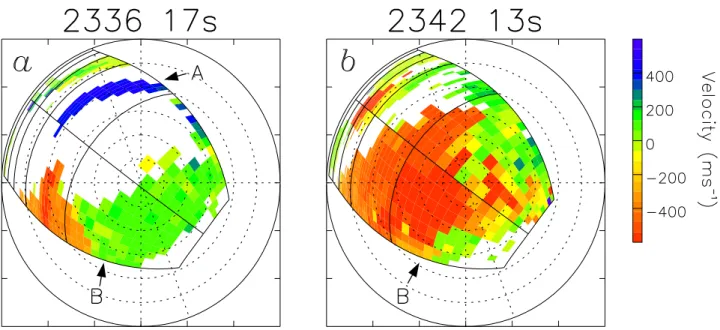
Figure 3 illustrates line-of-sight velocity from two radar scans starting 2336.17 UT (presented in Fig. 1) and 2342.13 UT, superimposed onto the Tjörnes ASC field-of-view, as-suming an optical emission altitude of 110 km. In the first scan (panel a), backscatter features A and B are identified. Feature A is observed close to the location of arc 1 (cf. Fig. 2b) and the equatorward edge of feature B is near the location at which arc 2 subsequently brightens (cf. Fig. 2d and f). In the second scan shown (Fig. 3b), backscatter region A is no longer observed. However, the poleward edge of feature B has extended poleward to near the location of arc 1. In other words, by 2343 UT a region of E region radar backscatter extends between the locations of optical arcs 1 and 2, as ob-served by the Tjörnes all-sky camera. The backscatter feature occurs in a region in which no optical luminosity is observed, but appears bounded by the locations of two optical features, which vary considerably in luminosity with time.
The time-evolution of the radar backscatter is illustrated in Figs. 4 and 5; radar measurements from six times during the interval of interest is presented. Four parameters are shown: backscatter power, line-of-sight velocity, spectral width, and the estimated altitude of origin of the backscatter. The radar field-of-view is represented in a rectilinear format, beam ver-sus range gate (only the first 60 range gates are shown), in a manner similar to that of Milan and Lester (1998, 2001). The first two scans, 2336.17 and 2342.13 UT, correspond to panels a and b of Fig. 3. Features A and B are identified
Fig. 3. Line-of-sight Doppler velocity measured in scans starting 2336.17 and 2342.13 UT, projected onto the Tjörnes ASC field-of-view,
assuming an emission altitude of 110 km. Backscatter features A and B are indicated by arrows. Again, the grid system representing the radar field-of-view is the same as that presented in Figs. 1 and 2. The images are aligned, as in Fig. 2, such that geomagnetic North and West are directed towards the top and right of each panel.
by arrows in Fig. 4b, though most of the rest of the discus-sion relating to this backscatter will concentrate on feature B. Throughout most of the interval, this is an L-shell-aligned region of backscatter, some 200–300 km or 2–3◦in latitu-dinal width. Of most interest to this study is the relationship between Doppler shift, spectral width, and the altitude of ori-gin of the backscatter. First, we will discuss the line-of-sight velocity measurements in detail.
Beam 0 points roughly perpendicular to the L-shell-aligned feature, while beam 15 points roughly parallel to it (see Fig. 1), the radar field-of-view sweeping out approximately 52◦ of azimuth. If the direction of motion and phase speed of the irregularities from which the radar scatters are constant along the backscatter feature, then a smooth variation in line-of-sight Doppler shift νlos is expected across the field-of-view.
In such a situation, the relationship between νlosand the
an-gle the radar beam makes to the local L-shell, φ, is
−νlos =νmagcos(φ − φ0), (2)
where νmagis the phase speed and φ0 is the direction of
ir-regularity drift relative to the L-shell; νlosis made negative
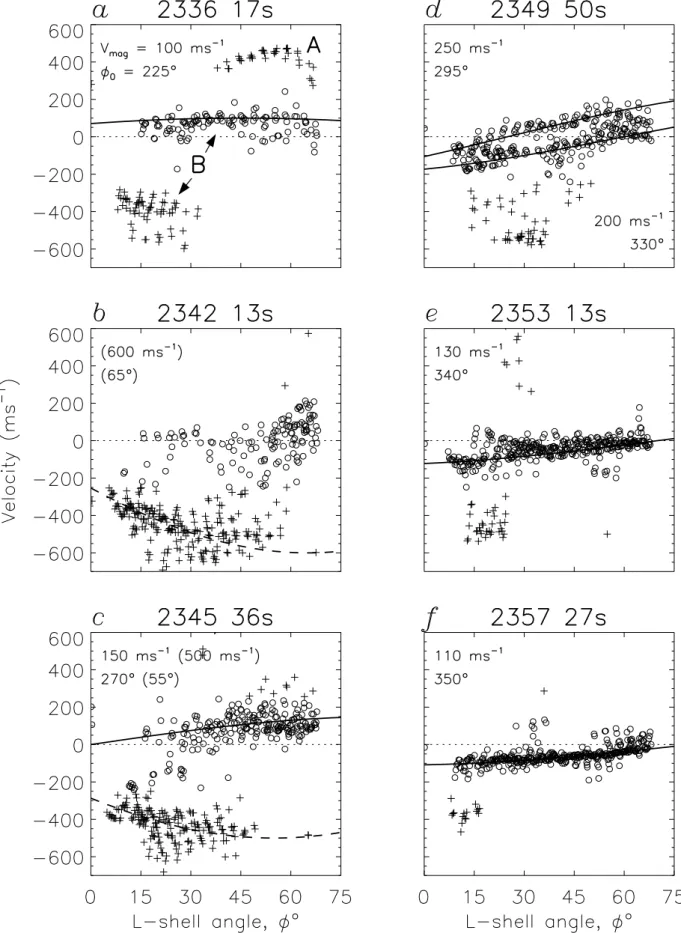
here as, by convention, SuperDARN velocities are positive towards the radars. Villain et al. (1987, 1990) and Milan and Lester (2001) demonstrated that some E region backscatter does indeed obey this relationship, and it appears to hold true in panels b, f, and j of Fig. 5, where the velocity is near 100 m s−1 in beam 0 and near −100 m s−1 in beam 15, with (in general) a smooth variation in between. Figure 6 shows this more quantitatively, presenting the measured relation-ship between νlosand φ for the six radar scans presented in
Figs. 4 and 5. In this figure, points are represented by cir-cles if |νlos|<250 m s−1, and by crosses otherwise, to help
distinguish between the high- and low-velocity populations that will be discussed below. In Fig. 6d-f (corresponding to Fig. 5b, f, j) the cosine-dependence described by Eq. (2) has been fitted by eye to the main populations in each panel. The values of νmag and φ0, which parameterise these fits,
are indicated in the top-left or bottom-right of each panel. We measure φ0 anti-clockwise from geomagnetic east, i.e.
φ0 = 90◦ and 180◦ correspond to geomagnetic north and
west, respectively. At 2349.50 UT, there is evidence that the background flow comprises two channels with phase speeds of 250 and 200 m s−1, and directions 295◦(SSE) and 330◦ (ESE), respectively. In the two subsequent panels, 2353.13 and 2357.27 UT (Fig. 6e-f), only a single main flow com-ponent is observed in which the phase speed halves, and the direction of phase motion rotates towards the east.
Superimposed on this background flow is a small region of higher Doppler shifts, near −300 to −500 m s−1; see Fig. 5b, f, and j, and the high (negative) νlos population in Fig.
6d-f. This situation is reminiscent of the studies of Villain et al. (1987, 1990) and Milan and Lester (1999, 2001) in which high Doppler shift backscatter was superimposed on a background of lower flow. Villain et al. interpreted the slow background as gradient drift waves, with a phase speed equal to the line-of-sight component of the ionospheric elec-tron drift, i.e. the line-of-sight component of the E × B/B2 drift imposed by the magnetospheric convection electric field
E. The higher Doppler shift returns were interpreted as
ei-ther backscatter from ion-acoustic (generated by the two-stream or Farley-Buneman instability) or electrostatic ion cy-clotron waves, present in regions of sub-critical electric field (E/B < CS, where CS≈400 m s−1is the local ion acoustic speed), but excited by vertically-moving electrons. We will
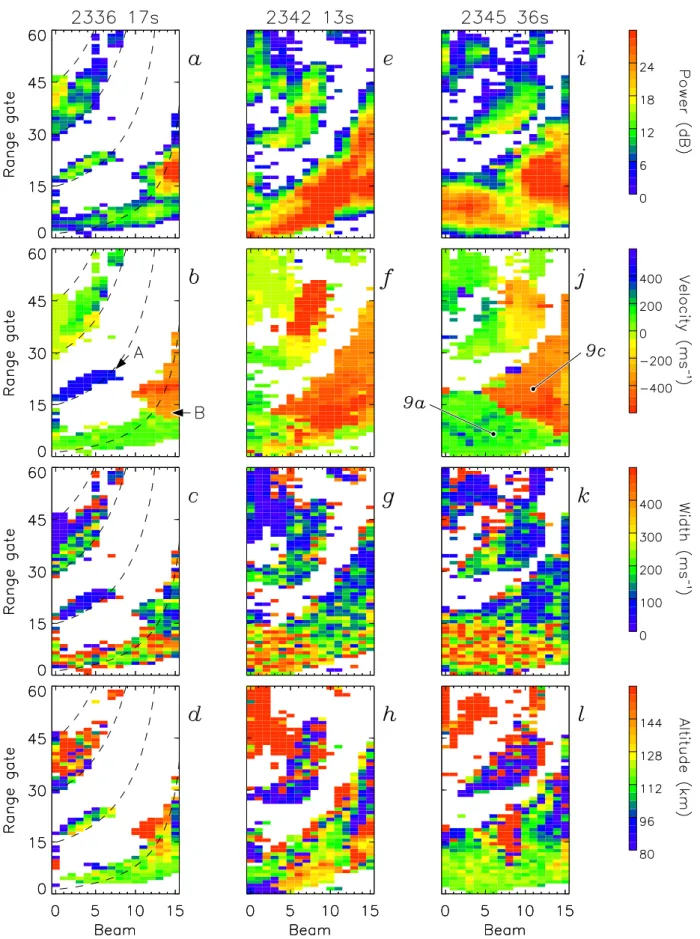
Fig. 4. Backscatter power, line-of-sight Doppler shift, spectral width, and estimated altitude of backscatter for scans starting 2336.17,
2342.13 and 2345.36 UT, illustrated in a rectilinear beam and range gate format. The radar cells for which the spectra are presented in Fig. 9a and c are indicated in panel j. Dashed lines in the first four panels indicate contours of constant geomagnetic latitude at 66◦, 68◦, 70◦, and 72◦.
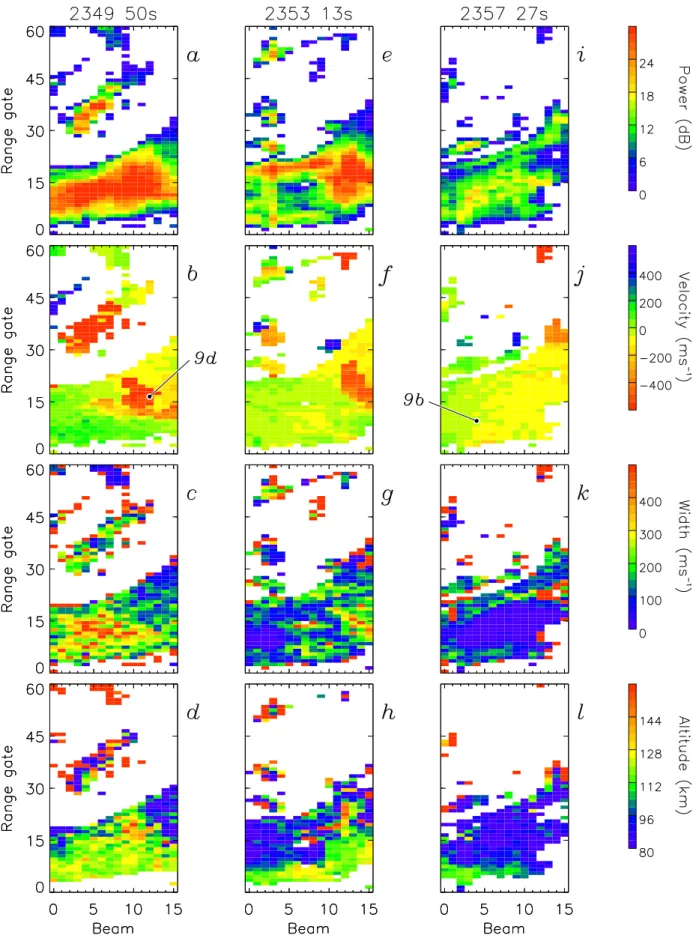
Fig. 5. Backscatter power, line-of-sight Doppler shift, spectral width, and estimated altitude of backscatter for scans starting 2349.50,
2353.13, and 2357.27 UT, illustrated in a rectilinear beam and range gate format. The radar cells for which the spectra are presented in Fig. 9b and d are indicated in panels j and b, respectively.
Fig. 6. Line-of-sight Doppler velocity as a function of L-shell angle, the angle the radar beam makes to the local L-shell, for the six scans
presented in Figs. 4 and 5. Points are represented by circles or crosses depending on whether the Doppler velocity is less than or greater than 250 m s−1. Cosine-dependence fits to some of the populations observed have been superimposed, the constants parameterising these fits being indicated in the top-left or bottom-right of the panels.
return to this discussion later.
Looking to the earlier part of the interval, the same general situation can be observed at 2336.17 UT (see Figs. 4b and 6a): a low velocity background flow component (νmag≈100
m s−1, φ0≈225◦or SW, but with a large uncertainty in the
direction) and superimposed higher Doppler shift population with νlos between −300 and −500 m s−1. There is also an
additional high Doppler shift population with νlos ≈ 400 m
s−1 in Fig. 6a, corresponding to backscatter feature A. By 2342.13 UT (Fig. 4f and Fig. 6b), feature A is no longer observed. More significantly, the high Doppler shift popu-lation dominates the backscatter in feature B, and too little of the low flow component is observed to allow a reliable fit to determine νmagand φ0. A similar situation is seen at
2345.36 UT (Fig. 4j and Fig. 6c), but here, the low flow component is no longer obscured to the same degree as pre-viously seen, and we are able to estimate νmag≈150 m s−1
and φ0≈270◦or southwards (though again with a high
un-certainty in the direction). Interestingly, in these two scans, a sufficient number of points from the high Doppler shift population are present to suggest that these spectra also dis-play a cosine-dependence in their line-of-sight phase speed. Dashed curves in Fig. 6b and c indicate fits to this popula-tion of νmag≈600 m s−1, φ0≈65◦(NNW) at 2342.13 UT
and νmag≈500 m s−1, φ0≈55◦(NW) at 2345.36 UT. It is
also interesting to note that this high Doppler shift population tends to occur in the middle and to the right of the field-of-view of the radar (especially in Fig. 4b, f, and j, but also in Fig. 5b, f, and j), i.e. in zonally- rather than meridionally-pointing beams.
To summarize the Doppler shift measurements from back-scatter feature B, two distinct Doppler shift populations exist: a low velocity component in which |νlos|<250 m s−1, and
superimposed on top of this, a high velocity component in which |νlos|>250 m s−1. The former can be interpreted as
gradient drift waves with line-of-sight velocities which are representative of the background E × B drift, which rotates from SW at 2336 UT through S to E at 2357 UT, with a magnitude between 100 and 250 m s−1. We note for future reference that the Doppler shifts associated with this low ve-locity component are predominantly positive at the start of the interval (prior to 2345 UT), but with the rotation in flow become predominantly negative towards the end of the inter-val (after 2350 UT), as seen in Fig. 6, for instance. The high velocity population appears to be superimposed on this back-ground low-flow component (especially seen in Fig. 5) and is thought to be characteristic of another instability mechanism operating in this region of sub-critical electric field. This population also appears to obey a cosine-dependence with a magnitude close to 600 m s−1, and the direction pointing NNW at an angle of approximately 135◦ to the simultane-ous direction of flow in the low velocity component. There is a relatively large spread in the Doppler shifts observed in this population, i.e. the cosine-dependence is perhaps not as well defined as in the low-flow component. We note, however, that this cosine-dependence is characteristic of high Doppler shift E region echoes observed by HF radars (Milan
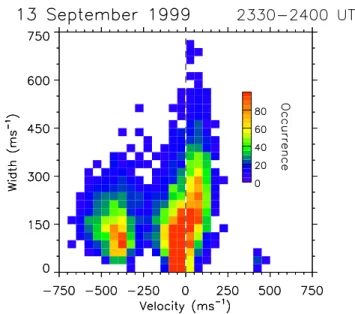
Fig. 7. Occurrence distribution of line-of-sight velocity against
spectral width for all backscatter observed in features A and B be-tween 2330 and 2400 UT.
and Lester, 2001), though the reason for this is not yet known. Having described the Doppler shift characteristics of the backscatter, we now turn our attention to the spectral width,
1ν, measurements. Examination of Fig. 4c, g, and k, and Fig. 5c indicates that a high level of variability exists in the spectral width measurements. However, it is clear that at the start of the interval (until 2349.50 UT), the low Doppler shift population is characterised by a broad distribution of high spectral widths, in general between 150 and 500 m s−1, and the high Doppler shift population is characterised by lower spectral widths, between 50 and 200 m s−1. This is illustrated again in Fig. 7, an occurrence plot of spec-tral width against velocity for all radar returns observed in backscatter features A and B, between 2330 and 2400 UT. The high Doppler shift population is mainly characterised by −500 < νlos < −350 m s−1 and 50 < 1ν < 200
m s−1. The low Doppler shift population from the start of the interval, which as mentioned above has mainly positive Doppler shifts, is characterised by 0 < νlos <150 m s−1and
100 < 1ν < 400 m s−1. However, at the end of the interval shown, 2353.13 and 2357.27 UT (Fig. 5g and k), the low Doppler shift spectra become much narrower; indeed, this can be seen again in Fig. 7, which shows that most low and negative Doppler shift spectra (those from near the end of the interval) have 0 < 1ν < 150 m s−1. In fact, as will be seen below, a large proportion of these spectra have 1ν < 25 m s−1.
The last parameter on which we will concentrate is the es-timated altitude from which backscatter is observed (Figs. 4 and 5; panels d, h, and l). As with the spectral width measure-ments previously discussed, a significant amount of variabil-ity is present in the observations. However, most backscatter from the start of the interval is found to originate between altitudes of 110 and 120 km. There is some suggestion that
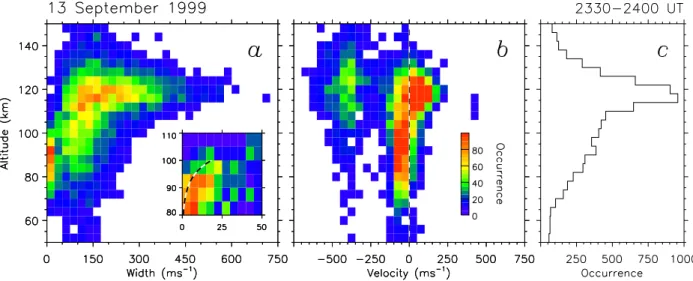
Fig. 8. Occurrence distributions of (a) spectral width and (b) line-of-sight velocity against estimated altitude for all backscatter observed in
features A and B between 2330 and 2400 UT. Panel c shows the overall altitude occurrence distribution of the backscatter. The inset panel of (a) concentrates on the low altitude, low spectral width population. The curve superimposed on this panel shows the expected altitude profile of spectral width if the ACF decay rate is dominated by diffusion processes (see text for details).
high Doppler shift spectra are scattered from slightly higher altitudes, 120 to 140 km (seen most obviously by comparing Fig. 5b and d, and Fig. 5f and h). A dramatic decrease in the modal altitude of scatter occurs towards the end of the interval (see Fig. 5h and l), with most scatter originating at heights between 80 and 100 km. This corresponds to the period when the spectral widths of the low Doppler shift pop-ulation decrease dramatically also, as discussed above. The overall altitude, spectral width, and Doppler shift character-istics of the backscatter are summarised in Fig. 8. Here, the occurrence distributions of width and velocity, as a func-tion of altitude, are presented for the same interval as Fig. 7. Three main populations are observed in the figure. In the first, low positive Doppler shifts maximise in occurrence be-tween 110 and 120 km altitude (see Fig. 8b); this is the low Doppler shift population from near the start of the interval. The second population, high Doppler shift spectra, although somewhat spread in altitude, maximise in occurrence near 120 to 130 km. These two populations overlap in the width-altitude distribution (Fig. 8a), but we know from Fig. 7 that high Doppler shifts are associated with lower spectral widths and vice versa. The third population, low negative Doppler shifts from near the end of the interval, occur mainly between altitudes of 80 and 100 km, and are indeed largely associated with very low spectral widths, 1ν < 25 m s−1. The inset panel of Fig. 8a concentrates on this low altitude, low spec-tral width population (note that the colour scale is expanded here), within which one observes a general increase in spec-tral width from 0–10 m s−1at 80 km to 20–25 m s−1at 100 km. Figure 8c shows the overall altitude occurrence distri-bution of the backscatter. It is clear that most backscatter originates near an altitude of 120 km, but that a significant population exists below this point.
In a last note, it is interesting to investigate the spectral
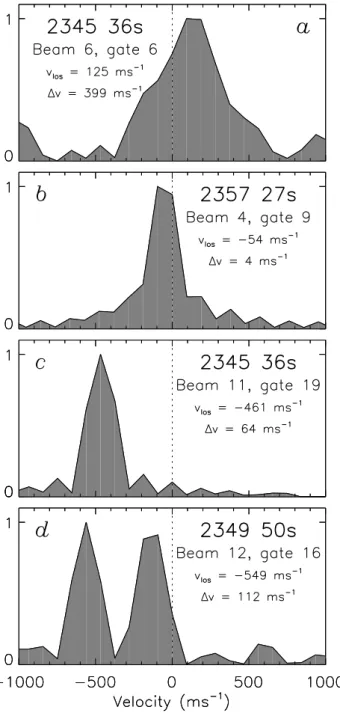
shapes associated with the different backscatter populations identified above. Figure 9 contains four representative spec-tra indicating the typical shapes from: a) the low Doppler shift, high spectral width population from near the start of the interval (2345.36 UT, beam 6, gate 6); b) the low Doppler shift, low spectral width population from near the end of the interval (2357.27 UT, beam 4, gate 9); c) the high Doppler shift, low spectral width population (2345.36 UT, beam 11, gate 19); d) a high Doppler shift component superimposed on the low Doppler shift population (2349.50 UT, beam 12, gate 16). The beams and range gates from which these spec-tra are taken are indicated in Figs. 4 and 5. We draw at-tention to the similarity between spectra a) and c) and type II gradient drift returns and type I ion-acoustic returns ob-served by VHF radars, respectively (see Haldoupis, 1989). Analysis of the ACF associated with the spectrum in Fig. 9b gives a spectral width of only 4 m s−1, exceptionally narrow for HF radar backscatter. As will be discussed below, only backscatter from meteor trails has similarly narrow spectra. In general, large regions of high Doppler shift spectra, such as observed at 2342.13 and 2345.36 UT, are single compo-nent (see Fig. 9c), whereas smaller regions, such as observed at 2349.50 and 2353.13 UT, are double component (see Fig. 9d). Of course, the double- or single-peak appearance of the spectra ultimately depends on the backscatter power in each component; if the backscatter cross-section of the high phase speed waves is much greater than that of the low phase speed waves, only a high Doppler shift component will be apparent in the spectrum.
3 Discussion
An L-shell-aligned region of backscatter originating in the lower E- to lower F-region (80–150 km) is investigated. The
Fig. 9. Self-normalised Doppler spectra from the radar cells
high-lighted in Figs. 4 and 5. The line-of-sight velocity and spectral width derived for each spectrum by the ACF analysis technique are indicated in the panels.
L-shell-aligned nature of this feature is characteristic of E re-gion backscatter observed previously by Villain et al. (1987, 1990) and Milan and Lester (1998, 2001). The backscat-ter region appears bounded at its poleward and equatorward edges by optical auroral arcs, though these change signifi-cantly in intensity throughout the interval. At the start of the interval, the poleward arc is most luminous, but this situa-tion is reversed by the end of the interval. The backscatter itself is associated with a region of no optical luminosity. If the arcs represent sheets of upward field-aligned current,
car-ried by precipitating electrons, then it might be expected that the region in between, co-located with the backscatter, is as-sociated with return downward field-aligned current, carried by up-welling thermal electrons. The observed rotation in the direction of flow from predominantly westwards to pre-dominantly eastwards throughout the interval is perhaps as-sociated with the change in relative luminosity of the two auroral arcs and hence the variation in the field-aligned cur-rent structure in the vicinity of the backscatter region. At the start of the interval, the arc (and presumably the associ-ated upward field-aligned current) poleward of the downward field-aligned current region is most intense, and the Pedersen closure current and horizontal electric field will be directed northwards. The corresponding Hall current will be directed eastwards and the electron flow (in the E × B direction) will be westwards. At the end of the interval, the equatorward arc is most intense, and the electron flow is expected to be directed eastwards.
Within the backscatter region, three main spectral popula-tions are observed. The first comprises broad, low Doppler shift spectra, 0 < νlos<150 m s−1and 100 < 1ν < 400 m
s−1, which originate in the main between altitudes of 110 and 120 km. The second comprises narrower, high Doppler shift spectra, −500 < νlos< −350 m s−1and 50 < 1ν < 200 m
s−1; these spectra appear superimposed on the low Doppler shift population. As mentioned above, Villain et al. (1987, 1990) interpreted similar observations of two such popula-tions as gradient drift waves whose Doppler shifts are char-acteristic of the line-of-sight component of E × B/B2, and ion-acoustic or electrostatic ion cyclotron (EIC) waves with phase velocities greater than E × B/B2, respectively. The latter are present in a region of sub-critical E, i.e. in a region of electric field that is below the threshold necessary for the growth of this instability, or in other words, E/B < CS, where CS ≈ 400 m s−1 is the local ion acoustic speed. However, Chaturvedi et al. (1987) predicted that such waves could be generated if significant field-parallel electron drifts (field-aligned currents) were present. Villain et al. identi-fied the particle population responsible for the generation of these waves as up-welling thermal electrons. In the present study, this link with up-welling electrons is consistent with the probable co-location of the backscatter with a region of downward field-aligned current. Villain et al. also suggested that such waves should form in the upper-E region, which is also consistent with the presently observed preponderance of such waves at altitudes between 120 and 130 km. How-ever, ion-acoustic or two-stream waves and EIC waves are predicted to have the dispersion relationships ωk =kCS and
ω2k =2i +k2CS2, respectively, where ωk is the irregularity wave frequency, k is the wave number, and i is the ion gy-rofrequency. The Doppler shift of such waves, νlos =ωk/ k, should then be independent of the look-direction of the radar, i.e. independent of L-shell angle φ. This is not the case in the present observations, as demonstrated in Fig. 6, in which the high Doppler shift population appears to obey a cosine-dependence on the radar look-direction, though dif-ferent from that of the low Doppler shift population. Such
a cosine-dependence is characteristic of high Doppler shift spectra, described as “population iii" by Milan and Lester (1999, 2001), though the reason for this is not yet known. As a final point of interest regarding the high Doppler shift population, we note the similarity between the spectrum pre-sented in Fig. 9d and those found to be associated with dis-crete auroral arcs by Milan et al. (1999). There, again, a high Doppler shift component was superimposed on a pre-existing low-flow background. Milan et al. offered two al-ternative mechanisms by which the subsidiary high Doppler shift peak could be observed. In the first, the subsidiary peak corresponded to the small-scale but intense electric field as-sociated with the arc electrodynamics; the high electric field region was presumed to be small relative to a standard 45 km range gate and hence, low and high Doppler components co-existed within a single radar cell. In the second, the prox-imity of the high Doppler shift peak to the E region ion-acoustic speed was suggestive of the operation of the two-stream or ion cyclotron instability in the presence of, or ad-jacent to, regions of precipitation, as suggested by Villain et al. (1987, 1990). The present observations indicate that the high Doppler shift region can extend over large areas, incor-porating many range cells, and as such, is more likely to be produced by the second mechanism. We note in passing that the spectra of backscatter feature A, which is closely associ-ated with auroral arc 1, are narrow with (in this case, positive) Doppler shifts near CS, again similar to the observations of Milan et al. (1999).
In the first portion of the interval under study, a very sharp demarcation is observed between echoes with very different Doppler shifts, especially in Fig. 4j. Such a sharp demar-cation between echo characteristics has previously been re-ported by Milan et al. (2001), who termed the near-range echoes “population v". It is interesting to note that there is no evidence in the optical observations to suggest that this boundary is co-located with any change in auroral luminos-ity, and hence we can surmise, changes in the arc electrody-namics or the E region electron density. We suggest that this boundary separates two regions of the radar field-of-view in which the radar is most sensitive to irregularities formed by different instability mechanisms perhaps occurring at differ-ent altitudes. This argumdiffer-ent is similar to the ideas of coherdiffer-ent radar signal formation in the E region proposed by Uspensky (1985) and Uspensky and Williams (1988).
Towards the end of the interval, there is a marked decrease in the width of the low Doppler shift spectra and a decrease in the altitude from which this backscatter originates. This low altitude, low spectral width, low Doppler shift backscat-ter comprises the third spectral population. While there ap-pears to be a general evolution from one low Doppler shift population to the other, these two spectral populations can also co-exist. For instance, in Fig. 6d, two low Doppler shift regions are observed: one with a fitted flow azimuth of 295◦and the other 330◦. The altitude measurements from this time indicate that the latter region (the region with more negative Doppler shifts and lower νmag) originates from a
lower altitude than the former. This low altitude
popula-tion then continues to be observed in Fig. 6e and f. The transition to low spectral width, low altitude backscatter ap-pears to be accompanied by auroral luminosity region 2 ex-panding polewards over the radar field-of-view; this auroral region is, by this time, pulsating. While most visible au-rora have peak emission altitudes near 110 km, Stenbaek-Nielsen and Hallinan (1979) employed stereographic cam-era observations to demonstrate that the emission intensity of pulsating aurora tends to peak in the lower E region, as low as 90 km altitude. Stenbaek-Nielsen and Hallinan also noted that the vertical extent of these aurora was much nar-rower than could be explained by collisional deposition of the energy of the precipitating electrons. They suggested instead that wave-particle interactions could be likely can-didates for the efficient extraction of energy from the pre-cipitating particles in the lower E region, producing atten-dant ionisation and luminosity. At these low altitudes, the ionospheric plasma is highly collisional, and it might be ex-pected that the drift speed of the irregularities from which the radar is scattering is constrained to be close to the neutral wind speed, which, in general, is low. This would explain the low Doppler shifts observed at these low altitudes and also might contribute to lowering the spectral width of the backscatter echoes. However, the spectral widths associated with this low altitude backscatter are exceptionally narrow, with 1ν < 25 m s−1, whereas ionospheric backscatter typi-cally has spectral widths between many tens and many hun-dreds of m s−1. We note that the spectra of backscatter from meteor trails, which are also observed in the 80–100 km alti-tude range, are also exceptionally narrow (Hall et al., 1997). Meteor echoes are, in general, scatter from an underdense ionisation trail, and not Bragg scatter from periodic ionisa-tion perturbaionisa-tions produced by ionospheric instability mech-anisms. In meteor scatter, the spectral width of the return signals is governed by the diffusion decay time of the meteor trail electron density, and is not characteristic of the growth and decay time-constants of instability processes. As dis-cussed by Hall et al., the spectral width of backscatter from such diffusion-dominated density structures is given by
1ν =8π D/λ (3)
where D is the diffusion coefficient and λ is the radar wave-length. D increases exponentially with altitude from near 0.7 m2s−1at 80 km to 20.0 m2s−1at 100 km, corresponding at a radar frequency near 10.5 MHz to spectral widths of 0 and 20 m s−1, respectively. We have superimposed this prediction of
1ν, as a function of altitude, on the inset panel of Fig. 8a, and find good qualitative agreement with the observations. It is possible, then, that a similar non-coherent scattering pro-cess is taking place during the present interval at these low altitudes, i.e. that backscatter is observed from irregular den-sity perturbations or blobs of plasma. These denden-sity pertur-bations would then diffuse in much the same manner as me-teor trails and result in a very narrow backscatter spectrum. In this picture, these density blobs are produced by the spo-radic precipitation associated with the pulsating aurora.
4 Summary
The spectral characteristics of HF coherent radar backscatter from the lower ionosphere are not, in general, directly related to the background electric field, but are dependent on the alti-tude of the scatter volume and are modified in the vicinity of electron precipitation. During the interval of study, backscat-ter from near the peak of the E region falls into two spectral classes: broad, low Doppler shift, and narrow, high Doppler shift spectra, similar to type II and type I spectra observed by VHF radars, respectively. The high Doppler shift spectra appear to be present in a region of sub-critical electric field, and hence it is postulated, following Villain et al. (1987, 1990), that free energy for the excitation of the two-stream or electrostatic ion cyclotron instabilities is available from ther-mal, up-welling electrons, in addition to that which is avail-able in the horizontally-drifting electron population. Such up-welling electrons could be found in a region of down-ward field-aligned current, and this is consistent with the lo-cation of the backscatter feature between two auroral arcs. This high Doppler shift population appears superimposed on the low-flow component, though appears predominantly in zonally-pointing beams. A significant question remains, first identified by Milan and Lester (2001): why do the flow an-gle dependencies of the Doppler shift of these two spectral populations appear consistent with irregularity drift in such radically different directions, even though these echoes ap-pear to arise in the same location, though potentially at dif-ferent altitudes? Unfortunately, the present observations do not provide a definitive answer to this question.
A third spectral population of exceptionally narrow, low Doppler shift spectra is observed to originate from below the E region peak, predominantly from the altitude range 80 to 100 km. These spectra are perhaps associated with pulsat-ing auroral forms, which have been previously demonstrated to deposit most energy at altitudes near 90 km (Stenbaek-Nielsen and Hallinan, 1979). The spectral width of the back-scatter argues for a non-coherent back-scattering process from den-sity blobs generated in the lower ionosphere by the pulsat-ing auroral form. The spectral width is then controlled by the diffusion timescale of these density perturbations, and is not characteristic of the growth and decay of instability-generated irregularities.
Past studies of coherent HF radar backscatter from E re-gion altitudes have suggested that a rich variety of spectral classes exist. It is possible that many of the differences be-tween these observations and those conducted with VHF ra-dars are a consequence of the broader altitude range over which backscatter can be detected with the HF radar tech-nique. Clearly, more investigation of the relationship be-tween the spectral characteristics and altitude of origin of backscatter is needed.
Acknowledgements. CUTLASS is supported by the Particle Physics
and Astronomy Research Council (PPARC grant no. PPA/R/R/1997/ 00256), UK, the Swedish Institute for Space Physics, Uppsala, and the Finnish Meteorological Institute, Helsinki. The optical auro-ral observation project in Iceland is supported by Grants in Aid for
Overseas Science Survey (grant no. 07044104, 09044106) from the Ministry of Education, Science, Sports and Culture, Government of Japan (MONBUSHO) and by Dr. T. Saemundsson for the Science Institute, University of Iceland. SEM is supported on PPARC grant no. PPA/G/O/1997/000254.
The Editor-in-Chief thanks J.-P. Villain and another referee for their help in evaluating this paper.
References
Chaturvedi, P. K., Huba, J. D., Ossakow, S. L., Saryanarayana, P., and Fedder, J. A., Parallel current effects on two-stream electrojet plasma instabilities, J. Geophys. Res., 92, 8700, 1987.
Greenwald, R. A., Baker, K. B., Dudeney, J. R., Pinnock, M., Jones, T. B., Thomas, E. C., Villain, J.-P., Cerisier, J.-C., Senior, C., Hanuise, C., Hunsucker, R. D., Sofko, G., Koehler, J., Nielsen, E., Pellinen, R., Walker, A. D. M., Sato, N., and Yamagishi, H., DARN/SuperDARN: A global view of the dynamics of high-latitude convection, Space Sci. Rev., 71, 761, 1995.
Haldoupis, C., A review on radio studies of the auroral E-region ionospheric irregularities, Ann. Geophysicae, 7, 239, 1989. Hall, G. E., MacDougall, J. W., Moorcroft, D. R., St.-Maurice,
J.-P., Manson, A. H., and Meek, C. E., Super Dual Auroral Radar Network observations of meteor echoes, J. Geophys. Res., 102, 14603, 1997.
Hanuise, C., Villain, J.-P., Cerisier, J.-C., Senior, C., Ruohoniemi, J. M., Greenwald, R. A., and Baker, K. B., Statistical study of high-latitude E-region Doppler spectra obtained with the SHERPA HF radar, Ann. Geophysicae, 9, 273, 1991.
Hanuise, C., Villain, J.-P., Gresillon, D., Cabrit, B., Greenwald, R. A., and Baker, K. B., Interpretation of HF radar ionospheric Doppler spectra by collective wave scattering theory, Ann. Geo-physicae, 11, 29, 1993.
Milan, S. E., Jones, T. B., Robinson, T. R., Thomas, E. C., and Yeoman, T. K., Interferometric evidence for the observation of ground backscatter originating behind the CUTLASS coherent HF radars, Ann. Geophysica, 15, 29, 1997a.
Milan, S. E., Yeoman, T. K., Lester, M., Thomas, E. C., and Jones, T. B., Initial backscatter occurrence statistics from the CUT-LASS HF radars, Ann. Geophysicae, 15, 703, 1997b.
Milan, S. E. and Lester, M., Simultaneous observations at differ-ent altitudes of ionospheric backscatter in the eastward electrojet, Ann. Geophysicae, 16, 55, 1998.
Milan, S. E., Davies, J. A., and Lester, M., Coherent HF radar backscatter characteristics associated with auroral forms identi-fied by incoherent radar techniques: a comparison of CUTLASS and EISCAT observations, J. Geophys. Res., 104, 22591, 1999. Milan, S. E. and Lester, M., Spectral and flow angle characteristics
of backscatter from decametre irregularities in the auroral elec-trojets, Adv. Space Res., 23 (10), 1773, 1999.
Milan, S. E., Lester, M., Sato, N., Takizawa, H., and Villain, J.-P., Investigation of the relationship between optical auroral forms and HF radar E region backscatter, Ann. Geophysicae, 18, 608– 617, 2000.
Milan, S. E. and Lester, M., A classification of spectral populations observed in HF radar backscatter from the E region auroral elec-trojets, Ann. Geophysicae, 19, 189, 2001.
St.-Maurice, J.-P., Prikryl, P., Danskin, D. W., Hamza, A. M., Sofko, G. J., Koehler, J. A., Kustov, A., and Chen, J., On the origin of narrow non-ion-acoustic coherent radar spectra in the high-latitude E region, J. Geophys. Res., 99, 6447, 1994.
Stenbaek-Nielsen, H. C. and Hallinan, T. J., Pulsating aurora: Ev-idence for collisional themalization of precipitating electrons, J. Geophys. Res., 84, 3257, 1979.
Uspensky, M. V., On the altitude profile of auroral radar backscatter, Radio Sci., 20, 735, 1985.
Uspensky, M. V. and Williams, P. J. S., The amplitude of auroral backscatter: 1. Model estimations of the dependence of electron density, J. Atmos. Terr. Phys., 50, 73, 1988.
Villain, J.-P., Greenwald, R. A., Baker, K. B., and Ruohoniemi,
J. M., HF radar observations of E region plasma irregularities produced by oblique electron streaming, J. Geophys. Res., 92, 12327, 1987.
Villain, J.-P., Hanuise, C., Greenwald, R. A., Baker, K. B., and Ruohoniemi, J. M., Obliquely propagating ion acoustic waves in the auroral E region: Further evidence of irregularity production by field-aligned electron streaming, J. Geophys. Res., 95, 7833, 1990.