EcoGRAFI
2nd International Conference on Bio-based Building Materials & 1st Conference on ECOlogical valorisation of GRAnular and FIbrous materials
June 21th - 23th 2017 Clermont-Ferrand, France
LIME AND HEMP CONCRETE LCA: A DYNAMIC APPROACH OF GHG
EMISSIONS AND CAPTURE
T. Lecompte1*, A Levasseur2, D Maxime2
1 Univ. Bretagne Sud, FRE CNRS 3744, IRDL, F-56100 Lorient, France
2 CIRAIG, Department of Chemical Engineering, Polytechnique Montréal, Montreal, Canada *Corresponding author; e-mail: [email protected]
Abstract
Lime and hemp concretes are well known and studied as low-impact materials for building. During the last two decades, a few studies have shown their interest in terms of environmental impacts such as embodied energy, air pollution or GHG emissions. On the other hand, new carbon footprint calculation methods were proposed to assess the value of temporarily storing carbon in long-lived products such as building structures and insulation. This is an important aspect for bio-based materials, as they capture and store carbon. From an environmental point of view, it would be of interest that GHG emissions due to cultivation, manufacturing, transportation, construction, demolition and end-of-life could be compensated by the beneficial effect of a long-term carbon storage. The principal aim of this study is to evaluate the long-term effect on climate change of using LHC in building. GHG emissions and uptakes were assessed using a dynamic life cycle assessment approach for several scenarios: 1) different cultivation practices for hemp (in the French context, surveys of 2014-2015 provided by the Cetiom), and 2) different mixes and formulations for the LHC, i.e. two classical ones: sprayed and cast LHC, and a more innovative one: compacted LHC. Whatever the formulation, a woody structural frame is necessary, composed of local timber wood (less than 100km from construction site). To take into account the emission dynamics, plants growing (trees and hemp) and carbonation of lime into the walls were considered. Optimum scenarios were compared, by taking the minimum and maximum impact for each mixes (different cultivation practices, transportation of lime and hemp, end-of-life scenarios). As a result, some LHC with high hemp/lime ratio, low-impact crop practices, and a proper end-of-life scenario could be a solution to stock carbon and keep a positive effect on climate, even on the long-term (more than 100 years).
Keywords: Lime and hemp concrete, LCA, long term green house effect, dynamic approach
1 INTRODUCTION
While climate change is now a fact that people are aware of, bio-based building materials are considered as a part of the solution, thanks to the storage of carbon into the building structure and insulation. Plants capture CO2 when they grow up, and this carbon is stored during the whole lifespan of the material. Lime and Hemp Concrete (LHC) is a well-known bio-based material, whose life cycle was assessed by many workers [Ip 2012, Pretot 2014, Adrianandraina 2015]. In the other hand, the environmental pertinence of croplands developments for non-alimentary goods was clearly questioned [Searchinger 2008, Fargione 2008]. The land use-change can effectively raise higher long-term GHG impacts than the annual sequestering of the crops. This is barely the case in Europe, as the forest span is currently growing. Furthermore, in France the current land occupation of hemp crops remains constant and very negligible compared to other crops as wheat, corn or sugar beats. So assuming no
destination change (forest => crop or meadows => crop) is credible.
Lime and hemp concrete LCAs in literature mainly study the impacts without consideration of time. Yet carbon-footprint calculation standards and methods provide guidance on how to assess temporary carbon storage in long life products, taking into account an arbitrary time horizon (generally 100 years). The calculated benefits clearly depend on this accounting time horizon [Levasseur 2012]. Since its first
assessment method [IPCC 1990], the
Intergovernmental Panel on Climate Change (IPCC) uses the metric of global warming potential (GWP). GWP is the radiative forcing caused by the release of a unit mass of a given greenhouse gas integrated over a prescribed time period, relative to that of a unit mass of CO2, and measured in kilograms of carbon dioxide equivalent per kilogram of greenhouse gas (kg CO2e kg−1). That is the method preconized by Levasseur et al. [Levasseur 2012b] to address the temporary storage of biogenic carbon with a dynamic life cycle
assessment. During the lifespan of the building, the lime into the LHC will carbonate and store carbon too; the hemp will keep its carbon until its life end, depending on the scenario after demolition (landfill, energy, recycling…).
In this paper, the aim is then to propose a Dynamic LCA of lime and hemp composites, by varying the mix designs and application processes. Several scenarios are also assessed. Different cultivation practices for hemp in France, mainly based on recent data of 2014 and 2015 [Cetiom 2015], different mixes and formulations for the lime and hemp concrete are studied. The life span is 70 years for the building; a woody structural frame with CO2 uptakes considered as the uptakes of the following cohort trees during 50 years; the consideration of carbonation of the lime into the walls, spread over the 12 years after setting. The timeline is as follows:
Year 1: Crop of hemp and storage
Year 2: Transformation/ Fabrication of Lime, Sand, water, timber wood and Shiv ; Shipping to the distributors (50km-500km) ; Transports from distributors to the workplace (50km); Setting in the workplace.
LIME CARBONATION:
Years 3 to 12: Carbonation of the lime into the wall (core materials and renders)
Year 34: Carbon uptakes and impacts due to hemp crop for renders
Year 35: Renders changing
Years 36-45: Carbonation of the new renders WOOD GROWING:
Years 3 to 53: rising of the wood that replaces the one for the frame.
Year 70: demolition Year 71 and after: life end
2 HEMP SHIV
2.1 Hemp crop operations (Functional Unit=hemp field of one ha)
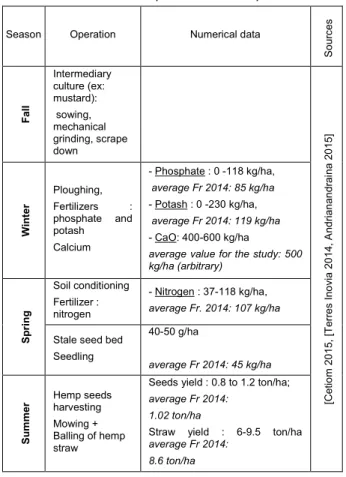
The different steps and data around the hemp culture are given in Tab.1. Hemp is an excellent break crop, improving soil structure, is disease resistant and needs no pesticide nor fungicide. Hemp can be cultivated only for straw, or for straw and seed (two different harvestings). In the case of seed and straw harvesting, Andrianandraina et al. [2015] subtract 1 ton from the straw yield. The straw yield is strongly correlated with the Nitrogenous fertilizer [Bouloc 2006]. Some authors have modeled this correlation [Andrianandraina 2015]: a relative yield of 107% above a Nitrogen input of 90 kg/ha and (0,262 N + 83,75) % below 85 kg/ha. The different operations of Tab. 1 were modeled with OPENLCA®, using the French agricultural database Agribalyse 1-2 and Eco-invent 3-2. Agribalyse had to be modified to be compatible with Eco-invent 3-2. For the hemp seeds, no data exists. Then an equivalent market, those of rape seeds, was chosen. The operation durations were found in [Cetiom 2015] and [Agdex 2012].
2.2 GHG Impacts of hemp Crop (Functional Unit=1 ton of straw)
For the harvesting of straw, Andrianandraina et al. [2015] give a value of 154 kg CO2eq/ton of straw,
whereas an earlier study [van der Werf 2004] gave 347
kg CO2eq/ton. Andrianandraina et al. provide the detailed contribution of each operation/fertilizer for their default scenario that corresponds to average values of yield and fertilizers amount.
Table 1: The different operations of hemp cultivation
Season Operation Numerical data
S o u rc e s F a ll Intermediary culture (ex: mustard): sowing, mechanical grinding, scrape down [Ce tio m 2 0 1 5 , [T e rr e s In o via 2 0 1 4 , A n d rian a n d ra in a 2 0 1 5 ] W in te r Ploughing, Fertilizers : phosphate and potash Calcium - Phosphate : 0 -118 kg/ha, average Fr 2014: 85 kg/ha - Potash : 0 -230 kg/ha, average Fr 2014: 119 kg/ha - CaO: 400-600 kg/ha
average value for the study: 500 kg/ha (arbitrary) S p rin g Soil conditioning Fertilizer : nitrogen - Nitrogen : 37-118 kg/ha, average Fr. 2014: 107 kg/ha Stale seed bed
Seedling 40-50 g/ha average Fr 2014: 45 kg/ha S u m m e
r Hemp seeds harvesting
Mowing + Balling of hemp straw
Seeds yield : 0.8 to 1.2 ton/ha; average Fr 2014:
1.02 ton/ha
Straw yield : 6-9.5 ton/ha average Fr 2014:
8.6 ton/ha
In our study, different scenarios are assessed and are sketched in Table 2. The results of GHG emission for the whole hemp crop over 1ha are given on Tab. 3. It is also possible to deduce the impact of raw materials fabrication, transports and agricultural operations for hemp straw, starting from soil preparation to storage in the farm, by using the yields of straw.
Table 2: The different scenarios for the assessment of the agricultural practices of hemp crop
Fertilizers
• F1: minimum amount of fertilizers and seeds, straw yield= 6t/ha
• F2: average amount of fertilisers and seeds; France ; straw yield=
8.6t/ha West of
France ; straw yield= 8.8t/ha East of Fance ; straw yield= 8.2t/ha • F3: maximum amount of
fertilizers and seeds, straw yield= 9.5t/ha
Agricultural operations and Harvesting • France: 51% of surfaces for
seed and straw, 49% only for straw, Straw Yield 8.6t/ha
• East of France: 93% for seed and straw, 7% only for straw, Straw Yield 8.2t/ha • West of France: 35% for
seeds and straw, 65% only for straw, Straw Yield 8.8 t/ha
It is considered that a green manure has been made on
63% of the surfaces
[Cetiom2015] ; when seeds and straw are harvested,
two harvestings are
considered: one for seeds with a combine harvester and one for straw with a hay chopper.
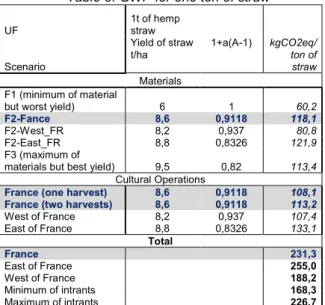
In this study, and contrarily to [Andrianandraina 2015] we don’t remove 1 t/ha when seeds are harvested, but we keep the straw yields given by [Cetiom2015] that are representative of the average yields in France(average), east of France and west of France. To assess the impact of 1 ton of straw, the fact that seeds are harvested or not must be considered. If no seeds are harvested, the conversion between the impacts of one ha of crop and one ton of straw is directly correlated to the straw yield, whereas in the case of seeds harvesting, an economical allocation is added. It follows:
𝐼𝑚𝑝𝑎𝑐𝑡 𝑅𝑎𝑡𝑖𝑜 =𝐼𝑚𝑝𝑎𝑐𝑡 (1 𝑡𝑜𝑛 𝑜𝑓 𝑆𝑡𝑟𝑎𝑤)I𝑚𝑝𝑎𝑐𝑡 (1 ℎ𝑎 𝑜𝑓 𝑐𝑟𝑜𝑝) = 1+α (𝐴−1)𝑌
𝑠𝑡𝑟𝑎𝑤 (1) Where A is an economic allocation factor and is the proportion of seed harvesting in the considered area (for example 0.51 in France, cf. Table 3); while Ystraw is the average straw yield in the area. ‘A’ was estimated assuming that one kg of hemp seed is sold twice the price of the straw (this assumption is the result of a prices study in stores in France in 2016: ≈2€/kg for seeds (10% of the plant in mass), ≈0.7€/kg of shiv (50% of straw mass), ≈2€/kg of fiber (33% of straw mass). We obtain an economic allocation for straw A=0.82.
For an agricultural impact study, we know that the main greenhouse-gas are N20, CH4 and CO2. The others are generally neglected. They won’t be treated in this “dynamic” study. But the CO2eq provided by OPENLCA takes the whole GHG into account. The calculation method is ReCiPe MidPoint (H). The main results are given in Tab.3.
Table 3: GWP for one ton of straw
UF 1t of hemp straw Scenario Yield of straw t/ha 1+a(A-1) kgCO2eq/ ton of straw Materials F1 (minimum of material
but worst yield) 6 1 60,2
F2-Fance 8,6 0,9118 118,1
F2-West_FR 8,2 0,937 80,8
F2-East_FR 8,8 0,8326 121,9
F3 (maximum of
materials but best yield) 9,5 0,82 113,4
Cultural Operations
France (one harvest) 8,6 0,9118 108,1
France (two harvests) 8,6 0,9118 113,2
West of France 8,2 0,937 107,4 East of France 8,8 0,8326 133,1 Total France 231,3 East of France 255,0 West of France 188,2 Minimum of intrants 168,3 Maximum of intrants 226,7
In the French context, the impact of seeds and fertilizers fabrication and transport, and of cultural operations, without taking into account the emissions due to fertilizers in the crop field then ranges between 168kgCO2eq by ton of hemp straw (locally provided by a low-impact agricultural practice) and 255kgCO2eq by ton (East of France Market). The average in the whole France territory, based on 2014 data, is 231kgCO2eq/ ton of straw.
2.3 Carbon storage into the ground
Boutin et al. [2006] evocate amounts of 100 to 300 kgCO2/ ha potentially stored by year into the field ground. With a straw yield ranging between 6 and 9.5 tons/ha, and taking into account the seed harvesting proportion, the carbon storage into the ground could
represent 10.5 to 50 kgCO2/ ton of hemp straw (Tab. 4).
Table 4: Carbon storage into the ground versus yield of straw
Straw yield (ton/ha)
Carbon storage (kg/ton of straw)
Minimum of fertilizers : 6 t/ha 17 – 50
East of France: average 8.2 t/ha 11 – 33
France: average 8.6 t/ha 11 – 33
West of France : average 8.8 t/ha 10 – 28
Maximum of fertilizers : 9.5 t/ha 9 – 26
2.4 Consideration of the fertilizers emissions in the field-air
It must be kept in mind that the emissions due to fuel consumption of the machinery is not considered here, as it is already considered in the “cultural operation impact” inventory. The emissions in the air in the inventory for hemp crop are NH3, NOx, N2O, CO2 fossil.
CO2 emission due to a soil destination change is not taken into account here, as we consider that hemp is cropped in conventional agricultural rotations.
Firstly, only N2O will be treated. The IPCC approach is used. The results are deduced from the nitrogeneous fertilizer proportions of Agribalyse.
2.5 Carbon dioxide storage of Shiv
According to Boutin et al. [2006], 1.7 ton of CO2 are stored for the production of 1 ton of dry mater. Pretot et al. [2014] take a value of 2.1 ton of CO2 stored by ton of shiv while Ip and Miller [2012] use a value of 1.53 ton of CO2. By considering that the Carbon uptake of the plant is about 47% of its dry mass [Boutin 2006], it makes 470 kg of C by ton of Shiv, and then 1.72 ton of CO2 by ton of dry matter. The moisture content in mass fraction of straw is 11-14% [Gonzales 2010], leading to uptake 1.53 ton of CO2 by ton of hemp straw with 11% moisture. Actually, Boutin et al.[2006] (considering dry matter) and Ip and Miller (considering moisture of straw) have the same size order for CO2 uptake. This is the amount taken in the present study: CO2 uptake = 1.7 kg/kg of dry straw = 1.53 kg/kg of straw at 11% moisture
2.6 Primary transformation, hemp shiv production
Hemp shiv is a by–product of hemp fiber industry. 4 tons of hemp straw per hour are considered to be processed [Ip 2012]. Shiv represent 40-55% of the stem weight, and fibers 31-37% (and 10-28% of organic powder) [Cetiom 2015]. On an economic point of view, shiv weights 32% and fibers 68% (organic powder is neglected) [Boutin 2006, Prétot 2014, Andrianandraina 2014, Turunen 2006]. In the present study, the allocation of cultivation and primary transformation impacts on shiv is an economic allocation (32%), whereas a mass allocation is done for CO2 sequestration into the straw (50%). Entering the values of Boutin et al [Boutin 2006] in OpenLCA, we obtain a global warming impact of 25.75 kgCO2eq/ton of straw.
Gonzales-Garcia et al. [2010], give a value of 432 kg CO2eq/ ton of straw for the total impact of primary transformation and agriculture (without taking into account the uptakes). In the present study, and not taking into account plant and soil uptakes, we find values ranging between 266 and 409 kgCO2eq, with
an average value for France (survey numbers of 2014) of 381 kgCO2eq by ton of treated hemp straw, from soil preparation to the hemp factory exit.
2.7 Transport of Shiv to distribution place
Boutin et al. [Boutin 2006] consider a distance of hemp shiv towards the workplace as follows: 260 km from hemp distributor, and 30 km from the distributor to the workplace. Pretot et al. [2014] consider a value of 300 km for the hemp shiv. Ecoinvent Database provides some recommendations in terms of transportation [Borken-Kleefeld 2012]. Table 5 shows the values advised for markets that are close to hemp market. It’s very difficult to conclude about the distance made by shiv. Actually, an estimation could be made from the map of suppliers in France (Fig.1 [Meirhaege 2011]).
Table 5. Transport works per kg according to EcoInvent for different markets [Borken-Kleefeld 2012]
Truck Rail Pulp, newsprint, paper, and paperboard 344 kg.km 312 kg.km Other wood products 149 kg.km 86 kg.km
Figure 1: Primary transformation places of Hemp, Flax and Miscanthus in France [Meirhaege 2011]
Figure 2: Shiv transportation: impact of shipping distance on the GWP and CO2 emissions. The maximum distance made by shiv can be assumed 500 km in the metropolitan area. Logically, to think about ecological material shall mean “work with locally supplied materials”. In this point of view, shiv should not travel more than 50-100 km between its primary transformation place and its application workplace. So in this study, the minimum distance will be assumed at 50 km and the maximum at 500 km, keeping in mind that such a product should better be used in the western area and in the North-East of France (cf.
Fig.1). The transports are mainly made by trucks, with a problem due to the hemp shiv density: hemp shiv in a bulk state is currently conditioned in bags of 200l and around 24kg, meaning a density of 120 kg/m3. In Europe, a 24 ton-capacity articulated lorry actually has a maximum volume capacity of 100 m3. Then it can ship a maximum of 12 tons of material. It means that considering a half-load outward, the input flow will be twice as usual. This is a real argument to develop this kind of material locally, for example by opening the supply chains to other bio-based aggregates like sunflower, flax, elephant grass, rice husks etc. The question of the inward must also be considered. Normally an empty inward is as much as possible avoided by the shipping companies. We can assume that for short distances, an empty inward is more likely than in long distances. So a linear function has been used for the flows, considering a work by ton of shiv of 4km.t by km of shipping distance in case of shortest distances, and only 2km.t for the maximum distance. Fig.2 provides the considered GWP as a function of the shipping distance between primary transformation and provider place.
2.8 Assessment of the Hemp Shiv, Cradle to distributor
Figure 3: Influence of each process on the emissions and climate change Impact during year 1: crop and
storage in France.
Figure 4: Contribution of transport and primary transformation on climate change impact during year 2,
as a function of shipping distance
On a GHG-dynamic point of view, one must consider the emissions and captures year by year, as suggested by the IPCC. The hemp shiv culture will be considered the first year, and its transformation and transportations will be considered the second year. To compute the GHG emissions due to hemp shiv production and transport, from cradle to gate, we use the following equations:
1000 km
Hemp Flax Miscathus
First Year:
N2OSHIV= 0.32/0.5 N2OSTRAW
CH4-SHIV= 0.32/0.5 CH4-STRAW
CO2-SHIV= 0.32/0.5 (CO2-STRAW - CO2-GROUND-UPTAKE -) - CO2-SHIV-UPTAKE
Second Year:
N2OSHIV= 0.32/0.5 N2OTRANFORMATION +N2OTRANSPORT
CH4-SHIV= 0.32/0.5 CH4-TRANFORMATION + CH4-TRANSPORT
CO2-SHIV= 0.32/0.5 CO2-TRANFORMATION + CO2-TRANSPORT
Figs. 3&4 give the ranges of emissions assessment, depending on the agricultural scenario and uptakes uncertainty, for Year 1 and Year 2
3 BINDER
3.1 Lime fabrication (Fonctional Unit: 1ton of Lime)
Lime is used in construction since at least 10000 years [Ventola 2011]. The benefits of lime are that it is highly porous and has high permeability; this allows the material beneath the lime to ‘breath’. The lime fabrication mainly consists in a calcination, that is to say a decarbonation: CaCO3 => CaO + CO2. Then the environmental impact of lime is mainly due to geogenic CO2 emissions and to the heating fuel used for this burning. Using novel innovative means of heating as solar thermal energy to drive calcium oxide production should minimize carbon dioxide emission [Licht 2012], but the geogenic emission can’t be avoided, unless mixing lime with secondary materials, as already widely done in cement industry [Habert 2010]. The two usual kinds of lime must be distinguished: the hydraulic lime and the non-hydraulic lime, also called “hydrated lime” or “Slaked Lime”. Slaked lime is obtained from the slaking of quicklime (CaO) derived from burning of limestone and is mostly composed of calcium hydroxide Ca(OH)2. At the contrary, hydraulic lime results from calcination of chalky siliceous limestone, thereby giving rise to reactive silicates. After slaking, hydraulic lime consists of Ca(OH)2 and belite (Ca2SiO4 also called C2S in cement industry) [Chabannes 2015].
Hydraulic lime
Kellenberger et al. [2007] provide the chemical composition of the raw materials for hydraulic lime (Tab. 6).
Table 6: Chemical composition of the raw materials for hydraulic lime [Kellenberger 2007]
Raw material Mass ratio [%]
CaCO3 65 - 75
AL2O3 3 – 8.5
Fe2O3 0 - 4
SiO2 15 - 25
(CO2 emitted by calcination=MAX-CO2UPTAKE) 29- 34
The firing temperature of hydraulic lime is usually between 900°C and 1050°C, while for cement it is around 1450°C. As it will be described after, when used in a wall, the hydraulic lime will firstly harden thanks to hydrates formation, and secondly a carbonation will occur. This carbonation is mainly: Ca(OH)2 + CO2=> CaCO3+H20. Then, the theoretical CO2 maximum uptake due to carbonation of the lime into a construction can be correlated to the CaCO3 in the raw material before burning, i.e. to the CaO after calcination. That is to say the geogenic CO2 emissions when firing the limestone:
CO2-GEOGENIC=M(CaO) . 44 / 56=M(CaCO3). 44 / 100 Taking values of Table 6, it follows a geogenic emission, and then a potential uptake due to
carbonation CO2-GEOGENIC in the range 290 – 340 kgCO2/tonhydraulic lime.
[Pretot 2014] assume that only the portlandite (Ca(OH)2, also called C-H in cement industry jargon) of the hardened hydraulic lime will carbonate and uptake CO2. According to these authors, the amount of theoretical maximum uptake is very low: 106.9 kg CO2/ ton of lime. Actually, hydraulic lime raw materials before burning are relatively close to cement production raw materials. In their study about cement production environmental performance, [Habert 2010] provide a maximum uptake of 530 kg/ton of cement. Furthermore, in other studies, the same authors [Thiery 2012; Morandeau 2014] observe that the cement carbonation is not only correlated to portlandite, but to the total amount of calcium bearing products of hardened cement, that is in contradiction with the assumption of Prétot et al [2014]. Then a value of 340 kgCO2/tonhydraulic lime seems credible.
Non-hydraulic lime
According to [Ochoa 2010] and [Sagastume 2012], the production of one ton of lime is considered to entail emissions of around 1.2 tons of CO2. The authors provide the raw materials and mass balance for a current lime plant in Cuba. The raw materials for non-hydraulic lime fabrication mostly consist of limestone (CaCO3). It results a mass proportion of 92% of calcium hydroxide and 8% of limestone in a bag of this kind of lime. According to [Dowling 2015] the CO2 emissions due to the stoichiometric reaction weights 60-70% of emissions and the fuel used for combustion 30-40% of emissions (1kWh corresponds to 0.206 kgCO2 with gas fuel and 0.281 kgCO2 with oil fuel) [Dowling 2015,
DEFRA2008].
Taking the stoichiometric ratio, it comes 0.92 x 44/64 = 0.63 ton of geogenic CO2 emission by ton of product. Authors [Shan 2016, Sagastume 2012, Pretot 2014, Kellenberg 2007, Habert 2010] find values of geogenic CO2 emissions due to calcination between 500 and 530 kgCO2/ tPRODUCT forcement, 570 (without fuel) and 683 kgCO2/ t (with fuel) for non-hydraulic lime and between 107 and 340 kgCO2/ t for hydraulic lime. The size-order values of 0.63 ton of geogenic CO2 production by ton of product for pure non-hydraulic lime and 0.34 ton for pure hydraulic lime, will be taken in the following. In the present study, two different lime-based-binders are assessed. They both contain hydraulic lime, but the Tradical PF70® contains a large proportion of non-hydraulic lime.
Binder mixes Tradical PF70
The lime used by suppliers and self-builders in Europe is usually the Tradical PF70 or an equivalent [Tronet 2014, Tronet 2015, Prétot 2014, Boutin 2006] whose mix is 75% non-hydraulic lime (CL90S) ; 15% hydraulic binder (NHL5) ;10% pozzolana ; negligible admixtures
Table 7: CO2-GEOGENIC , corresponding to the maximum
potential uptake due to carbonation into the construction, depending on the binder type
Hydraulic lime for spraying
Applyers in France (L.Goudet, Developpement Chanvre®, personal email 03-2016) use a dedicated
Binder Type Hydraulic
lime ton/ ton
Non-hydraulic lime ton/ ton
CO2 chemically emitted ton/ ton Tradical PF70
Lime for Spraying 0.15 0.7 0.75 - 0.524 0.238
binder mix that is almost hydraulic lime. It is a special mix of 70% hydraulic lime (NHL3.5); 25% pozzolana; 5% admixtures, including a hydrophobic agent (impact neglected in the assessment). The assessment of each binder was done with OpenLCA Software, Ecoinvent3.2 Database and ReCiPe Midpoint (H) method. The GWP are 835 kgCO2eq/ton of binder in the case of Tradical PF70. That is of the same size order as in [Pretot 2014], who found 778kg/ton. In the case of lime for spraying, we find 818 kgCO2eq/ton of binder. The maximum potential uptakes, equal to the geogenic emissions during fabrication, were also calculated (Tab.7).
3.2 Transport of Lime (Fonctional Unit: 1t of Lime)
The transport of lime is a crucial point in terms of low-environmental approach. [Boutin 2006] consider that the Tradical PF70® is only provided by a Spanish plant in Gerona at 800km of their case study. This distance was also taken by [Pretot 2014]. However, similar materials are provided by French plants, as for example St-Astier®. A local material use should correspond to a best practice. Then a maximum of 500 km by lorry will be considered in the present study. It is the same for the “spraying binder”, as the applier uses two providers to ensure that the materials do not travel more than 500 km (Laurent Goudet, personal e-mail 03-2006).
3.3 Binder carbonation (Fonctional Unit: 1ton of Lime)
Case of slaked lime
The main environmental asset of this binder is the reversible behavior of the slaked lime. The hydrated lime Ca(OH)2 captures the CO2 in the ambient air, to reform limestone (CaCO3) and release water (H20). This carbonation process starts during the mix, and its rate depends on the CO2 concentration, lime quantity, diffusivity of the porous paths into the hardened material and liquid water content [Van Balen 2005]. In some cases the carbonation has been proven to recover up to 85-90% of the CO2 emitted from the calcination [Berge 2009, Thiery 2013, Lawrence 2006]. [Van Balen 1994] have modelled the lime mortar carbonation. We can assume that thanks to the hemp shiv net, the entirety of the aerial lime Ca(OH)2 will be accessible to the CO2 for the reaction. The lime carbonation is the following reaction [Van Balen 2005; Chabannes 2015]:
Ca(OH)2(s)+CO2(g) => CaCO3(s)+H20(aq)+74 kJ/mol Carbonation kinetics currently follows a roots law [Van Balen 2005, Morandeau 2014]:
x=k t1/2 (2)
where t is the age of the mortar or LHC, k is a constant called carbonation rate and x is the penetration depth of the reaction across the wall. We also can use the work of [Thiery 2013] on beds of crushed recycled concrete aggregates to propose a law for the mass of CO2 uptake:
MCO2/MCO2max=k’ t1/2= k t1/2/e (3) With e the thickness of the wall.
[Lawrence 2006] show that in the case of non-hydraulic lime mortars (one part of lime for 3 parts of sand), whatever the stone base for the sand, the depth of carbonate mortar from the surface of the specimens was around 15 mm at 180 days of age, with 80% to 90% of maximum carbonated Ca(OH)2. Then for outdoor coating of around 2cm and indoor coating of 1cm, the carbonation is considered to be effective in the whole depth of the render after the first year, with a
proportion of 80% to 90% of the potential CO2 uptake in the mix.
In the case of lime and hemp composites, [Chabannes 2015] show that the curing conditions really influence the carbonation rate. Based on [Lawrence 2006] observations, the carbonated depth will be assumed to reach a maximum carbonation ratio of 85% (15% of unreacted Ca(OH)2), and to be null behind the penetration front :
CO2 uptake= MAX-CO2UPTAKE.x/e= MAX-CO2UPTAKE.k t1/2/e =MAX-CO
2UPTAKE.k’ t1/2 (4) With x the penetration depth, e the thickness of the core material and k the carbonation rate in mm.year-1/2. k’ is an adimensioned carbonation rate, in year-1/2. The core of the wall will be considered to be in indoor conditions, as the render isolates it from outdoor weather conditions. Then for one ton of slaked lime, based on the results of [Chabannes 2015] on Lime and Hemp concretes, the carbonation rate will be
k’=30%/(10/12)1/2=33% per year1/2, with a
MAX-CO2UPTAKE= 0.63*85%= 0.538 ton of CO2 per ton of slaked lime.
Case of hydraulic lime
As a hydraulic lime reacts very similarly to a cement paste, it is assumed that its carbonation will by close to that of a cement paste. [Pade 2007] worked on the carbonation of cementitious materials. They show that the carbonation rate depends on the weather conditions and on the type of concrete. For example, for a concrete with a low strength (<15 MPa), the carbonation rate is equal to 15 mm/year0.5 indoor, and 5 mm/year0.5 in exposed conditions. In the present study, the mixes can be considered as low strength materials and the maximum carbonation of inside and outside renders will be considered to be achieved during the first year. [Thiery 2013] [Kikuchi 2011] and [Pade 2007] have made the same kind of observations on carbonation capacity of cement: for natural CO2 concentrations in air: it seems difficult to reach absorption capacities higher than 60% of the CO2 chemically emitted during calcination. For hydraulic lime, we take k’=50% per year1/2 and MAX-CO2UPTAKE= 0.34*60%= 0.204 ton of CO2 per ton of hydraulic lime. This upper rate for hydraulic lime carbonation
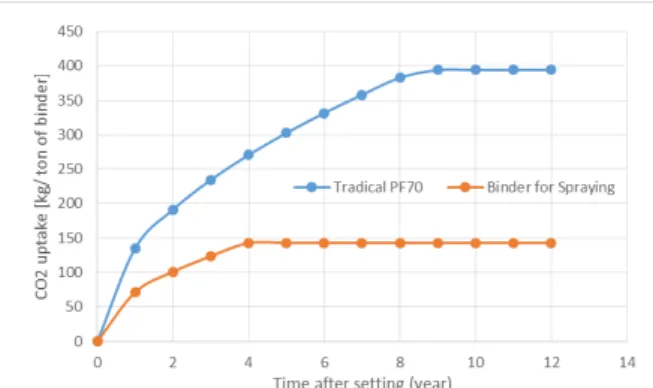
compared to slaked lime can be explained by its lower potential of carbonation, as carbonated parts will lower the carbonation progression into the hardened lime paste. Fig. 5 shows the CO2 uptakes by year for each kind of binder.
Figure 5. Kinetics of CO2 uptake implemented in the
dynamic modeling
4 CORE WALL COMPOSITION
4.1 LHC, Structure and Render
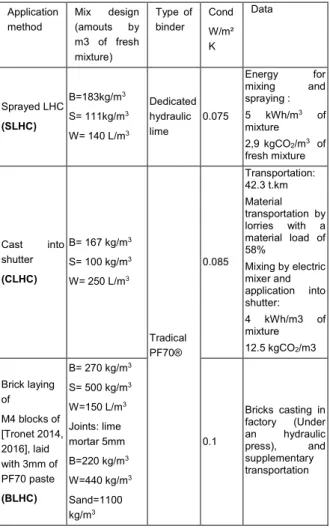
Table 8 gives three different application methods and compositions for the LHC core of the wall. An applier
based in France provided the sprayed formulation. [Ip 2012] proposed the cast formulation. It corresponds to a UK working place but can obviously be applied in France. The last one is a proposition to test a formulation with the same order of lime, but a very higher amount of shiv, to question the effect of carbon sequestration by shiv, versus higher conductivity and fabrication impacts.
A wood structure similar to those of Ip and Miller [2012] and Prétot et al. [2014] is associated with the LHC core material.
Table 8: Three LHC compositions and operations on the working area
Application method Mix design (amouts by m3 of fresh mixture) Type of binder Cond W/m² K Data Sprayed LHC (SLHC) B=183kg/m3 S= 111kg/m3 W= 140 L/m3 Dedicated hydraulic lime 0.075 Energy for mixing and spraying : 5 kWh/m3 of mixture 2,9 kgCO2/m3 of fresh mixture Cast into shutter (CLHC) B= 167 kg/m3 S= 100 kg/m3 W= 250 L/m3 Tradical PF70® 0.085 Transportation: 42.3 t.km Material transportation by lorries with a material load of 58% Mixing by electric mixer and application into shutter: 4 kWh/m3 of mixture 12.5 kgCO2/m3 Brick laying of M4 blocks of [Tronet 2014, 2016], laid with 3mm of PF70 paste (BLHC) B= 270 kg/m3 S= 500 kg/m3 W=150 L/m3 Joints: lime mortar 5mm B=220 kg/m3 W=440 kg/m3 Sand=1100 kg/m3 0.1 Bricks casting in factory (Under an hydraulic press), and supplementary transportation
4.2 Fluxes for 1m2 of wall
The Function unit is 1m2 of wall with the thickness correlated to a target of thermal insulation performance. The reference will be the usual performance of walls produced by Développement Chanvre® for the construction of new houses: walls with a thickness of sprayed LHC of 38 cm. That leads to a thermal resistance RLHC= 4.8 m²K/W for the only core of LHC, and Rtot of about 5 m²K/W if we take into account the renders and convection contributions. The building life span will be 70 years, with a lifespan for renders (indoor and outdoor) of 35 years (one renewal during the life of the building). Aiming this thermal performance, we obtain thickness of 42 cm for the
core of Cast LHC and 57 cm for the core of Bricks of LHC. To compute the BLHC, the joints were taken
into account, considering 5mm around each block boundary and 30 cm-in-height x 50 cm-in-width LHC bricks, the proportion of lime links is 2.6% of the total surface.
4.3 Other materials
The wood is a local softwood, sawn in beams of 15x15cm. For the UF, the GHG impacts are as follows: 1.91 10-4 kg of N2O, 4.172 kg of CO2 and 9.03 10-3 kg of CH4 fossil. In the other hand, the wood growth has allowed to uptake CO2. In this study, we consider the uptake of the tree that will grow up after the timber wood extraction for the present FU. The total uptake after this tree growing will be 15kg x 0.47 x 44/12= 25.9 kg. If we consider the forestry with a cohort model [Reed 1980; Masera 2003], we can consider a linear uptakes kinetics. An average age of 20 years growing will be assumed for this kind of wood. That is to say that the annual uptake will be of 1.3 kg of CO2/FU/year.
Water, Sand, transformation and transports in the workplace impacts were also taken into account in this study.
4.4 GHG Impacts for Year 2
The impacts in terms of GWP during year 2 are 10kgCO2eq/FU for the renders alone, 71-82kgCO2eq/FU for sprayed LHC+renders, 73-83kgCO2eq/FU for cast LHC+renders and 162-209kgCO2eq/FU for brick laying LHC+renders. The entirety of materials impacts (core + renders), from transformation to setting in the workplace, including the renders, are taken into account. The renders impacts are renewed after 35 years.
As the hemp shiv proportion is very low in the renders, we see that it doesn’t really influence the results. During the life cycle, the impacts of others maintenance operations are neglected.
As the hemp crop is treated elsewhere, the lime fabrication is the main source of GHG emission during year 2. The weight of shipping is far to be negligible when materials are not local.
5 LIFE END
Two scenarios are proposed. We don’t have enough background on these products to really know their life end. With today practices, the more probable is that they will be stored in a landfill site (Scenario 1). A best practice could be to grind and use them as soil enrichment product (Scenario 2)
6 RESULTS AND CONCLUSION
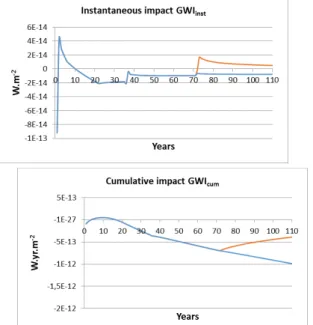
Instantaneous and cumulative GHG impacts were computed thanks to the spreadsheet developed by the CIRAIG [CIRAIG 2016]. Figs. 6 and 7 provide two examples of results for the GHG dynamic assessment: Spraying with the best cultivation practices and the use of local materials, and Blocks, with the worst crop practices in term of GHG emissions, and the maximum of transports. As we can see, in the first case, the instantaneous impact, correlated with capture/ emissions and dissolution of GHG with time in the atmosphere, the see and the earth, is negative the first year thanks to the hemp crop, but highly positive the second year, due to transport, lime processing and building. This year time lag between capture and emissions will create a positive cumulative impact during the first 15 years. Furthermore, the life end scenario is important, too. For the recycling as soil amendment, the instantaneous impact become positive for a moment and the benefits due the use of bio-are seriously decreased. In the case of blocks, the
capture of CO2 is so high during the first year that the benefits of this capture are effective during 70 years, even with the worst conditions of crop and transports. To conclude: 1/ The shipping distance is clearly a key parameter in term of GHG impacts of Shiv, due to the low density of this material. 2/ As ever seen in other publications, the fertilizers represent at least the third of GWP impact of Shiv crop. It means that to work with biological and local (<50km) products would greatly decrease the impact of shiv. This point must be considered when we choose a bio-based building material: firstly, we must have the knowledge of the local products and of their supply chain. 3/ To work on a dynamic point of view rather than a simple calculation of GHG emissions versus storage leads us to reconsider the assessment of such bio-based building materials.
Figure 6: dynamic GHG assessment in the case of spraying, with a minimum impact of crop and
transports.
Figure 7: dynamic GHG assessment in the case of compacted blocks, maximum impact of crop and
transports.
7 REFERENCES
Agdex 740/825, Machinerie, coûts d’utilisation et taux à forfait suggérés, CRAAQ, Références économiques, Mars 2012
Andrianandraina, Ventura A, Senga Kiesse T, Cazacliu B, Idir R, van der Werf HMG, Sensitivity Analysis of Environmental Process Modeling in a Life Cycle Context, A Case Study of Hemp Crop Production, Journal of industrial technology, 2015:1-15
Berge B, Chapter 6: minerals, in Berge B, Butters C, Henley T, The ecology of Building Materials, second edition, Taylor and Francis, 2009
Borken-Kleefeld J., Default transport data per commodity group for the US and EU27-Methodology and notes on data for ecoinvent, Ecoinvent v3, 2012 Boutin MP, Flamin C, Quinton S, Gosse G, Etude des caractéristiques environnementales du chanvre par leur analyse de cycle de vie, Rapport du Ministère de l’agriculture et de la pêche, September 2006.
Cetiom, Le Chanvre industriel, guide de culture, 2015 ;
www.terrinnovia.fr
Chabannes M, Garcia-Diaz E, Clerc L, Benezet J-C, Studying the hardening and mechanical performances of rice husk and hemp based building materials cured under natural and accelerated carbonation, construction and building materials 2015
CIRAIG 2016: Dynamic LCA calculator DYNCO2,
Version 2.0 (2016) :
http://www.ciraig.org/en/dynco2.php
DEFRA, 2008. Act on CO2 Calculator: Data, Methodology and Assumptions Paper
V1.2. August 2008, 2008 Website:. Department for Environment, Food and
Rural Affairs (DEFRA). Date accessed: 11/12/2014. www.defra.gov.uk
Dowling A, O’Dwyer J, Adley CC, Lime in the limelight, Journal of cleaner production 2015
Fargione J, Hill J, Tilman D, Polasky S, Hawthorne P, Land Clearing and the biofuel carbon debt, Science, 2008
Habert G, Billard C, Rossi P, Chen C, Roussel N, Cement production technology improvement compared to factor 4 objectives, Cement and concrete Research 2010
Ip K, Miller A, Life cycle greenhouse gas emissions of hemp-lime wall construction in UK, Resources, conservation and recycling 2012;60:1-9
IPCC Climate Change: The Intergovernmental Panel on Climate Change Scientific Assessment (eds Houghton, J. T., Jenkins, G. J. & Ephraums, J. J.) (Cambridge Univ. Press, 1990)
Kikuchi T, Kuroda Y, Carbon diokide uptake in demolished and crushed concrete, journal of advanced concrete technology 2011
Lawrence RMH, Mays TJ, Walker P, D’Alaya D, Determination of carbonation profiles in non-hydraulic lime mortars using thermogravimetric analysis, Thermochemica acta 2006
Levasseur A, Brandao M, Lesage P, Margni Manuele, Pennington D, Clift R, Samson R, Valuing temporary carbon storage, Nature climate change (2012)
Levasseur A, Lesage P, Margni M, Samson R, Biogenic carbon and temporary storage addressed
with dynamic life cylcle assessment, Journal of industrial ecology (2012)
Licht, S., Wu, H., Hettige, C., Wang, B., Asercion, J., Lau, J., Stuart, J., 2012. STEP cement: solar thermal electrochemical production of CaO without CO2 emission. Chem. Commun. 48, 6019e6021.
Masera, O.R., Garza-Caligaris, J., Kanninen, M., Karjalainen, T., Liski, J., Nabuurs, G.J., Pussinen, A., de Jong, B.H.J., Mohren, G.M.J., 2003. Modelling carbon sequestration in afforestation, agroforestry and forest management projects: the CO2FIX V.2 approach. Ecol. Model. 164, 177–199.
Meirhaege C, Evaluation de la disponibilité et de l’accéssibilité de fibres végétales à usage matériaux en France (assessment of natural fibres availability and accessibility for material uses in France, ADEME, 2011 Morandeau A, Thiery M, Dangla P, Investigation of the carbonation mechanism of CH and C-S-H in terms of kinetics, microstructure changes and moisture
properties, Cement and Concrete research
2014;56:153-170
Ochoa George P A, Sagatume Guttierez A, Cogollos Martinez J B, Vandecasteele C, Cleaner production in a small lime factory by means of process control, Journal of Cleaner Production, 2010
Pade C, Guimaraes M, The CO2 uptake of concrete in a 100 year perspective, cement and concrete research 2007
Prétot S, Collet F, Garnier C, Life cycle assessment of a hemp concrete wall: Impact of thickness and coating, Building and Environment 72 (2014) 223-231
Reed, K.L., 1980. An ecological approach to modeling the growth of forest trees. For. Sci. 26, 33–50
Sagastume Gutierrez AS, Van Caneghem J, Cogollos Martinez JB, Vandecasteele C, evaluation of the environmental performance of lime production in Cuba, Journal of Cleaner Production 2012
Searchinger T, Heimlich R, Houghton R A, Dong F, Elobeid A, Fabiosa J, Tokgoz S, Hayes D, Yu T-H, Use of U.S. Croplands for Biofuels Increases Greenhouse Gases Through emissions from land-use change, Science, 2008
Shan Y, Liu Z, Guan D, CO2 emissions from China’s lime industry, Applied Energy 2016
Thiery M, Dangla P, Belin P, Habert G, Roussel N, Carbonation kinetics of a bed of recycled concrete aggregates : A laboratory study on model materials, cement and concrete research 2013
P.Tronet, T.Lecompte, V.Picandet, C.Baley Study of lime hemp composite precasting by compaction of fresh mix – An instrumented die to measure friction and stress state, Powder Technology (2014)
P Tronet, T Lecompte, V Picandet, C Baley, Study of lime hemp concrete (LHC)–Mix design, casting process and mechanical behaviour, Cement and Concrete Composites (2016)
Turunen L, van der Werf H, Life cycle analysis of hemp textile yarn, comparison of three hemp fibre processing scenarios and a flax scenario, Report of the
HEMP-SYS European Union Project, May 2006 ;
www6.rennes.inra.fr/.../1/.../HEMPLCA_310506.pdf
Van der Werf, H. M. G. 2004. Life Cycle Analysis of Field Production of Fibre Hemp, the Effect of Production Practices on Environmental Impacts.
Euphytica 140 (1-2) : 13-23.
Van Balen K, Carbonation reaction of lime, kinetics at ambient temperatures, Cement and concrete research 2005
Van Balen K, Van Gemert D, Modelling mortar carbonation, Materials and Structures, 1994
Ventola, L., Vendrell, M., Giraldez, P., Merino, L., 2011. Traditional organic additives improve lime mortars: new old materials for restoration and building natural stone fabrics. Constr. Build. Mater
![Table 5. Transport works per kg according to EcoInvent for different markets [Borken-Kleefeld 2012]](https://thumb-eu.123doks.com/thumbv2/123doknet/14750232.579742/4.892.100.438.374.730/table-transport-according-ecoinvent-different-markets-borken-kleefeld.webp)
![Table 6: Chemical composition of the raw materials for hydraulic lime [Kellenberger 2007]](https://thumb-eu.123doks.com/thumbv2/123doknet/14750232.579742/5.892.99.429.793.913/table-chemical-composition-raw-materials-hydraulic-lime-kellenberger.webp)