HAL Id: hal-00297463
https://hal.archives-ouvertes.fr/hal-00297463
Submitted on 27 May 2008
HAL is a multi-disciplinary open access
archive for the deposit and dissemination of
sci-entific research documents, whether they are
pub-lished or not. The documents may come from
teaching and research institutions in France or
abroad, or from public or private research centers.
L’archive ouverte pluridisciplinaire HAL, est
destinée au dépôt et à la diffusion de documents
scientifiques de niveau recherche, publiés ou non,
émanant des établissements d’enseignement et de
recherche français ou étrangers, des laboratoires
publics ou privés.
High resolution modelling results of the wind flow over
Canary Islands during the meteorological situation of
the extratropical storm Delta (28?30 November 2005)
O. Jorba, C. Marrero, E. Cuevas, J. M. Baldasano
To cite this version:
O. Jorba, C. Marrero, E. Cuevas, J. M. Baldasano. High resolution modelling results of the wind
flow over Canary Islands during the meteorological situation of the extratropical storm Delta (28?30
November 2005). Advances in Science and Research, Copernicus Publications, 2008, 2, pp.81-87.
�hal-00297463�
Adv. Sci. Res., 2, 81–87, 2008 www.adv-sci-res.net/2/81/2008/
©Author(s) 2008. This work is distributed under the Creative Commons Attribution 3.0 License.
Advances in
Science and
Research
EMS
Annual
Meeting
and
8th
Eur
opean
Confer
ence
on
Applications
of
Meteor
olo
gy
2007
High resolution modelling results of the wind flow over
Canary Islands during the meteorological situation of the
extratropical storm Delta (28–30 November 2005)
O. Jorba1, C. Marrero2, E. Cuevas2, and J. M. Baldasano1,3
1Earth Sciences Department, Barcelona Supercomputing Center – Centro Nacional de Supercomputaci´on
(BSC-CNS), Barcelona, Spain
2Iza˜na Atmospheric Research Center, National Institute of Meteorology, Tenerife, Spain 3Environmental Modelling Laboratory, Technical University of Catalonia (UPC), Barcelona, Spain
Received: 12 December 2007 – Revised: 2 May 2008 – Accepted: 15 May 2008 – Published: 27 May 2008 Abstract. On 28–29 November 2005 an extratropical storm affected the Canary Islands causing significant damage related to high average wind speeds and intense gusts over some islands of the archipelago. Delta was the twenty-sixth tropical or subtropical storm of the 2005 Atlantic hurricane season. It represents an unusual meteorological phenomenon for that region, and its impacts were underestimated by the different operational meteorological forecasts during the previous days of the arrival of the low near Canary Islands.
The aim of this study is to reproduce the local effects of the flow that were observed over the Canary Islands during the travel of the Delta storm near the region using high-resolution mesoscale meteorological simula-tions. The Advanced Research Weather Research & Forecasting Model (WRF-ARW) is applied at 9, 3 and 1 km horizontal resolution using ECMWF forecasts as initial and boundary conditions. The high-resolution simulation will outline the main features that contributed to the high wind speeds observed in the archipelago. Variations in vertical static stability, vertical windshear and the intense synoptic winds of the southwestern part of Delta with a warm core at 850 hPa were the main characteristics that contributed to the development and amplification of intense gravity waves while the large-scale flow interacted with the complex topography of the islands.
1 Introduction
The Canary Islands were affected by the extratropical storm Delta (NHC, 2006) on 28–29 November 2005 causing signif-icant damage related to high average wind speeds and intense gusts. Delta moved erratically from its development for a few days before experiencing an extratropical transition while it moved east-northeasterly towards the Canary Islands, af-fecting the archipelago as an extratopical low (Beven, 2006; Mart´ın et al., 2006).
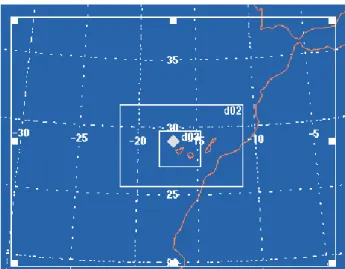
The Canary Islands are located in the middle-east of the Atlantic Ocean in front of the southern coast of Morocco, between 27–30◦
N latitude and 19–13◦
W longitude (see Fig. 1). The complex topography of Canary Islands and the interaction with the large-scale flow associated with Delta
Correspondence to: O. Jorba
contributed to the development of the extreme winds ob-served. The highest wind speeds were recorded in meteoro-logical stations located downwind of steep mountain barriers of western islands, this fact indicates that the strong winds might be related to downslope windstorms (e.g., Lilly and Zipser, 1972; Peltier and Clark, 1979; Durran, 1986) induced by the intense synoptic flow affecting the archipelago. This paper analyzes the development of strong downslope winds that were observed in the Canary Islands during the influence of Delta storm from 28 to 30 November using high-resolution mesoscale meteorological modelling.
2 Methods
The Weather Research and Forecasting (WRF) Model v2.1.2 (Michalakes et al., 2005) was used to simulate the wind field over the Canary Islands under the Delta meteorological situ-ation. WRF was configured with the ARW dynamics solver
82 O. Jorba et al.: High resolution modelling results of the wind flow over Canary Islands
Figure 1.Location of Canary Islands. Definition of the 3 nested m
Figure 1. Location of Canary Islands. Definition of the 3 nested
model domains.
(Skamarock et al., 2005) to integrate the primitive equations. The physical parameterizations used were: single-moment 3-class scheme for the microphysics processes, Kain-Fritsch scheme for cumulus parameterization, the Rapid Update Cy-cle model Land-Surface scheme with 6 sub-soil layers was used (Smirnova et al., 1997, 2000), the Yonsei University PBL scheme (Noh et al., 2003), long-wave radiative pro-cesses are parameterized with the Rapid Radiative Transfer Model following Mlawer et al. (1997) and the short-wave ra-diative scheme based on Dudhia (1989).
Three domains were defined using two-way nesting tech-nique interaction. The domains were centered over the Ca-nary Islands with 300×230, 340×226, 337×292 grid points for the outer to inner domains respectively. The location of the meshes is shown in Fig. 1. The horizontal resolutions were 9, 3, 1 km with 40 sigma vertical levels, 11 characteriz-ing the boundary layer. The model top was fixed at 50 hPa. Analysis of the European Center for Medium-range Weather Forecasts (ECMWF) at 00:00 UTC 28 November was used as initial condition. The boundary conditions were provided by the ECMWF forecasts at 3 h intervals from 03:00 UTC 28 November to 00:00 UTC 30 November. The ECMWF data used have high spatial resolution (around 25 km) derived from the T799 model forecasts.
3 Results
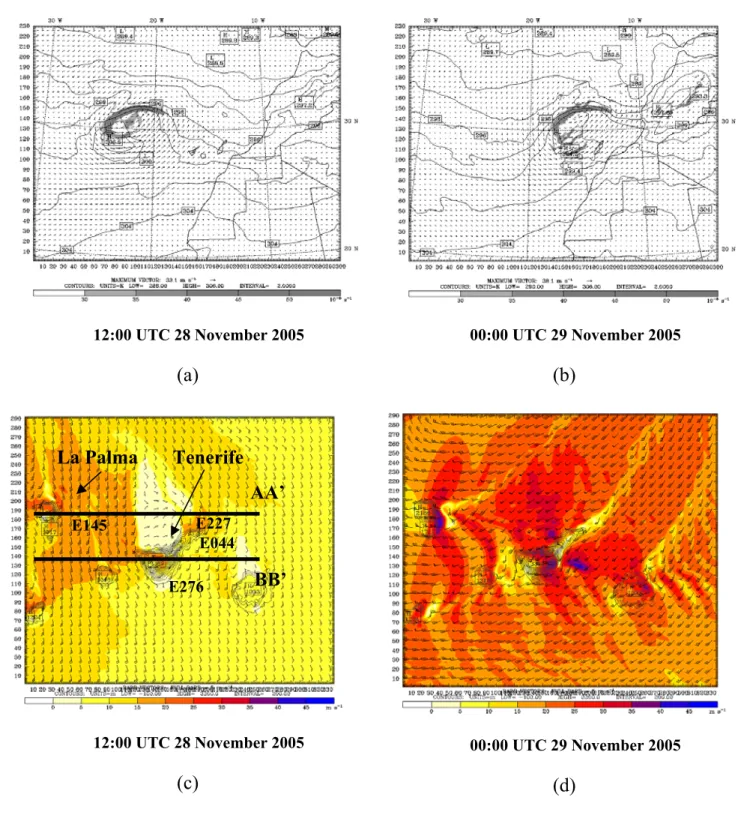
The numerical results for 28 November (Fig. 2a, b) show a mature cyclone with a warm front extending from the cen-ter of the low northwestward following the cyclone shape as shown by absolute vorticity. The structure of the extratropi-cal storm reaching Canary Islands was analog with the third phase of the Shapiro-Keyser conceptual model (Shapiro and Keyser, 1990) for cyclone evolution, with a frontal T-bone
and back warm front (Mart´ın et al., 2006). The bent-back front encloses a pool of warmer air at 850 hPa, and con-tributes to a reinforcing of the winds in the southwest region of the cyclone.
Figure 2c, d shows the results of the model at 1 km res-olution. The surface wind speeds before 12:00 UTC of 28 November remain below 14 m/s over the whole Canary Is-lands with well defined wake areas. The wind speed starts to reinforce at 12:00 UTC 28 November, while the Delta storm approaches the Canary archipelago with a counterclockwise veering of the synoptic flow to southwestern direction. The northwestern region of the domain presents the most intense flows, where the maximum wind speed is produced on the lee-side of La Palma, reaching speeds of 20 m/s. The de-velopment of trapped-lee waves starts at 14:00 UTC in the lee-side of La Palma. The vertical structure of the flow is reflected at surface level with regularly spaced regions of in-tense wind speeds above 20 m/s. The synoptic veering of the flow towards southwesterly directions coincides with the in-tensification of the flow. The intense westerly warm core of the Delta storm affects the Canary Islands from 20:00 UTC 28 November to 02:00 UTC 29 November. This period is characterized by the development of local strong winds lee-ward of La Palma and Tenerife islands. The maximum surface wind speed is reached at 23:00 UTC 28 November over the leeside of La Palma, with an intensity of 40 m/s at 10 m a.g.l. Also, in the southeast coast of Tenerife an intense core flow of high wind speeds develops, impacting over the sea and part of the coast at 38 m/s at 10 m a.g.l.
A vertical cross section is performed in order to under-stand the physical mechanisms that lead to the intense wind flows observed and modelled at surface levels for La Palma and Tenerife Islands (Fig. 3). At 12:00 UTC the main flow affecting Tenerife presents a marked westerly direction and important vertical wind shear, and an elevated inversion is present around 780 hPa which delimits two different stati-cally stable layers (see Fig. 4). Under these conditions an in-ternal gravity wave develops aloft Tenerife Island as is shown in the cross section. The wind speed at the lee of the moun-tain intensifies and the downslope flow enhances. The max-imum velocities of the downslope jet flow are of the order of 36 m/s at 100 m a.g.l. The surface wind speed remains lower than 32 m/s. At 24:00 UTC the windstorm has ex-tended downslope and its jet core presents a maximum wind speed of 45 m/s at 100 m a.g.l. Figure 4 shows the la Palma and Tenerife upwind sounding computed from the model re-sults at 9-km and 1-km. It is important to notice that although the 1-km results clearly depicts the aloft inversion, the model is able to develop the inversion at 9-km with different qual-ity. This is an important indicator to forecast such extreme events if high-resolution model information is not available.
Figure 3 shows the cross section along La Palma and Tenerife islands at different horizontal resolutions (9, 3 and 1-km). The cross section along La Palma shows how the trapped-lee waves do not develop in the simulation of 9-km.
12:00 UTC 28 November 2005
(a)
00:00 UTC 29 November 2005
(b)
12:00 UTC 28 November 2005
(c)
00:00 UTC 29 November 2005
(d)
Figure 2. (a,b) Simulated 850-hPa potential temperature (contour plots: K), winds (vector
AA’
BB’
La Palma
Tenerife
E145
E276
E044
E227
Figure 2. (a, b) Simulated 850-hPa potential temperature (contour plots: K), winds (vector plots), and absolute vorticity (shaded plots:
10−5s−1) for 28–29 November 2005 from 9-km domain. (c, d) 10-m wind field from 1-km domain (Color map: wind speed (m/s); vector
map: 10-m wind field). In the bottom-left panel are depicted the cross sections of Fig. 3 AA’ and BB’, and the location of stations of Fig. 5.
However, the results at 3 and 1-km present good performance in developing the trapped-lee waves. As was noted by Durran (1986) the trapped-lee waves are eliminated by the hydro-static approximation, and these fine-scale features will not
be captured with hydrostatic models. The results at 9 km point out the impact of the orography representation in the non-hydrostatic model used. The increase of the horizontal resolution provides a better representation of the orography
84 O. Jorba et al.: High resolution modelling results of the wind flow over Canary Islands
Figure 3. Vertical cross section of potential temperature and wind field at La Palma (top) at 18:00 UTC 28 November 2005 and Tenerife
(bottom) at 00:00 UTC 29 November 2005 at 9 km resolution (left), 3 km resolution (middle), and 1 km resolution (right). The location of the cross section is depicted in bottom-left panel of Fig. 2, La Palma cross section AA’, and Tenerife cross section BB’ (Color map: wind speed (m/s); vector map: wind field; contour map: potential temperature (K)).
that leads to the development of the fine-scale features. Also, the increasing of the horizontal resolution brings high winds to the bottom of the mountain, in agreement with Durran (1986) who attributes this behavior to the finite amplitude effects (increase of mountain height), and more in agreement with the often observed strongest winds near the base of a mountain. In summary, if the horizontal resolution is de-creased, the mountain wave activity lessens, even though the mountain-top winds present no major differences. As noted by other authors (e.g., Doyle and Shapiro, 2000; Zhang et al., 2005) the horizontal resolution of the mesoscale models need to be higher than 10–9 km to develop the details of the wave. In La Palma cross section, is also noticeable the effect of Tenerife Island in the flow, provoking a plume of low wind speed at low levels downwind of la Palma.
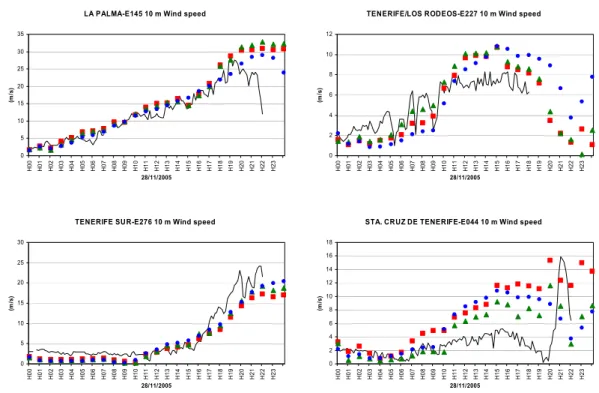
Finally, the 10 m hourly wind speeds modeled were com-pared against meteorological observations available in the area (Fig. 5). Due to power loss of the automatic meteo-rological stations related to the damage of the energy supply provoked by the intense Delta wind field, the meteorological stations stopped measuring after 22:00 UTC of 28 November and no information is available after then. The model results show a good agreement with the observations in the places
where the major wind speeds were registered. The stations of La Palma-E145 and Tenerife Sur-E276 reached maximum wind speeds of 25–30 m/s at 10 m a.g.l. that are accurately reproduced by the model results. The model results show a regular increase of the wind speed at 10 m from 5 m/s to 30 m/s in La Palma-E145 station for the period of study. The Sta. Cruz de Tenerife-E044 station shows a sudden increase in the wind field suggesting the presence of mountain wave activity aloft that impacts at surface levels with the develop-ment of a downslope wind event (as has been shown with the model results). The results show how in the Sta.Cruz de Tenerife-E044 station the high-resolution simulations (3 and 1 km) reproduce the sudden increase in wind speed reason-ably well improving the 9 km simulation.
4 Conclusions
An unusual synoptic situation affected the Canary Islands from 28 November to 30 November 2005. The high-resolution simulation has outlined the main features that con-tribute to the high wind speeds observed in the archipelago of Canary Islands. The presence of the warm core of Delta at 850 hPa, near the top of higher mountain peaks of the
(a) (b)
(c) (d)
Figure 4.Model soundings at La Palma (28.71◦
N lat, 17.96◦
W lon) (left panels) and Tenerife (28.25◦
N lat, 16.90◦
W lon) (right panels) at 12:00 UTC 28 November 2005 [Top panels plot 9-km model soundings and bottom panels 1-km model soundings].
archipelago, and the variations in vertical static stability and important vertical windshear were the main characteristics that contributed to the development and amplification of in-tense gravity waves leeward of the major mountain barriers of the western islands of the Canary archipelago that leads to the development of downslope windstorms.
The comparisons with surface observations indicate that the mesoscale model provides a reasonably good perfor-mance of the local effects produced in the complex islands orography. The model results may contribute to reinforce the idea that downslope windstorms associated with moun-tain wave activity developed when the Delta storm affected the Canary Islands. This was a result of interactions between
large-scale airflow (Delta storm) and the complex local to-pography of the islands. The development and evolution of the Delta storm was a challenge for forecasters and numerical weather prediction models (e.g., ECMWF, HIRLAM), which underestimates the speed and impacts of the storm during its evolution near the Canary Islands. In this sense, high-resolution modelling contributes to understand the physical processes that lead to strong wind speeds and gusts observed.
86 O. Jorba et al.: High resolution modelling results of the wind flow over Canary Islands
LA PALMA-E145 10 m Wind speed
0 5 10 15 20 25 30 35 H 0 0 H 0 1 H 0 2 H 0 3 H 0 4 H 0 5 H 0 6 H 0 7 H 0 8 H 0 9 H 1 0 H 1 1 H 1 2 H 1 3 H 1 4 H 1 5 H 1 6 H 1 7 H 1 8 H 1 9 H 2 0 H 2 1 H 2 2 H 2 3 28/11/2005 (m /s )
TENERIFE/LOS RODEOS-E227 10 m Wind speed
0 2 4 6 8 10 12 H 0 0 H 0 1 H 0 2 H 0 3 H 0 4 H 0 5 H 0 6 H 0 7 H 0 8 H 0 9 H 1 0 H 1 1 H 1 2 H 1 3 H 1 4 H 1 5 H 1 6 H 1 7 H 1 8 H 1 9 H 2 0 H 2 1 H 2 2 H 2 3 28/11/2005 (m /s )
TENERIFE SUR-E276 10 m Wind speed
0 5 10 15 20 25 30 H 0 0 H 0 1 H 0 2 H 0 3 H 0 4 H 0 5 H 0 6 H 0 7 H 0 8 H 0 9 H 1 0 H 1 1 H 1 2 H 1 3 H 1 4 H 1 5 H 1 6 H 1 7 H 1 8 H 1 9 H 2 0 H 2 1 H 2 2 H 2 3 28/11/2005 (m /s )
STA. CRUZ DE TENERIFE-E044 10 m Wind speed
0 2 4 6 8 10 12 14 16 18 H 0 0 H 0 1 H 0 2 H 0 3 H 0 4 H 0 5 H 0 6 H 0 7 H 0 8 H 0 9 H 1 0 H 1 1 H 1 2 H 1 3 H 1 4 H 1 5 H 1 6 H 1 7 H 1 8 H 1 9 H 2 0 H 2 1 H 2 2 H 2 3 28/11/2005 (m /s )
Figure 5. 10 m wind speed comparison of model results versus meteorological observations. Location of surface stations is depicted in
bottom-left panel of Fig. 2 (Black line: 15 min mean surface measurements; blue circle: 9-km domain; green triangle: 3-km domain; red square: 1-km domain).
Acknowledgements. The authors wish to thank two anonymous
reviewers for their valuable comments, the National Institute of Meteorology of Spain and the ECMWF for the IFS-ECMWF data and the surface meteorological observations. Simulation was performed with the MareNostrum Supercomputer held by the Barcelona Supercomputing Center-Centro Nacional de Super-computaci´on. This work was funded by the projects CALIOPE 441/2006/3-12.1 of the Spanish Ministry of the Environment, CICYT CGL2006-08903 and CICYT CGL2006-11879 of the Spanish Ministry of Education and Science.
Edited by: F. Stel and D. B. Giaiotti Reviewed by: two anonymous referees
References
Beven, J.: Tropical Cyclone Report on Tropical Strom Delta 22–28 November 2005, NOAA Tech. Note TCR-AL292005, Tropical Prediction Center, National Hurricane Center, 2006.
Doyle, J. D. and Shapiro, M. A.: A multi-scale simulation of an extreme downslope windstorm over complex topography, Mete-orol. Atmos. Phys., 74, 83–101, 2000.
Dudhia, J.: Numerical study of convection observed during the winter monsoon experiment using a mesoscale two-dimensional model, J. Atmos. Sci., 46, 3077–3107, 1986.
Durran, D. R.: Another look at downslope windstorms. Part I: On the development of supercritical flow in an infinitely deep, con-tinuously stratified fluid, J. Atmos. Sci., 43, 2527–2543, 1986.
Lilly, D. K. and Zipser, J.: The front range windstorm of 11 Jan-uary 1972 – a meteorological narrative, Weatherwise, 25, 56–63, 1972.
Mart´ın, F., Alejo, C. J., de Bustos, J. J., Calvo, F. J., San Ambrosio, I., S´anchez-Laulh´e, J. M., and Santos, D.: Study of the tropi-cal storm “Delta” and its extratropitropi-cal transition: Meteorologitropi-cal impacts over Canary Islands (27–29 November 2005), Technical Report, Instituto Nacional de Meteorolog´ıa, Madrid, 2006. Estudio de la tormenta tropical “Delta” y su transici´on extratropical:
Efectos meteorol´ogicos en Canarias (27 a 29 de noviembre de 2005), 2005.
Michalakes, J., Dudhia, J., Gill, D., Henderson, T., Klemp, J., Ska-marock, W., and Wang, W.: The Weather Research and Forecast-ing Model: Software architecture and performance, ProceedForecast-ings of the Eleventh ECMWF Workshop on the Use of High Perfor-mance Computing in Meteorology, edited by: Zwiefhofer, W. and Mozdzynski, G., World Scientific, 156–168, 2005.
Mlawer, E. J., Taubman, S. J., Brown, P. D., Iacono, M. J., and Clough, S. A.: Radiative transfer for inhomogeneous atmo-sphere: RRTM, a validated correlated-k model for the longwave, J. Geophys. Res., 102(D14), 16 663–16 682, 1997.
National Hurricane Center: 2005 Atlantic Hurricane Season avail-able at: http://www.nhc.noaa.gov/2005atlan.shtml, 2006. Noh, Y., Cheon, W. G., Hong, S. Y., and Raasch, S.:
Improve-ment of the K-profile Model for the Planetary Boundary Layer based on Large Eddy Simulation Data, Bound.-Lay. Meteorol., 107, 401–427, 2003.
Peltier, W. R. and Clark, T. L.: The evolution and stability of finite-amplitude mountain waves. Part II: Surface wave drag and severe
downslope winds, J. Atmos. Sci., 36, 1498–1529, 1979. Shapiro, M. A. and Keyser, D.: Fronts, jet streams and the
tropopause, in: Extratropical Cyclones, The Erik Palm´en Memo-rial Volume, edited by: Newton, C. W. and Holopainen, E. O., American Meteorology Society, 167–191, 1990.
Skamarock, W. C., Klemp, J. B., Dudhia, J., Gill, D. O., Barker, D. M., Wang, W., and Powers, J. G.: A Description of the Advanced Research WRF Version 2, NCAR Technical note NCAR/TN-468+STR, 2005.
Smirnova, T. G., Brown, J. M., and Benjamin, S. G.: Performance of different soil model configurations in simulating ground sur-face temperature and sursur-face fluxes, Mon. Weather Rev., 125, 1870–1884, 1997.
Smirnova, T. G., Brown, J. M., Benjamin, S. G., and Kim, D.: Parameterization of coldseason processes in the MAPS land-surface scheme, J. Geophys. Res., 105(D3), 4077–4086, 2000. Zhang, Y., Chen, Y. L., and Kodama, K.: Validation of the Coupled
NCEP Mesoscale Spectral Model and an Advanced Land Surface Model over the Hawaiian Islands. Part II: A High Wind Event, Weather Forecast., 20, 873-895, 2005.

![Figure 4. Model soundings at La Palma (28.71 ◦ N lat, 17.96 ◦ W lon) (left panels) and Tenerife (28.25 ◦ N lat, 16.90 ◦ W lon) (right panels) at 12:00 UTC 28 November 2005 [Top panels plot 9-km model soundings and bottom panels 1-km model soundings].](https://thumb-eu.123doks.com/thumbv2/123doknet/14772439.591964/6.905.103.801.108.752/figure-model-soundings-palma-tenerife-november-soundings-soundings.webp)