HAL Id: hal-01781701
https://hal.archives-ouvertes.fr/hal-01781701
Submitted on 9 Feb 2021
HAL is a multi-disciplinary open access
archive for the deposit and dissemination of
sci-entific research documents, whether they are
pub-lished or not. The documents may come from
teaching and research institutions in France or
abroad, or from public or private research centers.
L’archive ouverte pluridisciplinaire HAL, est
destinée au dépôt et à la diffusion de documents
scientifiques de niveau recherche, publiés ou non,
émanant des établissements d’enseignement et de
recherche français ou étrangers, des laboratoires
publics ou privés.
physiological buffer
Fanny Girard, Mathieu Peret, Natacha Dumont, Sylvie Blanc, Vasilica
Badets, Kristaq Gazeli, Cédric Noël, Thierry Belmonte, Laurent Marlin,
Jean-Pierre Cambus, et al.
To cite this version:
Fanny Girard, Mathieu Peret, Natacha Dumont, Sylvie Blanc, Vasilica Badets, et al.. Correlations
between gaseous and liquid phase chemistries induced by cold atmospheric plasmas in a physiological
buffer. Physical Chemistry Chemical Physics, Royal Society of Chemistry, 2018, 20 (14), pp.9198
-9210. �10.1039/C8CP00264A�. �hal-01781701�
PCCP
ARTICLE
Received 00th January 20xx, Accepted 00th January 20xx DOI: 10.1039/x0xx00000x www.rsc.org/Correlations between gaseous and liquid phase chemistries
induced by cold atmospheric plasmas in a physiological buffer
Fanny Girard,a,b Mathieu Peret, a Natacha Dumont,a Vasilica Badets,b Sylvie Blanc,a Kristaq Gazeli,a Cédric Noël,c Thierry Belmonte,c Laurent Marlin,d Jean-Pierre Cambus,e Guillaume Simon,a Neso Sojic,b Bernard Held,f Stéphane Arbault,b† and Franck Clémenta†
The understanding of plasma-liquid interactions is of major importance, not only in physical chemistry, chemical engineering and polymer science, but in biomedicine as well as to better control the biological processes induced on/in biological samples by Cold Atmospheric Plasmas (CAPs). Moreover, plasma-air interactions have to be particularly considered since these CAPs propagate in the ambient air. Herein, we developed a helium-based CAP setup equipped with a shielding-gas device, which allows the control of plasma-air interactions. Thanks to this device, we obtained specific diffuse CAPs, with the ability to propagate along several centimetres in the ambient air at atmospheric pressure. Optical Emission Spectroscopy (OES) measurements were performed on these CAPs during their interaction with a liquid medium (Phosphate-Buffered Saline PBS 10 mM, pH 7.4) giving valuable information about the induced chemistry as a function of the shielding gas composition (variable O2/(O2+N2) ratio). Several excited species were detected including N2+(First
Negative System, FNS), N2(Second Positive System, SPS) and HO• radical. The ratios between nitrogen/oxygen excited
species strongly depend on the O2/(O2+N2) ratio. The liquid chemistry developed after CAP treatment was investigated by
combining electrochemical and UV-visible absorption spectroscopy methods. We detected and quantified stable oxygen and nitrogen species (H2O2, NO2-, NO3-) along with Reactive Nitrogen Species (RNS) such as the peroxynitrite anion ONOO-.
It appears that the RNS/ROS (Reactive Oxygen Species) ratio in the treated liquid depends also on the shielding gas composition. Eventually, the composition of the surrounding environment of CAPs seems to be crucial for the induced plasma chemistry and consequently, for the liquid chemistry. All these results demonstrate clearly that for physical, chemical and biomedical applications, which are usually achieved in ambient air environments, it is necessary to realize an effective control of plasma-air interactions.
INTRODUCTION
Plasma-liquid interactions have gained particular attention, not only in physical chemistry, chemical engineering and polymer science, but also in biological and medical applications 1–7. In the latter case there is a strong need to understand and explain how Cold Atmospheric Plasmas (CAPs) interact with biological samples 8–14. Usually, CAPs consist of streamer-like guided ionization waves, which are produced at atmospheric pressure and room temperature by means of Dielectric Barrier Discharge (DBD) reactors 15. The latter are driven with sinusoidal 16,18 or pulsed high voltages 18–21 and the generated CAPs interact with the gaseous medium (usually helium or argon), which confines their electromagnetic propagation.
Depending on the experimental conditions chosen, the ionization degree of these partially-ionized gases is found to be in the order of (10-6-10-8) 21–23. The produced electromagnetic forces allow the formation of an important chemical reactivity in the gaseous phase and they lead to excitation, dissociation, recombination and other elementary atomic and molecular processes.
Since most of the applications of CAPs are performed in an open-air environment, copious Reactive Oxygen and Nitrogen Species (RONS) 8,9 are, thus, produced. It has to be noticed that this situation changes critically if the ambient atmosphere conditions (gas type and composition, humidity, temperature, pressure) change during
plasma exposures. Consequently, plasma-air
interactions have to be carefully scrutinized: species coming from the ambient air (i.e. mainly N2/O2, but
also H2O, CO2, …) may interact strongly with the
ionization waves modifying, thus, their chemical composition 24–26. Moreover, it is known that during the treatment of liquid samples with CAPs, evaporation phenomenon occurs 27–29. Accordingly, water vapour may be introduced in the plasmas, inducing for instance, an increase in HO• radical
concentration during the treatment 30.
Consequently, RONS are hypothesized to be produced mainly in the gaseous plasma phase 31,32. Additionally, depending on the experimental conditions used, different chemistries can be induced in the liquid medium following complex
mechanisms. For biological or biomedical
applications, samples are commonly found in liquid form. Plasma-induced chemistry in liquids is known to play a major role in the observed biological effects through the action of manifold RONS 5,28,33–35. Their production in the liquid phase can vary significantly. Consequently, it is critical to control the gaseous ambient environment of CAPs. Recently, Tresp et al 24 presented a shielding gas device with
the possibility of adding different percentages of O2/N2. This device allowed the effective control of
the gaseous plasma environment and its chemistry. Thus, the importance of such control process was demonstrated by analysing biological responses and RONS generation induced by CAPs 24,36,37. Elsewhere, Liu et al. used the same type of process to control the production of RONS and induce myeloma cell apoptosis 6, while Ito et al., showed that H2O2 and
NO2- concentration in the solution can be tuned by a
shielding gas device operating in open air 38.
In the present study, both chemistries in the plasma and liquid phases were investigated concomitantly. This was achieved by adding to the initial setup reported recently by our group (for details see Girard et al., 2016 27) a shielding gas composed of various amounts of O2/N2, which allowed the control
of plasma-air interactions and the better understanding of the complex interplay between ionization waves and liquids. Optical Emission Spectroscopy (OES) measurements were then performed in the close vicinity of the liquid surface, which allowed the identification of excited species in the gas phase as a function of the shielding gas composition. Then, we focused on the detection and quantification of RONS generated in a physiological buffer (Phosphate Buffered Saline PBS, 10 mM, pH 7.4) including H2O2, NO2-, NO3- and the highly
reactive peroxynitrite ONOO-. To achieve this, we combined UV-visible absorption spectroscopy and electrochemistry as complementary methods. Other physico-chemical parameters such as pH and evaporation process were also investigated. Particular attention was paid for the analysis of the involved chemical mechanisms. Hypotheses and experimental proofs related to the presence of short-lived RONS are suggested and correlations between gaseous and liquid chemistries are thus highlighted.
MATERIAL AND METHODS
EXPERIMENTAL SETUP TO GENERATE CAPS
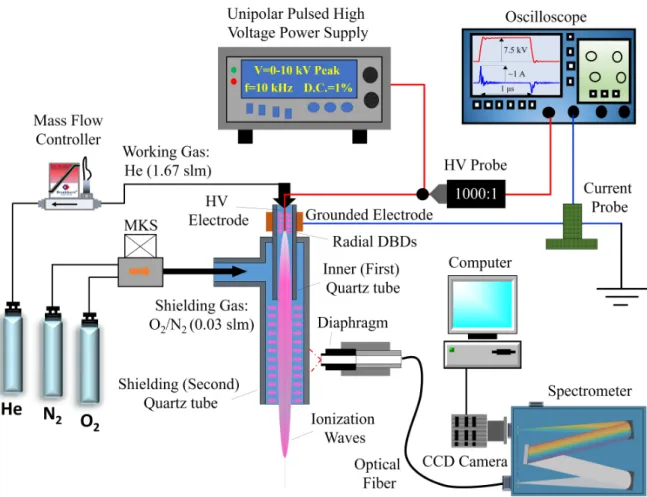
Figure 1 depicts a schematic representation of the experimental setup used herein. A tungsten filament (100 µm in diameter) is connected to the high voltage source and it is inserted within a first thin quartz tube (inner and outer diameters of 1.14 and 2.5 mm, respectively). This first tube is fed with high purity helium gas (Linde, 99.9995%) at a constant flow rate (during all the experiments) of 1.67 slm (standard litres per minute). A grounded cylindrical electrode (10mm in length) is placed around the first quartz tube, allowing the formation of wide spreading radial DBDs between the HV filament and the grounded cylindrical electrode.
Figure 1. Experimental setup used for the generation of CAPs incorporating a shielding gas device and their analysis via Optical Emission Spectroscopy (OES). Parameters of the unipolar pulsed applied voltage: amplitude 7.5 kV, frequency 10 kHz, duty cycle 1%. The flow rate is fixed at 1.67 slm for the working gas (flowing in the thin inner quartz tube), and at 0.03 slm for the shielding gas (constant whatever the composition in O2/N2 is). A detailed cross
section (not in scale) of the reactor (CAP + shielding device) is given in the center of the image.
The plasma setup employed for the experiments in this work has been described previously 27. The control of the gaseous environment around it is achieved using a (second) larger quartz tube, which is placed around the first (thinner) quartz tube (i.e., where the CAP is generated). This configuration allows the addition of a shielding gas device (see Figure 1), which can be compared with other systems reported in the literature 24,26,36–38.
The advantage of this system is related with the lower gas consumption than other setups 39,40. Technically, the present shielding gas device is based on the second quartz capillary tube (length: 90 mm, inner and outer diameters: 5.2 and 8 mm, respectively), into which mixtures of O2 and N2 can
be added upstream from the nozzle of the inner (first) quartz tube. This way, hydrodynamic interactions with the ionization waves produced in
the working helium gas are better controlled. The shielding gas was composed of 0.03 slm of various O2/N2 compositions (Linde, 99.9995%), which leads
to a total gas flow of 1.7 slm. The helium flow rate was adjusted with adequate mass flow controllers (EL-FLOW, Bronkhorst High-Tech) connected to a flow-bus. O2/N2 mixtures were always introduced
around the helium gas and they were adjusted using another mass flow controller (MKS in Figure 1). The production of ionization waves was achieved using a commercial pulsed High Voltage power supply with rise and fall times of pulses in the order of 100 ns. The electrical parameters are fixed as indicated in Figure 1 (i.e. positive pulses of 7.5 kV in amplitude, 10 kHz repetition frequency and 1% duty cycle (i.e., the ratio of the HV pulse width over the voltage period)). The ionization waves are produced due to the high imposed electric field and the geometric configurations of the extremely thin high voltage electrode and the thin dielectric quartz tube around it, which acts as a guide for the electromagnetic wave propagation.
OPTICAL EMISSION SPECTROSCOPY
Wavelength-resolved optical characterization has been conducted in order to investigate the chemical composition of the generated CAPs. The plasma
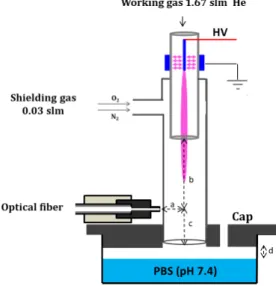
emission was recorded downstream of the shielding (second) quartz tube (spatially-integrated emission over 2 mm) with a wideband optical fibre (Ceramoptec UV 1500/1590 N) equipped with an adequate diaphragm. The diaphragm was placed perpendicularly to the tube axis at a distance a = 5 mm from it and at an axial distance b = 38 mm from the inner (first) tube nozzle. This position corresponds to an optical analysis realized 24mm above the surface of the PBS as indicated in Figure 2. Note that for technical reasons, it was not possible to reduce this length. The wavelength-integrated light was then probed by UV-NIR (200-900 nm) Optical Emission Spectroscopy (OES) by focusing it on the grating of a high-resolution spectrometer (1000M JOBIN YVON, 1200 groves.mm-1, maximum spectral efficiency at 500nm) equipped with a CCD 3000V light detector (see Figures 1 and 2). All measurements were carried out in triplicate by realizing three independent experiments. Values are calculated as mean ± Standard Deviation.
The impact of the shielding gas on the induced chemistry was evaluated by analysing the CAPs at various shielding gas compositions. In order to define direct links between excited species detected in the plasma and the reactive oxygen and nitrogen species (RONS) detected in the liquid, OES measurements were performed during the treatment of a buffered liquid (Phosphate Buffer Saline – PBS, 10 mM, pH 7.4). For that, 2 mL of PBS solutions were disposed in an adapted well plate and they were exposed to the ionisation waves. A lidding cap was placed over the well for a better control of the gaseous CAP environment and for limiting air-plasma interactions (see Figure 2). To be noted that the lidding cap allows the evacuation of the gas, thanks to a 1 mm diameter hole, which was drilled on it.
Figure 2. Experimental setup used for optical analyses of the ionisation waves during PBS treatment. 2 mL of PBS (10 mM, pH 7.4) are exposed to CAP during OES measurements. The
characteristic distances indicated in the scheme are: a = 5 mm, b = 38 mm, c = 22 mm and d = 2 mm. PLASMA TREATMENT OF PHYSIOLOGICAL SOLUTIONS AND PH MEASUREMENTS 2 mL of PBS solutions (10 mM, pH 7.4, PAN BIOTECH, KCl 0.003 mol.L-1; KH 2PO4 0.002 mol.L-1; NaCl 0.137 mol.L-1; Na
2HPO4 0.01 mol.L-1, without Mg2+/Ca2+)
were treated in a 6-well plate (FALCON, sterile tissue culture plate), for various shielding gas compositions and during 10 minutes. The distance between the exit of the second quartz tube (i.e., the one corresponding to the shielding device) and the liquid surface was fixed at d = 2 mm (see Figure 2). For peroxynitrite anion quantification, 2 mL of PBS solutions at pH 12 were treated by CAPs for each shielding gas composition and they were analysed by UV absorption spectroscopy, as described elsewhere 27.
pH measurements were carried out immediately after plasma exposure with a pH meter (Eutech instruments, pH 700 meter) under magnetic stirring, and after transferring the samples into a haemolysis tube. All measurements were carried out in
triplicate by realizing three independent
experiments. Values are calculated as mean ± Standard Deviation. It can be noticed here that pH variations were measured despite the buffering effect of PBS solutions.
UV-VISIBLE ABSORPTION SPECTROSCOPY
UV-visible absorption spectroscopy was applied to detect stable nitrogen species and RNS in the PBS exposed to CAPs. The spectra were recorded (Cary 5000 spectrophotometer) at room temperature in the [200-500 nm] range (0.5 nm steps) using either a 1 cm- or a 5 cm-path length quartz optical cell (Hellma). The cell length has been chosen adequately in order to reach a maximal absorbance of the analysed solution. Beer-Lambert law was used to calculate the concentration of detected species (Eq. 1): 𝐴!= 𝐴!,! ! = 𝜀!,!𝑙𝐶! ! (𝐸𝑞. 1)
𝐴! stands for the total absorbance of the solution at the wavelength λ, 𝐴!,! the individual absorbance of a
species i at the wavelength λ, 𝜀!,! the molar
extinction coefficient of the absorbing species i (M -1.cm-1) at the wavelength λ, l the cell length (cm) and
𝐶! the concentration of the absorbing species i (M).
The molar extinction coefficients of the species in PBS were taken from the literature 41,42 or measured
directly; standard solutions of nitrite and nitrate ions (NaNO2 2 mM and NaNO3 1 mM) were thus
prepared in PBS pH 7.4, and the absorbance of these species was calculated using the Beer-Lambert law
for each wavelength (Eq. 1). The molar extinction coefficients were measured also at pH 12 for ONOO-, HO2- and NO2- in order to quantify these species at
alkaline values. All measurements were carried out in triplicate by realizing three independent experiments. Values are calculated as mean ± Standard Deviation.
ELECTROCHEMISTRY
Electrochemistry was used as a complementary method to UV-visible absorption spectroscopy, in order to detect and quantify RONS, which are different than the previous ones. We performed cyclic voltammetry using a three-electrode electrochemical cell composed of a platinized platinum microelectrode (Ø 25 µm) as working electrode, an Ag wire covered by AgCl as reference electrode and a Pt wire as counter electrode. In order to increase the sensitivity of the working microelectrode, a potentiostatic electro-deposition of platinum black was performed by reducing at – 60 mV versus Ag/AgCl/NaCl 3M on the Pt microelectrode surface, a solution of hydrogen hexachloroplatinate in PBS at pH 7.4 (H2PtCl6, 115
mM (Sigma Aldrich®)) added with 0.76 mM of lead acetate (Sigma Aldrich®) 43. The electrodeposition was stopped when the total reduction charge reached 0,1 µC.µm-2. Indeed, Ben Amor et al., showed that this charge value offers very good analytical performances for the detection of some RONS 44. The electrochemical measurements were carried out using a potentiostat (BioLogic inc, VSP-300, EC-Lab software).
In order to detect RONS in plasma-treated solutions, cyclic voltammograms were achieved between 0 V and 0.9 V, at 20 mV.s-1 scan rate 45,46. Quantification of detected species was obtained by using adequate calibration curves extracted from pure solutions of H2O2 and NaNO2 prepared in PBS buffer (Sigma
Aldrich®).
All measurements were carried out in triplicate by realizing three independent experiments. Values are calculated as mean ± Standard Deviation.
RESULTS AND DISCUSSION
MACROSCOPIC OBSERVATIONS OF “DIFFUSE” CAPS
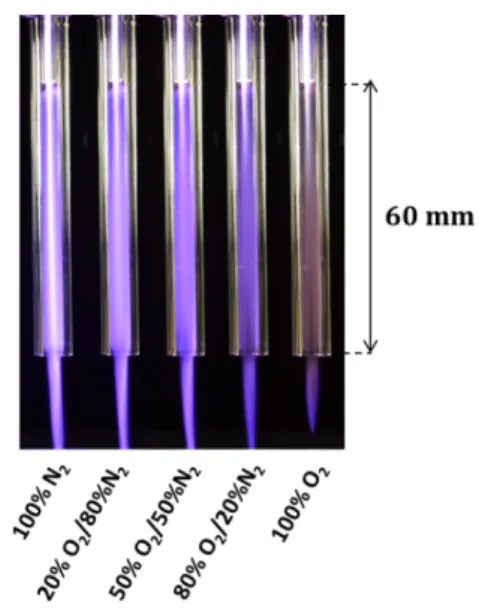
The use of the (second) shielding quartz tube provides multiple interests, i.e. for the control of the gaseous environment, for consumptions of gases at low total flow rates, but also because it induces the formation of a new type of CAPs. Indeed, with this configuration, a thin very luminous axial plasma is produced and propagates inside the shielding quartz tube, which can be viewed in Figure 3. Additionally, fainter luminous plasmas were observed, which filled entirely the second tube. It seems that this configuration allows the formation of “diffuse” and
cylindrical CAPs of about 5 mm in diameter (inner diameter of the second tube) and 60 mm in length. Even if the radius of these “diffuse” CAPs decreases once they interact with the atmospheric air, it is remarkable that these plasmas appear relatively stable in the tube and propagate along several centimetres in air, which appears surprising at atmospheric pressure. This behaviour was observed both during the presence and the absence of the shielding at different compositions (see Figure 3).
Figure 3. Specific “diffuse” ionization waves generated with the shielding gas device for various O2/N2 mixtures. The flow rate is
fixed at 1.67 slm for the working gas (pure He) and at 0.03 slm for the various O2/N2 compositions added in the surrounding device.
CAPs are propagated in air after their exit from the shielding gas tube.
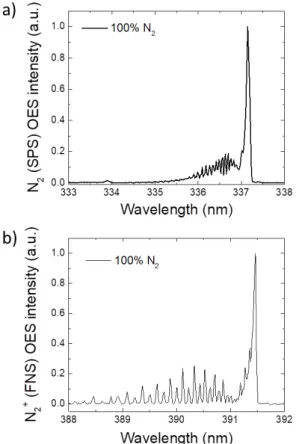
From a physical point of view, it is underlined that these “diffuse” plasmas are true CAPs in nature. Indeed, by analysing via Optical Emission Spectroscopy (OES) the gas phase inside the quartz tube, a dominant emission of the Second Positive System of nitrogen N2(SPS) is measured, suggesting
its formation by electronic collisions with molecular nitrogen 47 (see Figure 4a). Other possible mechanisms leading to N2(SPS) formation under our
experimental conditions could be related with pooling reactions between nitrogen molecule metastable states (i.e., N2(A)) 48. Indeed, as it was
shown in our previous work for an unshielded plasma device 49, N2(A) is likely to be produced due
to the radiative relaxation of the nitrogen molecule first positive system (N2(FPS)) at various
wavelengths in the range 600-900 nm. Besides, the First Negative System of molecular nitrogen ion
N2+(FNS) has also been detected, which proves the
presence of positive charges (see Figure 4b). These charged species are crucial for the development of the ionization waves over large distances since, along with the negative ones, they define the localized reduced electric field values. N2+(FNS)
ground (N2(X)) and (mainly) excited state of
molecular nitrogen 15,50. Another important formation pathway is the so-called Penning ionization 15,50, which is established between helium metastables (Hem) and N2(X) giving N2+(B). Then, the
N2+(FNS) transition (see Figure 4b) is obtained via
radiative relaxation of the N2+(B) to the N2+(X) state.
Metastable states, thus, appear to be crucial for such kind of plasmas since they stimulate various reactions in the gaseous chemistry, which in turns will induce modifications on the liquid chemistry. The colour of the diffuse CAPs depends also on the shielding gas composition. Moreover, the luminous wavelength-integrated intensity of these ionization waves decreases when oxygen is added to the shielding gas (see Figure 3) suggesting the modification of the gaseous chemistry as it was stated above. From a phenomenological point of view, these “diffuse” cold atmospheric plasmas may be explained by the high potential gradient between the axis of the ionization wave (near 7.5 kV potential and highly luminous) and the wall of the shielding quartz tube (near at ground potential). In fact, this system behaves as a multi-streamer discharge generated between a metallic wire and the inner wall of a grounded cylinder.
Figure 4. Normalised OES rotational spectra of a) N2(SPS) and b)
N2+(FNS), measured at 337.1 nm and 391.4 nm, respectively, in the
shielding gas tube for 100% N2.
OPTICAL EMISSION SPECTROSCOPY OF CAPs
The main goal of the present study was to determine the impact of a gaseous environment on the chemistries of the plasma and the exposed liquid. According to our previous study in an open air configuration 27, the same types of species are expected to be found in this new enclosed configuration, but their ratios could be different depending on the shielding gas composition. In other words, in terms of species nature, one could
generalize these results for every CAP system (i.e., with or without shielding device). Although, in terms of species densities, herein it is demonstrated that the present shielding device is advantageous allowing controlled production of well-defined reactive species both in the gaseous and the liquid phase.
Firstly, OES measurements were performed on the plasma phase. Qualitatively, the same species as in our previous works (different reactors 49–51 and power supplies 16 were effectively detected: excited
He, N2+(FNS, First Negative System) and N2(SPS,
Second Positive System), which are shown in Figure 4
for the present system, N2(FPS, First Positive
System), second order of NO•, Hα, second order of
HO• and O. Surprisingly, an additional emission has
been detected, corresponding to the first negative band system of O2+(FNS) (b!Σ!! → a!π!transition) at
558 nm 52, which has not been observed in the unshielded CAPs 49. OES intensities were then normalized for each species and plotted as function of the shielding gas composition in O2/N2 (Figure 5).
Thus, the intensity for a given specie can only be compared upon the different shielding gas conditions. Figure 5a depicts He transitions observed at 667.8, 706.5 and 728.1 nm. In Figure 5b and 5c, different excited species coming from nitrogen (N2+(FNS), N2(SPS), N2(FPS) and second order of
NO•) and oxygen derivatives (second order of HO•,
O2+, O and Hα,) are reported, respectively. Note that
O2+ emission in 100% N2 and 20% O2/80% N2 was too
weak to be measured and not plotted for these two conditions.
Figure 5a shows that He emission intensities reach an optimal value for 20% O2/80% N2 in the shielding
gas. On the contrary, the intensity is lower for 100% O2. In Figure 5b, we observe that the intensities of
the N2+(FNS), the N2(SPS), N2(FPS) and the second
order of NO• are higher for 100% N2 in the shielding
gas. When the O2/(O2+N2) ratio increases, the UV
intensity drops down by about 90 % and cannot even be detected for 100% O2. For N2+(FNS), N2(SPS)
and N2(FPS), the intensity decreases linearly down to
zero when oxygen is added in the shielding gas. Figure 5c illustrates the intensities of Hα, and second
order of HO•, O
2+ and O species. When the amount
of nitrogen is decreased in the shielding gas, HO•
emission decreases exponentially, similarly to Hα
both particles. We can hypothesize a mechanism due to water dissociation. On the other hand, O2+
cation is detected starting from 50% O2/50% N2 in
the shielding gas and remains constant for 50, 80 and 100% O2. In turn, atomic oxygen O increases
until reaching a maximum plateau value for 80 and 100% O2.
In a logical way, nitrogen species prevail when the O2/(O2+N2) ratio is low while on the contrary, oxygen
species are predominant for a higher O2/(O2+N2)
ratio. In contrast, HO• radical is mostly detected for 100% N2, which is counter intuitive. One mechanism is usually proposed for the formation of HO• (Eq. 2) 1,53,54: N2 (A3Σu+) + H2O → HO• + H. + N 2 (Eq. 2)
Humidity is not controlled in our system but could result from water backscatter of the PBS liquid exposed to the CAPs. The metastable state N2(A3Σu+)
is probably mostly generated by electronic collisions with the fundamental state of N2 molecule, N2(X1Σg+), and by radiative relaxation of the first
excited state of nitrogen N2(B3Πg) to the N2 (A3Σu+)
(i.e. N2(FPS) transition, see Eq. 3 below) as it was
discussed previously, which is formed by collisions of the fundamental state of N2 molecule, N2(X1Σg+),
with electrons:
N2 (B3πg) → N2 (A3Σu+) + hν (Eq. 3)
Considering that N2(FPS) is mostly generated for
100% N2 (Figure 5b), the N2(A3Σu+) metastable state
is probably a dominant species for that condition, explaining thus the high yield of HO• radical.
Finally, the composition 20% O2/80% N2 appears to
be critical for the formation/destruction of excited species in the ionization wave. Particularly, NO• and
HO• emission intensities decrease strongly when
oxygen is added to the shielding gas. Last remark concerns H atoms, which seem to be more produced for both 100% N2 and air (20% O2/80% N2)
conditions but less for higher O2 contents.
This optical study finally shows that the gaseous environment composition of the plasma is a major parameter influencing its chemical reactivity. Besides, three shielding gas compositions appear to be interesting in our experiments:
- 100% N2, for which metastable state of
nitrogen N2(A3Σu+) appears maximal as well
as other nitrogen excited states (SPS, FNS); - 20% O2/80% N2 (air-equivalent condition),
for which an optimal excitation of helium atoms is obtained, but also a modification of NO• and HO• emissions, which decrease
drastically, oppositely to an increase of atomic oxygen O emission;
- 100% O2, at which all emissions are
considerably reduced except those of
atomic oxygen O and dioxygenyl cation O2+.
Consequently, for these three shielding gas compositions, differences in RONS concentrations in the treated liquids are expected.
Figure 5. Normalized intensity evolution of a. He at 667.8 nm, 706.5 nm and 728.1 nm; b. N2+ FNS at 391.4 nm, N2 SPS at 337.1 nm, N2
FPS at 762 nm and second order of NO• at 493 nm; c. H
a at 656 nm,
second order of HO• at 618 nm, O2+ at 558 nm and O at 777.5 nm as
a function of the shielding gas composition. All measurements were carried out in triplicate by realizing three independent experiments. Values are calculated as mean ± SD. PLASMA TEMPERATURE EVALUATION
An important parameter of cold atmospheric plasmas is the temperature of the gas, which is crucial for further applications where thermo-sensible materials are used. In order to estimate the mean temperature of the gas, the traditional analysis of rotational structures of adequate molecular probes has been used in this work, i.e. the transitions of 𝑁! (𝑆𝑃𝑆) (𝐶!ᴨ!→ 𝐵!ᴨ!) at 337.1 nm,
𝐻𝑂.(𝐴!𝛴!→ 𝑋!ᴨ
!) at 309 nm and
𝑁!! (𝐹𝑁𝑆) (𝐵!𝛴!!→ 𝑋!𝛴!!) at 391.4 nm 16,49,55–56. The
rotational temperatures of these molecules were evaluated thanks to the previous OES data presented in Figures 4 and 5 and were plotted as a function of the shielding gas composition in Figure 6.
Figure 6. Rotational temperature evolution of the probe molecules
HO• (A!Σ!→ X! 𝑖) at 618 nm (second order), 𝑁!!𝐹𝑁𝑆 (B!Σ!!→ X!Σ!!) at
391.4 nm and 𝑁! 𝑆𝑃𝑆 (C! 𝑢 → B! 𝑔) at 337.1 nm as a function of
the O2/(O2+N2) ratio (0.03 slm). All measurements were carried out
in triplicate by realizing three independent experiments. Values are calculated as mean ± SD.
Results from Figure 6 show that the rotational temperature of 𝑁!!(𝐹𝑁𝑆) increases linearly from 400
to 450 K when oxygen is added in the shielding gas. The last point for 100% O2 is outlier because the
emission band of 𝑁!!(𝐹𝑁𝑆) is very weak and not well
defined for that condition, so this point has been removed from the Figure 6. For 𝑁!(𝑆𝑃𝑆) and HO•
radical, the rotational temperatures are found approximately between 350 and 300 K. Eventually, these rotational temperatures are close to the room temperature, suggesting that the mean temperature of the gas is compatible with thermo-sensitive applications. On the other hand, the rotational temperature of 𝑁!!(𝐹𝑁𝑆) is noticeably higher than
the ones of HO• and 𝑁
!(𝑆𝑃𝑆). This difference is
attributed to the generation of helium metastables (justifying furthermore the hypotheses of Figure 4) and helium dimer ions in the guided streamers. Indeed, these molecules contribute effectively to the excitation/ionization of 𝑁!(𝑋) at the 𝑁!!(𝐵) level due
to Penning ionization. In this case, 𝑁!!(𝐵) is
expected to be excited at high rotational energy levels along with an overpopulation of this excited state. There is thus an absence of equilibrium between this molecular ion’s rotational degrees of freedom and the translational ones of the gaseous species (i.e. gas temperature), leading to higher rotational temperatures. Such mechanisms were not found for the other two molecules under our experimental conditions and their rotational temperatures remain close to the room’s one. These differences on the rotational temperatures between these molecules are the same with the ones observed for unshielded CAPs devices 49, which shows that the shielding device doesn’t play a role on the temperature of CAPs.
QUANTIFICATION OF EVAPORATION
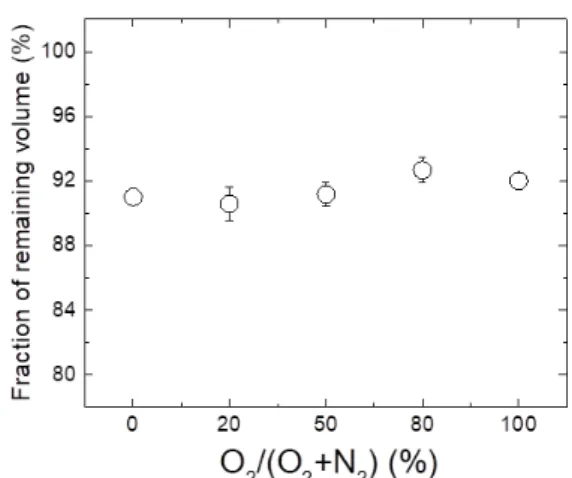
A possible evaporation of the solution under exposure to the plasma is a factor necessary to evaluate since it may have a direct impact on the plasma chemistry. This phenomenon has to be quantified for any application of CAPs. In our case, the evaporation cannot be due to a temperature increase, according to rotational temperatures estimated above and the volume of treated solution (2 mL). The remaining volume was measured for 10 minutes of plasma treatment, for each condition of shielding gas composition. Results are depicted below (Figure 7):
Figure 7. PBS volume evolution (pH 7.4, room temperature) after 10 minutes of CAP treatment (working gas 1.67 slm He) for various shielding gas compositions (0.03 slm). Initial volume: 2 mL. All measurements were carried out in triplicate by realizing three independent experiments. Values are calculated as mean ± SD.
The evaporation was found to reach about 10 % in all conditions and was twice reduced as compared with the non-shielded setup, for the same treatment time of 10 minutes 27. Here, the gas flow rate is lower (i.e. 1.7 vs. 2 slm) so its influence on the liquid is less important. In addition, due to the enclosed environment around the liquid, the water vapour is kept inside the capped well. This result seems to show that, for any condition in the well, the gaseous environment of the ionization wave affects its velocity with an identical hydrodynamic manner, probably due to the presence of a lid over the well. In contrast, it is not the case for the macroscopic aspect of these “diffuse” plasmas (Figure 3), when the ionization wave arrives into the ambient air. Indeed, the CAP with pure oxygen shielding is shorter than the other ones.
Finally, as the evaporation remains constant whichever the conditions are, it can be considered
as a non-influencing parameter for the
interpretation of the induced chemistry in the liquid investigated below.
MEASUREMENTS OF STABLE NITROGEN SPECIES PRODUCED BY CAPS IN PBS (PH 7.4)
Electrochemistry and UV-visible absorption
spectroscopy have been employed as
complementary methods for the identification and quantification of stable oxygen and nitrogen species dissolved in PBS (pH 7.4) after plasma treatment (10 min), for several shielding gas compositions.
Figure 8 shows cyclic voltammograms detected on platinized microelectrodes in PBS solutions after
various plasma treatments. As shown in a previous report 27, two distinct oxidation waves appear
following the exposure of PBS to our plasmas: the first one corresponds to the irreversible oxidation of
H2O2 between 160 and 500 mV and the second one
is related to the irreversible oxidation of NO2-
between 650 and 850 mV vs Ag/AgCl. Moreover, the currents vary as a function of the shielding gas condition; so one can expect different final ratios of H2O2/NO2-. Then, we evaluated the concentrations
of these species by using calibration curves extracted from pure solutions of H2O2 and NaNO2
prepared in PBS buffer at pH 7.4. Based on these calibration curves, the concentrations of each species were obtained at each shielding gas composition and plotted as function of the O2/(O2+N2) ratio (see Figure 10).
Figure 8. Cyclic voltammograms (20 mV.s-1) measured in 2 mL of
PBS (pH 7.4) treated 10 minutes by CAP (working gas 1.67 slm He) as a function of the shielding gas composition (0.03 slm).
Since Nitrate (NO3-) ions are not electro-active in our
conditions, they were quantified via UV-visible absorption spectroscopy using the Beer-Lambert law at 320 nm (Eq. 1). Indeed, at this wavelength only NO2- and NO3- are the absorbent species (under 320
nm, H2O2 absorbs also). Moreover, nitrite
concentrations evaluated by UV absorption spectroscopy were very similar to the ones measured by electrochemistry, showing that these two methods are reliable and complementary to each other (data not shown).
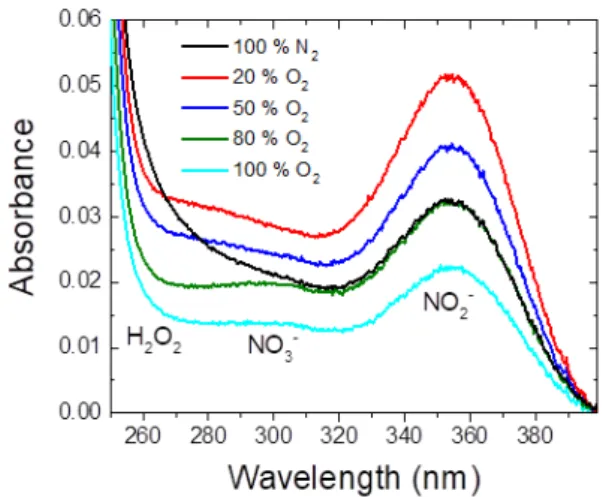
Figure 9. UV absorption spectra (optical length = 5cm) measured in 2 mL of PBS (pH 7.4) treated 10 minutes by CAP (working gas 1.67 slm He) as a function of the shielding gas composition (0.03 slm).
UV spectra in Figure 9 depict 3 contributions: H2O2
around 260 nm and nitrate and nitrite peaking at 300 and 354 nm, respectively. The molar extinction coefficients of NO2- and NO3- are respectively
𝜀!"!!,!"" !"= 8 M
!!. cm!! , 𝜀
!"!!,!"# !"= 18,9 M
!!. cm!!. They
were determined by using standard solutions prepared in PBS and calculated thanks to Eq. 1. In a global manner, the total absorbance of the solution increases when oxygen is added to the shielding gas. For 100% N2, the H2O2 contribution seems to be
more important (see black line in Figure 9). This observation is confirmed by cyclic voltammograms (black cycle on Figure 8), because oxidative current corresponding to H2O2 (plateau current at 300 mV) is
more important for that condition. Following, the concentrations of each species have been calculated thanks to these data and plotted as a function of the O2/(O2+N2) ratio in the shielding gas. The
corresponding results are depicted on Figure 10.
Figure 10. Variations of Nitrite (NO2-), hydrogen peroxide (H2O2) and
nitrate (NO3-) concentrations measured in 2 mL of PBS (10 mM, pH
7.4) treated 10 minutes by CAPs (working gas 1.67 slm He) for various shielding gas compositions (0.03 slm). NO2- and H2O2 are
measured using electrochemistry whereas NO3-
in triplicate by realizing three independent experiments. Values are calculated as mean ± SD.
Globally, the concentrations of H2O2, NO2- and NO3-
are in the order of hundreds of micromolar for 10 minutes of CAP treatment. Nitrite ions follow a very clear trend, since a maximum, 620 ± 50 µM, is obtained for the condition 20% O2/80% N2. The
conditions of 100% N2, 80% O2 and 100% O2
generate roughly the same quantities of NO2-: 374 ±
70, 390 ± 70, 360 ± 80 µM, respectively. Hydrogen peroxide (H2O2), in turn, does not follow the same
trend: the concentration is higher for 100% N2 in the
shielding gas reaching 265 ± 40 µM. The trend for nitrate NO3- is similar to the one of H2O2.
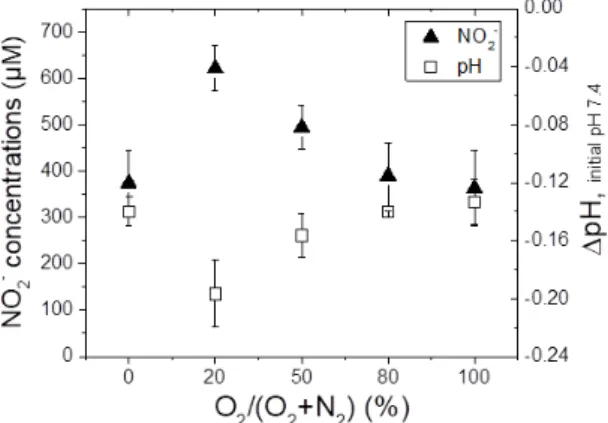
Based on the assessment that nitrite ions are associated with pH variations 27, we measured the resulting pH of PBS solution after 10 minutes of CAP treatment. For better comparison, concentrations of NO2- were plotted in the same graph (Figure 11). Figure 11. pH variations measured in 2 mL of PBS (10 mM, pH 7.4) after a 10 minute treatment by CAP (working gas 1.67 slm He) as a function of the shielding gas composition (0.03 slm). Comparison with NO2- concentrations measured afterwards. All measurements
were carried out in triplicate by realizing three independent experiments. Values are calculated as mean ± SD.
For all considered conditions, a pH decrease is observed, -0.20 pH units at most for the condition of 20% O2/ 80% N2, which corresponds to “air
shielding” and represents an optimum. For 100% N2
and 100% O2, the pH variations are approximately
the same, about -0.14 pH units. Moreover, these results show a good correlation between NO2-
concentrations and pH variations. More nitrite are found when pH lowers. NO2- accumulation could be
due to the prior existence of nitrous acid, HNO2.
HNO2 is a weak acid (pKa([HNO2/NO2_]) = 3.3 41)
reacting quantitatively with the base of the buffer, HPO42- (K = 10+3.9) leading to H2PO4- and NO2-. HNO2
can actually be formed in the gaseous phase by the reaction between HO• and NO• 53,57,58 (rate
coefficient 3.3 × 10⁻¹⁷ m3 s-1 53) (Eq. 4): HO• + NO• + M → HNO 2 + M (Eq. 4) with M, representing a third collision partner.
Concerning H2O2, at a glance, the observation of
higher concentrations for 100% N2 in the shielding
gas, is not intuitive. However, regarding the excited species generated in the gas, HO• emission is
maximum for a pure nitrogen shielding (Figure 5c). H2O2 could be formed in the discharge due to the
following reaction (Eq. 5) 53,57,59:
HO• + HO• + M → H2O2 (Eq. 5)
with M, representing a third collision partner. Consequently, HO• radicals produced in the plasma
are expected to form H2O2 directly in the gas phase 44,50,53 (Rate coefficient: 2.6 × 10⁻¹⁷ m3 s-1, 53),
followed by its solvation into the liquid since the Henry’s constant for H2O2 is high (𝐻= 1.92 x 10⁶ at
300 K, 105 Pa, 58), or by solvation of HO• radicals
(detected by RPE in plasma treated liquids 60) and their reaction to form H2O2 in solution. Note that
Tresp et al. found similar results in other liquid media (e.g. NaCl, DPBS and RPMI) and for other plasma parameters 24.
Since the evaporation is the same for all conditions of shielding gas, concentration variations are clearly the result of different chemistries induced by CAP treatment. The air shielding (20% O2/80% N2) seems
to be the most efficient for the production of NO2-.
Considering the excited species produced in the gas phase, it is clear that the RNS/ROS ratio in the solution depends on the O2/(O2+N2) percentage. On
the contrary, NO3- does not follow the same trend as
NO2-. A possible pathway for NO3- formation is (Eq.
6) 58,59:
NO2• + HO• + M → HNO3 + M (Eq. 6)
with M, representing a third collision partner. NO2•
radical is expected to be generated under our conditions since its formation is owed to NO•, due to the following reactions (Eq. 7 and 8) 25,57,59:
NO• + O → NO2• (Eq. 7)
NO• + O3 → NO2• + O2 (Eq. 8)
However, the very good correlation between NO2-
and pH variations (Figure 11) seems to show that HNO2 is mostly responsible for the acidification,
excluding a priori another source of H+ ions. Besides, NO3- ions are possibly produced thanks to another
pathway (peroxynitrite decomposition) or already created in the gas phase as suggested by computational studies 12,57.
On the other hand, it is surprising that NO2-
concentrations are approximately the same for 100% N2 and 100% O2 shieldings (see Figure 10),
compare to the amount of RNS in the plasma for these conditions (see Figure 5). Indeed, the RNS/ROS
ratios in CAPs are inverted for these two conditions (more RNS for 100% N2 and more ROS for 100% O2).
Nevertheless, nitrite ions are produced at similar quantities in the PBS. This finding suggests first that the chemical mechanisms producing stable nitrogen species in the liquid phase could be shielding-dependent, with different involved chemistries.
Secondly, the liquid chemistry is maybe strongly dependent on the processes occurring near the plasma-liquid interface, knowing that there is an air layer above the surface. Indeed, when the plasma propagates into the well under the cap, its interaction with the air may influence its own chemistry, independently of former chemical processes that occurred within the tube over several centimetres. Finally, the small amount of nitrogen excited species detected for 100% O2 in the shielding gas is probably enhanced when the ionization wave is in contact with N2 from air in the well. MEASUREMENTS OF PEROXYNITRITE: AN UNSTABLE RNS
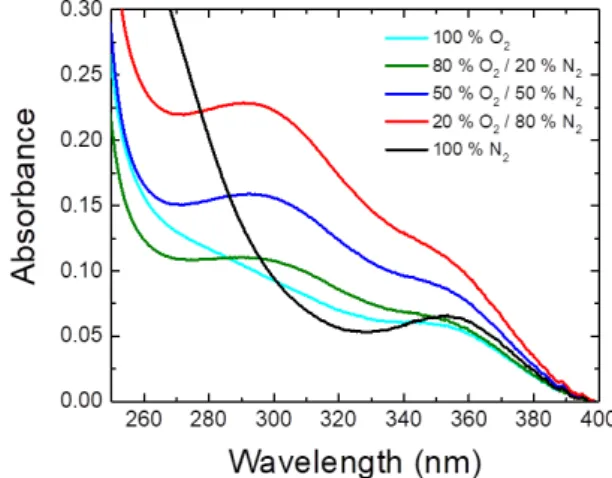
The formation of ONOO- in treated PBS was evaluated by UV absorption spectroscopy in alkaline PBS (pH 12), in order to stabilise chemically this species. In fact, acid and basic forms of peroxynitrite decompose into nitrite and nitrate in various ratios depending on multiple factors: pH, temperature, concentration, chemical reaction with other species (CO2, phosphates) 61–64. Here, peroxynitrite anion
ONOO- has been detected and quantified in 2 mL of PBS solution (pH 12) treated by CAP for all conditions of shielding gas. Corresponding UV spectra are depicted in Figure 12.
Figure 12: UV spectra (l=5cm) measured in 2 mL of PBS (pH 12), treated 10 minutes by CAP (working gas 1.67 slm He) for various shielding conditions (0.03 slm).
These spectra reveal the presence of at least 3 species, i.e. HO2- (basic form of H2O2) around 260
nm, ONOO- at 300 nm and NO2- at 350 nm. ONOO-
concentrations were calculated using the Beer-Lambert law, following the method described previously 27 and plotted as a function of the O2/(O2+N2) ratio (Figure 13). Firstly, the
concentrations are quite low (tens of micromoles) for 10 minutes of treatment. Secondly, the trend is very similar to the one of NO2-. Indeed, the condition
(20% O2/80% N2) generates once more higher
concentrations, about 23 ± 4 µM. For 100% N2 and
100% O2 as shielding gas composition,
concentrations reach about 10 µM.
Figure 13. Peroxynitrite (ONOO-) concentrations measured by UV
absorption spectroscopy in PBS (pH 12) treated 10 minutes by CAP (working gas 1.67 slm He) for various shielding conditions (0.03 slm). All measurements were carried out in triplicate by realizing three independent experiments. Values are calculated as mean ± SD.
These results suggest that ONOO- may be one of the precursor of NO2-, or that a common mother species
would be involved for the production of both peroxynitrite and nitrite. In addition, since the production of NO2- is very similar at pH 7.4 and 12
(see Figure 14), it may be due mostly to species which acid-base equilibrium does not fall within this range of pHs. It was often hypothesize in literature that HNO2 is a major species produced in
air-dependent CAPs, which is compatible with the decrease of pH observed in treated PBS and with the accumulation of NO2- in the solution as function of
time. In other words, nitrous acid is probably the major source of nitrite present at substantially high concentrations in exposed physiological buffer.
Figure 14. Comparison of nitrite (NO2-) concentrations measured in
PBS at pH 7.4 and 12 for various shielding gas compositions after 10 minutes of CAP treatment. NO2- were measured thanks to
UV-visible absorption spectroscopy. All measurements were carried out in triplicate by realizing three independent experiments. Values are calculated as mean ± SD.
CONCLUSION
In this work, a shielding gas device was used to modulate and study plasma and liquid chemistries, regarding the gaseous environment of the ionization wave. Specific “diffuse” CAPs were obtained, with the characteristic to propagate along several centimetres into the ambient air. The different plasmas were characterized by OES measurements of the luminous area found in a close vicinity of the liquid and covered by the shielding tube, revealing the presence of charges (such as N2+(FNS)), and
other species originating from electronic collisions with ground state atoms and molecules. This showed that these “diffuse” plasmas have the same characteristics as most of CAPs. Moreover, OES measurements demonstrated the strong influence of the shielding gas composition on the plasma chemistry. In fact, the nitrogen/oxygen excited species ratio in the gas phase depends on the O2/(O2+N2) percentage. As it could be expected,
nitrogen species are dominant for a low O2/(O2+N2)
percentage, while oxygen species are dominant for a higher O2/(O2+N2) percentage. The
physico-chemistry of PBS, a standard physiological buffer, was investigated using two complementary techniques (UV-visible absorption spectroscopy and electrochemistry). The operating air-condition (20% O2/80% N2) appears to be critical for the
formation/destruction of exited species in the gas phase, while in the liquid this composition is optimum for the production of RNS such as NO2- and
ONOO-. Overall, RONS generation is thus shielding-dependent. In addition, different links between gaseous and liquid species are observed. Especially, the metastable state N2 (A3Σu+) is probably a
precursor of H2O2 via the formation of the hydroxyl
radical HO•. Moreover, hydrogen peroxide H2O2 is
probably already formed in the gas phase, but the possibility that a proportion could be produced in solution cannot be excluded, since HO• radicals are
solvated in the liquid. Finally, the chemistry occurring at the plasma-liquid interface seems to be essential for the ionization wave chemistry, as well as the induced-liquid chemistry, proving that the gaseous environment of the plasma is essential and need to be controlled.
ACKNOWLEDGMENTS
This work was financially supported by the Centre National de la Recherche Scientifique (CNRS), the French Ministry of Research (MESR) and the Agence nationale de la Recherche (ANR, PLASMAREGEN project, no. ANR-14-CE16-0007-01). The current affiliation of K. Gazeli is: LPGP, CNRS, Univ. Paris-Sud, Université Paris-Saclay, 91405 Orsay, France
PCCP
ARTICLE
REFERENCES
1 C. E. Anderson, N. R. Cha, A. D. Lindsay, D. S. Clark and D. B. Graves, The Role of Interfacial Reactions in Determining Plasma– Liquid Chemistry, Plasma Chem. Plasma Process., 2016, 36, 1393– 1415.
2 D. Mariotti, J. Patel, V. Švrček and P. Maguire, Plasma-Liquid Interactions at Atmospheric Pressure for Nanomaterials Synthesis and Surface Engineering, Plasma Process. Polym., 2012, 9, 1074– 1085.
3 P. J. Bruggeman, M. J. Kushner, B. R. Locke, J. G. E. Gardeniers, W. G. Graham, D. B. Graves, R. C. H. M. Hofman-Caris, D. Maric, J. P. Reid, E. Ceriani, D. Fernandez Rivas, J. E. Foster, S. C. Garrick, Y. Gorbanev, S. Hamaguchi, F. Iza, H. Jablonowski, E. Klimova, J. Kolb, F. Krcma, P. Lukes, Z. Machala, I. Marinov, D. Mariotti, S. Mededovic Thagard, D. Minakata, E. C. Neyts, J. Pawlat, Z. L. Petrovic, R. Pflieger, S. Reuter, D. C. Schram, S. Schröter, M. Shiraiwa, B. Tarabová, P. A. Tsai, J. R. R. Verlet, T. von Woedtke, K. R. Wilson, K. Yasui and G. Zvereva, Plasma–liquid interactions: a review and roadmap, Plasma Sources Sci. Technol., 2016, 25, 053002.
4 H. Jablonowski and T. von Woedtke, Research on plasma medicine-relevant plasma–liquid interaction: What happened in the past five years?, Clin. Plasma Med., 2015, 3, 42–52.
5 P. Lukes, E. Dolezalova, I. Sisrova and M. Clupek, Aqueous-phase chemistry and bactericidal effects from an air discharge plasma in contact with water: evidence for the formation of peroxynitrite through a pseudo-second-order post-discharge reaction of H2O2
and HNO2, Plasma Sources Sci. Technol., 2014, 23, 015019.
6 Z. Liu, D. Xu, D. Liu, Q. Cui, H. Cai, Q. Li, H. Chen and M. G. Kong, Production of simplex RNS and ROS by nanosecond pulse N2/O2
plasma jets with homogeneous shielding gas for inducing myeloma cell apoptosis, J. Phys. Appl. Phys., 2017, 50, 195204. 7 M. J. Traylor, M. J. Pavlovich, S. Karim, P. Hait, Y. Sakiyama, D. S.
Clark and D. B. Graves, Long-term antibacterial efficacy of air plasma-activated water, J. Phys. Appl. Phys., 2011, 44, 472001. 8 D. B. Graves, Low temperature plasma biomedicine: A tutorial
review, Phys. Plasmas, 2014, 21, 080901.
9 X. Lu, G. V. Naidis, M. Laroussi, S. Reuter, D. B. Graves and K. Ostrikov, Reactive species in non-equilibrium atmospheric-pressure plasmas: Generation, transport, and biological effects,
Phys. Rep., 2016, 630, 1–84.
10 M. G. Kong, G. Kroesen, G. Morfill, T. Nosenko, T. Shimizu, J. van Dijk and J. L. Zimmermann, Plasma medicine: an introductory review, New J. Phys., 2009, 11, 115012.
11 S. Maheux, D. Duday, T. Belmonte, C. Penny, H.-M. Cauchie, F. Clément and P. Choquet, Formation of ammonium in saline solution treated by nanosecond pulsed cold atmospheric microplasma: a route to fast inactivation of E. coli bacteria, RSC
Adv, 2015, 5, 42135–42140.
12 K. Wende, P. Williams, J. Dalluge, W. V. Gaens, H. Aboubakr, J. Bischof, T. von Woedtke, S. M. Goyal, K.-D. Weltmann, A. Bogaerts,
K. Masur and P. J. Bruggeman, Identification of the biologically active liquid chemistry induced by a nonthermal atmospheric pressure plasma jet, Biointerphases, 2015, 10, 029518.
13 Arben Kojtari, Utku K Ercan, Josh Smith, Gary Friedman, Richard B Sensenig, Somedev Tyagi, Suresh G Joshi, Hai-Feng Ji and Ari D Brooks, Chemistry for Antimicrobial Properties of Water Treated With Non-Equilibrium Plasma, J. Nanomedicine Biotherapeutic
Discov., 4: 120, DOI:10.4172/2155-983X.1000120.
14 G. Kamgang-Youbi, J.-M. Herry, T. Meylheuc, J.-L. Brisset, M.-N. Bellon-Fontaine, A. Doubla and M. Naïtali, Microbial inactivation using plasma-activated water obtained by gliding electric discharges, Lett. Appl. Microbiol., 2009, 48, 13–18.
15 X. Lu, G. V. Naidis, M. Laroussi and K. Ostrikov, Guided ionization waves: Theory and experiments, Phys. Rep., 2014, 540, 123–166. 16 K. Gazeli, P. Svarnas, P. Vafeas, P. K. Papadopoulos, A. Gkelios
and F. Clément, Investigation on streamers propagating into a helium jet in air at atmospheric pressure: Electrical and optical emission analysis, J. Appl. Phys., 2013, 114, 103304.
17 S. Iseni, A. Schmidt-Bleker, J. Winter, K.-D. Weltmann and S. Reuter, Atmospheric pressure streamer follows the turbulent argon air boundary in a MHz argon plasma jet investigated by OH-tracer PLIF spectroscopy, J. Phys. Appl. Phys., 2014, 47, 152001. 18 J. L. Walsh, J. J. Shi and M. G. Kong, Contrasting characteristics of
pulsed and sinusoidal cold atmospheric plasma jets, Appl. Phys.
Lett., 2006, 88, 171501.
19 B. L. Sands, B. N. Ganguly and K. Tachibana, A streamer-like atmospheric pressure plasma jet, Appl. Phys. Lett., 2008, 92, 151503.
20 Q. Xiong, A. Y. Nikiforov, X. P. Lu and C. Leys, A Branching Streamer Propagation Argon Plasma Plume, IEEE Trans. Plasma
Sci., 2011, 39, 2094–2095.
21 J.-P. Boeuf, L. L. Yang and L. C. Pitchford, Dynamics of a guided streamer (“plasma bullet”) in a helium jet in air at atmospheric pressure, J. Phys. Appl. Phys., 2013, 46, 015201.
22 G. V. Naidis, Simulation of streamers propagating along helium jets in ambient air: Polarity-induced effects, Appl. Phys. Lett., 2011, 98, 141501.
23 S. Hübner, S. Hofmann, E. M. van Veldhuizen and P. J. Bruggeman, Electron densities and energies of a guided argon streamer in argon and air environments, Plasma Sources Sci.
Technol., 2013, 22, 065011.
24 H. Tresp, M. U. Hammer, K.-D. Weltmann and S. Reuter, Effects of atmosphere composition and liquid type on plasma-generated reactive species in biologically relevant solutions, Plasma Med., 2013, 3, 45–55.
25 T. Murakami, K. Niemi, T. Gans, D. O’Connell and W. G. Graham, Chemical kinetics and reactive species in atmospheric pressure helium–oxygen plasmas with humid-air impurities, Plasma
Sources Sci. Technol., 2013, 22, 015003.
26 M. Dünnbier, A. Schmidt-Bleker, J. Winter, M. Wolfram, R. Hippler, K.-D. Weltmann and S. Reuter, Ambient air particle transport into the effluent of a cold atmospheric-pressure argon plasma jet investigated by molecular beam mass spectrometry, J.
27 F. Girard, V. Badets, S. Blanc, K. Gazeli, L. Marlin, L. Authier, P. Svarnas, N. Sojic, F. Clément and S. Arbault, Formation of reactive nitrogen species including peroxynitrite in physiological buffer exposed to cold atmospheric plasma, RSC Adv, 2016, 6, 78457– 78467.
28 S. Ikawa, K. Kitano and S. Hamaguchi, Effects of pH on Bacterial Inactivation in Aqueous Solutions due to Low-Temperature Atmospheric Pressure Plasma Application, Plasma Process.
Polym., 2010, 7, 33–42.
29 L. Bundscherer, S. Nagel, S. Hasse, H. Tresp, K. Wende, R. Walther, S. Reuter, K.-D. Weltmann, K. Masur and U. Lindequist, Non-thermal plasma treatment induces MAPK signaling in human monocytes, Open Chem., 2015, 13, 606–613.
30 J. Winter, K. Wende, K. Masur, S. Iseni, M. Dünnbier, M. U. Hammer, H. Tresp, K.-D. Weltmann and S. Reuter, Feed gas humidity: a vital parameter affecting a cold atmospheric-pressure plasma jet and plasma-treated human skin cells, J. Phys. Appl.
Phys., 2013, 46, 295401.
31 Y. Gorbanev, D. O’Connell and V. Chechik, Non-Thermal Plasma in Contact with Water: The Origin of Species, Chem. - Eur. J., 2016,
22, 3496–3505.
32 Y. Gorbanev, C. C. W. Verlackt, S. Tinck, E. Tuenter, K. Foubert, P. Cos and A. Bogaerts, Combining experimental and modelling approaches to study the sources of reactive species induced in water by the COST RF plasma jet, Phys. Chem. Chem. Phys., 2018, 2797–2808.
33 M. Vandamme, E. Robert, S. Lerondel, V. Sarron, D. Ries, S. Dozias, J. Sobilo, D. Gosset, C. Kieda, B. Legrain, J.-M. Pouvesle and A. L. Pape, ROS implication in a new antitumor strategy based on non-thermal plasma, Int. J. Cancer, 2012, 130, 2185–2194. 34 H. J. Ahn, K. I. Kim, N. N. Hoan, C. H. Kim, E. Moon, K. S. Choi, S.
S. Yang and J.-S. Lee, Targeting Cancer Cells with Reactive Oxygen and Nitrogen Species Generated by Atmospheric-Pressure Air Plasma, PLoS ONE, 2014, 9, e86173.
35 D. B. Graves, The emerging role of reactive oxygen and nitrogen species in redox biology and some implications for plasma applications to medicine and biology, J. Phys. Appl. Phys., 2012,
45, 263001.
36 A. Schmidt, S. Bekeschus, H. Jablonowski, A. Barton, K.-D. Weltmann and K. Wende, Role of Ambient Gas Composition on Cold Physical Plasma-Elicited Cell Signaling in Keratinocytes,
Biophys. J., 2017, 112, 2397–2407.
37 H. Jablonowski, M. A. C. Hänsch, M. Dünnbier, K. Wende, M. U. Hammer, K.-D. Weltmann, S. Reuter and T. von Woedtke, Plasma jet’s shielding gas impact on bacterial inactivation, Biointerphases, 2015, 10, 029506.
38 T. Ito, G. Uchida, A. Nakajima, K. Takenaka and Y. Setsuhara, Control of reactive oxygen and nitrogen species production in liquid by nonthermal plasma jet with controlled surrounding gas,
Jpn. J. Appl. Phys., 2017, 56, 01AC06.
39 A. Schmidt-Bleker, J. Winter, A. Bösel, S. Reuter and K.-D. Weltmann, On the plasma chemistry of a cold atmospheric argon plasma jet with shielding gas device, Plasma Sources Sci. Technol., 2016, 25, 015005.
40 S. Iseni, S. Zhang, A. F. H. van Gessel, S. Hofmann, B. T. J. van Ham, S. Reuter, K.-D. Weltmann and P. J. Bruggeman, Nitric oxide density distributions in the effluent of an RF argon APPJ: effect of gas flow rate and substrate, New J. Phys., 2014, 16, 123011. 41 E. Riordan, N. Minogue, D. Healy, P. O’Driscol and J. R. Sodeau, Spectroscopic and Optimization Modeling Study of Nitrous Acid in Aqueous Solution, J. Phys. Chem. A, 2005, 109, 779–786.
42 D. Vione, M. Minella, V. Maurino and C. Minero, Indirect
Photochemistry in Sunlit Surface Waters: Photoinduced Production of Reactive Transient Species, Chem. - Eur. J., 2014, 20, 10590–10606.
43 S. Ben-Amor, A. Devin, M. Rigoulet, N. Sojic and S. Arbault, Oxygen Plasma Treatment of Platinized Ultramicroelectrodes Increases Sensitivity for Hydrogen Peroxide Detection on Mitochondria, Electroanalysis, 2013, 25, 656–663.
44 S. Ben-Amor, Thesis, Université Bordeaux 1, 2013.
45 C. Amatore, S. Arbault, C. Bouton, K. Coffi, J.-C. Drapier, H. Ghandour and Y. Tong, Monitoring in Real Time with a Microelectrode the Release of Reactive Oxygen and Nitrogen Species by a Single Macrophage Stimulated by its Membrane Mechanical Depolarization, ChemBioChem, 2006, 7, 653–661. 46 S. Ben-Amor, E. Vanhove, F. Sékli Belaïdi, S. Charlot, D. Colin, M.
Rigoulet, A. Devin, N. Sojic, J. Launay, P. Temple-Boyer and S. Arbault, Enhanced Detection of Hydrogen Peroxide with Platinized Microelectrode Arrays for Analyses of Mitochondria Activities,
Electrochimica Acta, 2014, 126, 171–178.
47 L. Chauvet, Thèse, Université de Toulouse, Université Toulouse III-Paul Sabatier, 2016.
48 Q. Xiong, A. Y. Nikiforov, X. P. Lu and C. Leys, High-speed dispersed photographing of an open-air argon plasma plume by a grating–ICCD camera system, J. Phys. Appl. Phys., 2010, 43, 415201.
49 K. Gazeli, P. Svarnas, B. Held, L. Marlin and F. Clément, Possibility of controlling the chemical pattern of He and Ar “guided streamers” by means of N 2 or O 2 additives, J. Appl. Phys., 2015, 117, 093302.
50 K. Gazeli, C. Noël, F. Clément, C. Daugé, P. Svarnas and T. Belmonte, A study of helium atmospheric-pressure guided streamers for potential biological applications, Plasma Sources Sci.
Technol., 2013, 22, 025020.
51 K. Gazeli, L. Doanh, B. Held and F. Clément, Electrical, Thermal and Optical Parametric Study of Guided Ionization Waves Produced with a Compact μs-Pulsed DBD-Based Reactor, Plasma, 2017, 1, 3.
52 J. W. McConkey, C. P. Malone, P. V. Johnson, C. Winstead, V. McKoy and I. Kanik, Electron impact dissociation of oxygen-containing molecules–A critical review, Phys. Rep., 2008, 466, 1– 103.
53 P. Bruggeman and D. C. Schram, On OH production in water containing atmospheric pressure plasmas, Plasma Sources Sci.
Technol., 2010, 19, 045025.
54 S. Kanazawa, H. Kawano, S. Watanabe, T. Furuki, S. Akamine, R. Ichiki, T. Ohkubo, M. Kocik and J. Mizeraczyk, Observation of OH radicals produced by pulsed discharges on the surface of a liquid,
Plasma Sources Sci. Technol., 2011, 20, 034010.
55 P. J. Bruggeman, N. Sadeghi, D. C. Schram and V. Linss, Gas temperature determination from rotational lines in non-equilibrium plasmas: a review, Plasma Sources Sci. Technol., 2014,
23, 023001.
56 R. P. Cardoso, T. Belmonte, P. Keravec, F. Kosior and G. Henrion, Influence of impurities on the temperature of an atmospheric helium plasma in microwave resonant cavity, J. Phys. Appl. Phys., 2007, 40, 1394–1400.
57 Y. Sakiyama, D. B. Graves, H.-W. Chang, T. Shimizu and G. E. Morfill, Plasma chemistry model of surface microdischarge in humid air and dynamics of reactive neutral species, J. Phys. Appl.
Phys., 2012, 45, 425201.
58 W. Tian and M. J. Kushner, Atmospheric pressure dielectric barrier discharges interacting with liquid covered tissue, J. Phys.
59 Z. Zhang, Z. Xu, C. Cheng, J. Wei, Y. Lan, G. Ni, Q. Sun, S. Qian, H. Zhang, W. Xia, J. Shen, Y. Meng and P. K. Chu, Bactericidal Effects of Plasma Induced Reactive Species in Dielectric Barrier Gas– Liquid Discharge, Plasma Chem. Plasma Process., 2017, 37, 415– 431.
60 H. Tresp, M. U. Hammer, J. Winter, K.-D. Weltmann and S. Reuter, Quantitative detection of plasma-generated radicals in liquids by electron paramagnetic resonance spectroscopy, J. Phys.
Appl. Phys., 2013, 46, 435401.
61 S. Pfeiffer, A. C. Gorren, K. Schmidt, E. R. Werner, B. Hansert, D. S. Bohle and B. Mayer, Metabolic fate of peroxynitrite in aqueous solution Reaction with nitric oxide and pH-dependent decomposition to nitrite and oxygen in a 2: 1 stoichiometry, J. Biol.
Chem., 1997, 272, 3465–3470.
62 C. Molina, R. Kissner and W. H. Koppenol, Decomposition kinetics of peroxynitrite: influence of pH and buffer, Dalton Trans., 2013, 42, 9898.
63 R. M. Uppu, G. L. Squadrito and W. A. Pryor, Acceleration of peroxynitrite oxidations by carbon dioxide, Arch. Biochem.
Biophys., 1996, 327, 335–343.
64 R. Kissner and W. H. Koppenol, Product Distribution of Peroxynitrite Decay as a Function of pH, Temperature, and Concentration, J. Am. Chem. Soc., 2002, 124, 234–239.