HAL Id: hal-01964942
https://hal.archives-ouvertes.fr/hal-01964942v2
Submitted on 4 Feb 2019
HAL is a multi-disciplinary open access
archive for the deposit and dissemination of
sci-entific research documents, whether they are
pub-lished or not. The documents may come from
L’archive ouverte pluridisciplinaire HAL, est
destinée au dépôt et à la diffusion de documents
scientifiques de niveau recherche, publiés ou non,
émanant des établissements d’enseignement et de
Reduction of recruitment costs in preclinical AD trials.
Validation of automatic pre-screening algorithm for
brain amyloidosis
Manon Ansart, Stéphane Epelbaum, Geoffroy Gagliardi, Olivier Colliot,
Didier Dormont, Bruno Dubois, Harald Hampel, Stanley Durrleman
To cite this version:
Manon Ansart, Stéphane Epelbaum, Geoffroy Gagliardi, Olivier Colliot, Didier Dormont, et al..
Re-duction of recruitment costs in preclinical AD trials. Validation of automatic pre-screening
algo-rithm for brain amyloidosis. Statistical Methods in Medical Research, SAGE Publications, 2019,
pp.096228021882303. �10.1177/0962280218823036�. �hal-01964942v2�
Reduction of recruitment costs in preclinical AD
trials. Validation of automatic pre-screening
algorithm for brain amyloidosis.
Manon Ansart1,2, Stéphane Epelbaum1,2,3, Geoffroy Gagliardi1,3, Olivier
Colliot1,2,3,4, Didier Dormont1,2,4, Bruno Dubois1,3, Harald Hampel5,6,1,3 and
Stanley Durrleman2,1, and for the Alzheimer’s Disease Neuroimaging
Initiative* and the INSIGHT-preAD study
1 Institut du Cerveau et de la Moelle épinière, ICM, Inserm, U 1127, CNRS, UMR
7225, Sorbonne Université, F-75013, Paris, France
2
Inria, Aramis project-team, F-75013, Paris, France
3
Institute of Memory and Alzheimer’s Disease (IM2A), Department of Neurology, Pitié-Salpêtrière Hospital, AP-HP, Boulevard de l’hôpital, F-75013, Paris, France
4 AP-HP, Pitié-Salpêtrière hospital, Department of Neuroradiology, Paris, France 5
AXA Research Fund & Sorbonne University Chair, Paris, France
6 Sorbonne University, GRC no 21, Alzheimer Precision Medicine (APM), AP-HP,
Pitié-Salpêtrière Hospital, Boulevard de l’hôpital, F-75013, Paris, France
Abstract. We propose a method for recruiting asymptomatic Amyloid positive individuals in clinical trials, using a two-step process. We first select during a pre-screening phase a subset of individuals which are more likely to be amyloid positive based on the automatic analysis of data acquired during routine clinical practice, before doing a confirmatory PET-scan to these selected individuals only. This method leads to an increased number of recruitments and to a reduced number of PET-scans, resulting in a decrease in overall recruitment costs. We validate our method on 3 different cohorts, and consider 5 different classification algorithms for the pre-screening phase. We show that the best results are obtained using solely cognitive, genetic and socio-demographic features, as the slight increased performance when using MRI or longitudinal data is balanced by the cost increase they induce. We show that the proposed method generalizes well when tested on an independent cohort, and that the characteristics of the selected set of individuals are identical to the characteristics of a population selected in a standard way. The proposed approach shows how Machine Learning can be used effectively in practice to optimize recruitment costs in clinical trials.
Keywords: pre-screening for clinical trials, recruitment costs, amyloidosis, Alzheimer’s disease, classification, longitudinal data, Random Forest
1
Introduction
1.1 Background
Amyloid plaques, together with neurofibrillary tangles, are one of the earliest signs of Alzheimer’s disease (AD), appearing before any cognitive impairment and change in brain structure [14, 27]. They are thought to play an important role in the disease, by triggering a cascade of events leading to neuronal loss and cognitive impairment [21, 23, 22]. This Amyloid cascade hypothesis has been very influential in therapeutic research, as it is hopped that stopping the formation of the plaques will stop the cascade and hence the progression of the disease. Several molecules have been designed to target these plaques, by preventing the forma-tion of the beta-amyloid (Aβ) peptides, by clearing them or by stopping them from aggregating to form Amyloid plaques [30]. Several of these drugs, such as solanezumab [13] and bapineuzumab [38], have been tested on individuals with dementia or with mild cognitive impairments, but did not result in a decrease of the cognitive decline. The focus of clinical trials is therefore now shifting to-wards pre-clinical and prodromal individuals, as in the A4 study (trial identifier: NCT02008357) and the clinical trial for CNP520 (identifier: NCT03131453). The Amyloid cascade is thought to be a long, progressive process. Slowing down the formation of Amyloid plaques at the beginning of the process, when individu-als are not yet cognitively impaired, should have effects on the long run [13, 7], whereas on symptomatic individuals cognitive damage has already occurred and might not be reversed.
Setting up clinical trials targeting asymptomatic individuals with amyloid plaques can however lead to important recruitment costs than can be prohibitive, as it is necessary to ensure that all enrolled individuals have amyloidosis [36, 44]. The presence of amyloid plaques on the brain can be measured using Positron emission tomography (PET), or by measuring the concentration of Aβ protein in the cerebral spinal fluid (CSF). PET scans are very costly (around 1 000e in Europe, and 5 000$ in the United-States) and require the injection of a radioac-tive compound, and CSF measurements require a lumbar puncture, which is an invasive procedure that cannot be considered for systematic screening. When recruiting amyloid positive (Aβ+) individuals in a cohort of individuals with dementia, doing a PET scan to every possible individual can be a reasonable solution, as 90% are expected to be Aβ+ [9]. However, in an elderly asymp-tomatic population, only one third of the individuals are Aβ+ [9].This implies that in order to recruit a given number of Aβ+ individuals, three times as many individuals should be tested for amyloid positivity. Therefore, doing a PET scan to every recruited individual does not seem to represent a feasible solution for the large-scale recruitment of asymptomatic amyloid positive individuals [45].
We propose a method for recruiting asymptomatic Aβ+ individuals for clin-ical trials, which is composed of two steps, as presented in Figure 1. In a pre-screening phase, we first identify a subpopulation with a higher prevalence of Aβ+ individuals than in the original cohort, before doing a PET scan to this sub-population only in a second phase. In order to identify individuals with a
higher risk of being Aβ+, we propose to use a classifier that has been optimized to minimize the recruitment cost.
1.2 Related works
Several methods have been proposed to automatically predict the amyloid status of Cognitively Normal (CN) individuals based on cognitive and socio-demographic information. Mielke et al [32] use a logistic regression with a default threshold value, and evaluate their method by training and testing the algorithm on the same individuals. Insel et al [26] use a Random Forest and optimize the threshold by maximizing the Positive Predictive Value (PPV) of the algorithm. Maximizing this value implies having a very high threshold value, hence being very selective and increasing the number of false negatives. A very large number of individuals then has to be recruited as input, as many positive individuals are discarded.
Other methods focus on MRI features, such as Tosun et al [43] who pre-dict amyloidosis in subjects with a Mild Cognitive Impairment (MCI) using an advanced anatomical shape variation measure. Apostolova et al [4] also include MRI features by using hippocampus volume and cognitive, APOE and periph-eral blood protein information on MCI subjects using an SVM. Ten Kate et al [42] use an SVM and tree-based feature selection to predict amyloidosis in CN and MCI subjects using cognitive, socio-demographic, APOE and MRI features. In this paper, we propose to take a cost-effective approach of the amyloidosis prediction, by comparing different methods in terms of cost reduction.
Another approach for reducing clinical trial costs consists in adapting clinical trial design using previous results. Several studies propose to assess treatment efficacy in a retrospective manner, using drug trial cohorts to identify a subgroup of patients responding to treatment [16, 37, 48]. On the other hand, other studies propose to do so in a prospective manner, adapting the clinical trial as it is ongoing, by using more advanced methods such as active learning [33, 39].
1.3 Contributions
Selecting amyloid positive subjects for cohort recruitment requires to find a balance between being very selective, hence discarding a large number of positive individuals on one hand, or being too permissive and doing unnecessary PET scans on the other hand. We propose to take this trade-off into account by optimizing the algorithm for the recruitment cost, which includes both the cost of recruiting a number R of individuals and the cost of doing a confirmatory PET scan to a number S of selected individuals. As R depends on the number of False Negative and S on the number of False Positive, both of these measures are taken into account when the cost is minimized.
In this study, we extend and evaluate more in depth the approach we proposed in 2017[3]. We will compare the performance obtained using different features sets, containing cognitive and imaging features at baseline or over a longitudinal follow-up, and compare performance for a variety of classification algorithms. All the algorithms will be cross-validated to maximize the area under the receiver
Fig. 1: Selecting Aβ+ individuals: current (left) and proposed (right) process
operating characteristic (ROC) curve (AUC), and the threshold will be chosen to minimize the cost. We will validate our method on three different data sets, corresponding to different disease stages (pre-clinical or prodromal) or recruiting procedures. The performance will be assessed using two different validation pro-cedures: by using cross-validation on each cohort ; and by training the algorithm on a first cohort and testing it on a different one. We will then verify that the cohorts created with our method are unbiased, and can be used as inputs for clinical trials.
2
Materials and Methods
2.1 Cohorts
We are interested in studying the performance of our method on different groups of individuals. To do so, we test the method on three cohorts, noted ADNI-MCI, ADNI-CN and INSIGHT.
The ADNI-MCI cohort contains MCI subjects from the Alzheimer’s Disease Neuroimaging Initiative (ADNI) study. It is an ongoing, longitudinal, multicenter American study carried out in North America, which provides biomarkers, imag-ing, cognitive and genetic data, for the early detection of AD. It started in 2004 with ADNI1, and two more phases are now available: ADNIGO and ADNI2. A diagnosis is given at each visit, among CN (Cognitively Normal), MCI or AD. MCI subjects have a Subjective Memory Concern (SMC) and an objective memory loss measured by education adjusted scores on Wechsler Memory Scale Logical Memory II, but don’t have any impairment in the other cognitive do-mains, especially in activities of daily living. We only consider visits that have an associated Aβ level, measured with the AV45 PET SUVr (Standardized Uptake Value Ratio) when available, or with the CSF biomarker when no PET scan was performed. individuals that changed Amyloid status during the study are removed. We use the first available visit for each individuals, and a visit at a 12
months interval when studying the impact of longitudinal data. 596 individuals are available in this cohort, among which 62.9% are Aβ+.
The ADNI-CN cohort contains CN subjects from the ADNI study. These individuals are cognitively normal, they show no sign of dementia or of cognitive impairment, but they can have a SMC. individuals and visits are selected and Aβ values are taken as in the ADNI-MCI cohorts. 431 individuals are available, among which 37.6% are Aβ+.
The INSIGHT cohort contains individuals from the INSIGHT-preAD study. It is an ongoing, longitudinal, mono-centric French study carried out in Paris, France, which aims at studying changes appearing in healthy individuals, over 70 years of age in order to study the very early phases of AD. 318 CN individuals, with normal cognition and memory but who have a SMC, are followed. Cognitive, imaging and genetic data is available for every annual visit. The AV45 PET SUVr is available for every individual and used as the Aβ value. At the time of the analysis, only the first visit is available for each individual. 27.7% of the 318 individuals are Aβ+ (n=88).
2.2 Input Features
Different sets of features are compared. For all experiments, socio-demographic features (age, gender, education) and APOE4 are used.
As cognitive assessments are different in ADNI and the INSIGHT-preAD study, different cognitive features are used. For the two ADNI cohorts, the Alzheimer’s Disease Assessment Scale - cognitive subscale (ADAS-cog) is used. The 13 items are aggregated into 4 categories: memory, language, concentra-tion and praxis. For the INSIGHT cohort, the 112 available features, coming from SMC questionnaires and cognitive tests are used. They target executive functions, behavior and overall cognitive skills.
MRI extracted features are also used in order to evaluate their predictive power. The cortical thicknesses are extracted using FreeSurfer for both ADNI and INSIGHT subjects. The average thicknesses of 72 cortical regions are used, and divided by the total cortical thickness in order to get comparable measures across individuals. The hippocampus volume is extracted using FreeSurfer for the ADNI cohorts, and using SACHA [10], an in-house hippocampus segmentation software, for the INSIGHT-preAD study.
The amyloidosis is measured using a PET scan when available and CSF measurments elsewise. The PET SUVr given by the ADNI and INSIGHT-preAD studies are extracted using different methods. A individual is considered Aβ+ when PET SUVr is above 1.1 [11] for ADNI and 0.79 for the INSIGHT-preAD study, or when the concentration of Aβ in the CSF is below 192 pgml[40].
2.3 Algorithms
Different classification algorithms are used to make the prediction and their performances are compared for the different cohorts, in order to identify an
algorithm that would outperform the others. The hyperparameters of all the algorithms are tuned using a cross-validation.
5 algorithms are compared: (1) A Random Forest [8], with validation of the number and the depth of the trees, (2) A logistic regression [20], with validation of the threshold, (3) a linear Support Vector Machine [34] (SVM), with validation of the penalty parameter, (4) an adaptive logistic regression [19] (AdaLogReg), with validation of the learning rate and the number and depth of the learners, (5) an adaptive boosting [18](AdaBoost), with validation of the same hyperpa-rameters as for AdaLogReg.
The performance of the algorithms is evaluated using repeated random sub-sampling validation: the data is repeatedly (50 times) separated into a training set (drawn without replacement) and a test set (corresponding to the data points not used in the training set). We use 70% of the data for training and 30% for testing. For each split, the algorithms are first tuned using a 5-fold validation on the training set to maximize the AUC, then trained on the whole training set with the selected hyperparameters, and applied on the test set in order to get a performance measure. 50 performance measures are therefore obtained, and are used to get a mean performance and a standard deviation. The whole procedure is described in pseudocode in the Supplementary Materials (Algorithm 1). 2.4 Performance Measures
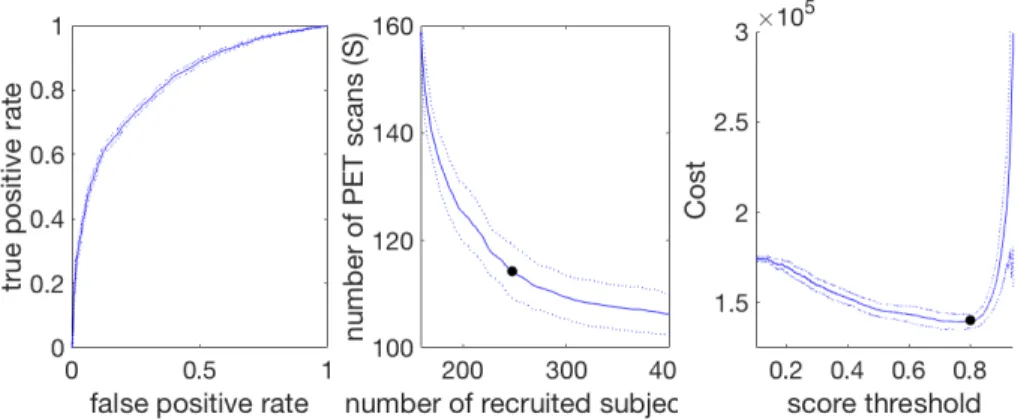
Fig. 2: Example of ROC curve (left), S vs R curve (middle) and corresponding cost curve (right). The solid curve represents the mean performance, the dotted ones represent the standard deviation and the 2 black dots the points of minimal cost
Different performance measures are used in order to evaluate different aspects of the methods.
The area under the Receiver Operating Characteristic (ROC) curve (AUC) is used to evaluate the performance of the prediction method. It is used to
compare different algorithms, to tune them, and to evaluate the predictive power of different feature sets.
The minimal cost of recruiting 100 individuals is used to measure the practi-cal effect of the method, and to find a balance between the number of recruited individuals and the number of PET scans. In order to compute this minimal cost, the ROC curve is built by changing the algorithm threshold (Fig 2, left). For each point on the ROC curve, the corresponding number of individuals to be re-cruited (R) and the number PET scans (S) is computed (Fig 2, middle) as such :
S = 100 ∗ TP + FP
TP (1) R = 100 ∗
N
TP (2)
where TP stands for number of True Positive, FP for number of False Positive and N is the total number of predictions that have been made. As the true pos-itive rate (TPR) and false pospos-itive rate (FPR) depend on the number of True Positive and False Positive which are used to compute S and R, there is a direct match between each point of the ROC curve and the R vs S curve. Consequently, as for the FPR and TPR, R and S should be minimized together and a trade-off has to be made, which is reflected in the total cost.
For each value of S and R, the corresponding cost can be computed, by mak-ing the hypothesis that recruitmak-ing a individual and gettmak-ing genetic information and cognitive assessments costs 100e, doing an MRI 400e and doing a PET scan 1000e. When the cost curve (Fig 2, right) is built, the minimum is taken to get the minimal cost of recruiting 100 individuals, and the corresponding optimal values of S and R are hence known.
It is to be noted that the cost of recruiting 100 individuals in a cohort will depend on the proportion of amyloid positive individuals in the cohort, as the more positive individuals there are, the easier it is. This performance measure is hence useful to evaluate and compare the performance of different methods on one cohort, but it cannot be used to compare the performance of a method across different cohorts.
Statistical testing Each experiment is performed 50 times with 50 train/test split, and 50 performance measures are obtained. When we compare two exper-iments, a two-tailed t-test is performed using the 50 performance measures of each experiment. A p-value is obtained, enabling us to test if the performance of the two experiments is significantly different at the 0.05 level.
3
Results
3.1 Algorithm and feature choice
Algorithm choice In order to choose the algorithm most suited for this prob-lem, different classification algorithms are tested on the three data sets. Their performance, measured using the AUC, is reported in Table 1. These results show that there is no algorithm that outperforms all the others for all cohorts. It is however necessary to make a choice and use the same algorithm on all cohorts. The Random Forest is, for all data sets, among the best performing algorithms.
Data set Random Forest
Logistic
regression SVM AdaLogReg AdaBoost
INSIGHT 67.5 (5.5) 62.7 (6.1) * 62.0 (5.8) * 67.5 (5.7) 67.2 (6.9) ADNI-CN 69.1 (4.0) 69.5 (4.1) 67.3 (5.0) 66.4 (4.6) * 66.5 (5.1) ADNI-MCI 82.4 (2.8) 81.9 (2.6) 81.8 (2.7) 80.9 (2.8) 80.5 (3.3) *
Table 1: Benchmark of algorithms. * = statistically significantly different from the Random Forest at the 0.05 level after Bonferroni correction for multiple com-parisons. Data are: average Area Under the ROC curve (standard deviation). SVM = support vector machine; AdaLogReg = adaptive logistic regression; Ad-aBoost = adaptive boosting; ROC = receiver operating characteristic.
It outperforms each other algorithm in one cohort: the Logistic Regresion in INSIGHT (p = 0.001), the SVM in INSIGHT (p=0.0001), the adaptive logisitic regression in ADNI-CN (p=0.03) and AdaBoost in ADNI-MCI (p=0.045). No al-gorithm significantly outperforms it on any cohort. The Random Forest therefore represent the best algorithm for this classification task.
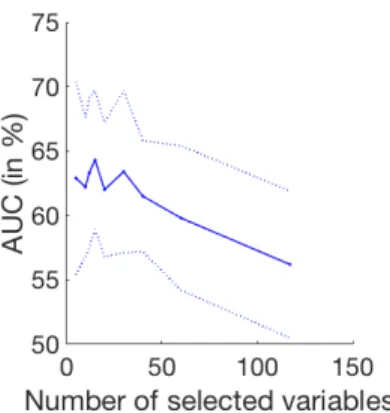
Fig. 3: Performance variations depending on the number of kept LASSO vari-ables: mean Area Under the ROC curve (plain line) and standard deviation (dashed lines)
Feature selection for cognitive variables In the INSIGHT cohort 112 cogni-tive features are available. Using all of them results in an AUC of 56.2% (±7.5), which is significantly lower than the performance obtained on the other cohorts because of a less favorable ratio between number of features and individuals, as only 318 individuals are available. We therefore compare different dimension reduction and feature selection methods in order to solve this issue and improve the performance on this cohort.
Automatic methods Principal Component Analysis (PCA) and Independent Component Analysis (ICA) using fastICA[25] are first considered, but both lead to an AUC under 52%, whatever the number of selected dimensions.
LASSO feature selection is also considered. In the LASSO, a regularized regression using a l1 penalty is used, setting some of the feature weights to 0,
hence keeping only the most relevant features. A linear regression using LASSO is performed between the input features and the amyloid status in order to select from 5 up to 60 features. The selected features are then used to perform the classification, using a Random Forest. The evolution of the AUC with the number of selected features is presented in Fig. 3, showing that the best results are obtained using 15 features. Using the LASSO features selection leads to an AUC of 64.3% (±5.2), which is significantly better than the performance obtained using all features (p<0.0001).
Using expert knowledge In a last analysis, manual feature engineering is con-sidered. Aggregates are formed for each cognitive test, using expert knowledge regarding the tests and the features which are most relevant for AD diagnosis. 26 aggregates are hence built. Using them as input in place of the 112 original cognitive features leads to an AUC of 67.5% (±5.5), which is significantly better (p<0.005) than the performance obtained using automatic dimension reduction.
Use of MRI We want to assess the prediction power of MRI-extracted features (cortical thicknesses and hippocampus volume) and compare it with the per-formance obtained using cognitive features. In all experiments, APOE genotype and socio-demographic features are also used as inputs.
We first compared the performance obtained by using only cognitive features on one hand, and only MRI features on the other. As the number of MRI features is large regarding the number of subject, a LASSO feature selection if performed to select 12 variables. The results are presented on lines 1 and 2 of Table 2. Using MRI features instead of cognitive scores leads to a significant decrease in the AUC for all cohorts (p < 0.001). These results show that the used cognitive features are a better predictor of amyloidosis than the chosen set of MRI features. Although they are less predictive than cognitive scores, using the MRI fea-tures as input along with cognitive scores could lead to better performance. We therefore train the algorithm using both MRI and cognitive features and com-pare its performance with the ones obtained using solely cognitive scores. The results, presented in line 1 and 3 of Table 2, show that including MRI features in the inputs does not lead to a significant increase in the AUC. For the INSIGHT and ADNI-MCI cohorts, it does lead to non-significant increase in the AUC, but the resulting cost for recruiting 100 individuals is higher (for INSIGHT, 527,437 e ±36,332, instead of 291,325e ±57,400), as the cost of doing an MRI to each recruited individual has to be added to the initial cost. For ADNI-CN including MRI features in the input leads to a significant decrease in the AUC (p < 0.01). In all the cohorts, including MRI features leads to an increase in cost.
INSIGHT cohort ADNI-CN cohort ADNI-MCI cohort
Proposed approach 67.5 (5.5) 69.1 (4.0) 82.4 (2.8)
MRI features only 61.9 (6.5) 59.0 (4.6) 80.1 (3.0)
MRI & cognitive features 68.8 (4.4) 67.1 (3.8) 82.8 (2.2)
With longitudinal variations NA 71.7 (8.3) 87.7 (4.8)
After correction for age 68.5 (5.0) 67.7 (3.9) 80.9 (2.4)
APOE only 63.7 (4.6) 62.1 (3.5) 75.1 (2.9)
Table 2: Results in different experimental conditions. Data are: average percent-age of Area Under the ROC Curve (standard deviation). NA = Not Applicable
3.2 Use of longitudinal measurements
Longitudinal measurements are available for individuals in the two ADNI co-horts. In order to evaluate the impact of using longitudinal measurements in amyloidosis prediction, the rate of change of the cognitive scores, computed us-ing a 12-month visit, are included in the input features. The results, presented in line 4 of Table 2, show that the AUC is significantly better than the one obtained using only socio-demographic information, APOE and cognitive scores at baseline, ADNI-MCI (p<0.0001), and not significantly better for ADNI-CN (p = 0.06). Using longitudinal information overall leads to a better prediction.
However the cost of collecting such measurements has to be taken into ac-count, since all individuals have to undergo cognitive assessments twice. Setting the cost of cognitive assessments for the second visit to 50e for each individual, the total cost of recruiting 100 individuals using longitudinal information is of 243,448e (± 104,597) for ADNI-CN and 133,452e (± 22,140) for ADNI-MCI. This new cost is slightly lower than the one obtained using cross-sectional mea-surements in ADNI-CN (234,591 ± 23,106) and higher for ADNI-MCI (136,205 ± 3678). Therefore, although using longitudinal measurements leads to an in-crease in AUC, it does not lead to a dein-crease in recruitment cost.
3.3 Proposed method performance
Cost reduction Table 3 presents the cost of recruiting 100 Aβ+ individuals in the different cohorts with the proposed method, as well as an estimation of the costs of recruiting these individuals with the current method, consisting in scanning all potential individuals. This estimated current cost depends on the proportion of Aβ+ in the data set. In order to find 100 Aβ+ individuals in the INSIGHT cohort for example, 100/0.277 = 361 individuals on average should be recruited and undergo a PET scan, which corresponds to a total cost of 397,111e. However, with the proposed method, about 832 individuals should be recruited and 208 PET scans would have to be done, leading to a cost of 291,325e on average for recruiting 100 Aβ+ individuals. The resulting savings would reach 106,174e for this cohort.
Current
method Proposed method
Dataset Estimated current cost ine % of AUC (std) Individuals to be recruited Number needed to scan New cost in e (std) Estimated savings ine INSIGHT (27.7% Aβ+) 397,111 (N=361) 67.5 (5.5) 832 208 291,325 (57,400) 106,174 ADNI-CN (37.6% Aβ+) 292,553 (N=266) 69.1 (4.0) 599 175 234,591 (23,106) 58,063 ADNI-MCI (62.9% Aβ+) 174,880 (N=159) 83.8 (2.1) 264 112 138,294 (4857) 36586
Table 3: Comparison of the proposed method results with the estimated initial costs for recruiting K=100 amyloid positive individuals. AUC = Area Under the ROC curve; std = standard deviation.
The results presented in Table 3 show that the proposed method leads to a significant cost reduction when recruiting 100 individuals for all cohorts (p<0.001), representing estimated savings of about 20%.
Age difference between groups In the cohorts we used, the Aβ+ individuals are older than the Aβ- individuals, especially in the ADNI cohorts (see Table S1 in Supplementary Materials). One can therefore ask if the predictor is using this age difference, by simply predicting that older individuals are Aβ+ and younger individuals are Aβ-, or by predicting the age of the individuals rather than their amyloid status. To confirm that it is not the case, we correct all the cognitive variables for age by using a linear regression and remove the age from the input features. After correction (results shown in line 5 of Table 2), the prediction performance is not impacted in INSIGHT and does not decrease significantly for ADNI-CN (p>0.05). In the ADNI-MCI cohort, correcting for age leads to a significant decrease in AUC (p<0.01) but results in a recruitment cost that is still significantly higher than doing a PET scan for all individuals (p<0.01). These results show that the prediction algorithm does not rely on the age difference between the groups and captures differences between amyloid positive and negative individuals that is not due to aging.
Training on a cohort and testing on a different one The previous results are obtained by training and testing the method on distinct individuals from the same cohort. We want to confirm that these results would generalize well in a different setting, by verifying that they hold when the method is trained on a first cohort and tested on a different one.
ADNI and INSIGHT-preAD are very different studies. They have been de-signed for different purposes, as INSIGHT aims at studying very early phases of AD by studying changes appearing in healthy individuals, and ADNI aims at defining the progression of Alzheimer’s disease. The INSIGHT and
ADNI-Data set AUC in %
Trained and tested on INSIGHT 61.9 (6.5)
Trained on ADNI-CN, tested on INSIGHT 62.0 (6.6)
Trained on ADNI-CN, tested on INSIGHT (all samples) 66.1 (3.6)
Trained and tested on [INSIGHT ADNI-CN] 61.3 (6.9)
Trained and tested on [INSIGHT ADNI-CN] (all samples) 67.5 (3.2)
Table 4: Results using MRI variables, socio-demographic and genetic information on different data sets. Data are: average Area Under the ROC curve in % (std)
CN cohorts both include individuals who show no sign of dementia but with different inclusion criteria, and hippocampal measures have been extracted us-ing different softwares. Hence, although these 2 cohorts can be compared, they are very different by design and purpose. In an ideal setup, cognitive features, socio-demographic information and APOE should be used as input, however the cognitive assessments are different for ADNI and the INSIGHT-preAD study, hence they can’t be used as inputs when using these two cohorts.
We therefore train the prediction algorithm on ADNI-CN using socio-demographic information, APOE and MRI features. We then test on INSIGHT the method trained on ADNI-CN in order to evaluate the generalization performance of our method. As the number of MRI features is large, LASSO feature selection was performed to select 12 MRI features. In order to have a fair comparison with training and testing on INSIGHT, the size of the selected training and test size are kept the same as the training and test set coming from INSIGHT. We there-fore randomly select 318 ∗ 0.7 = 223 from the ADNI-CN cohort to form the training set, and 318 ∗ 0.3 = 95 from INSIGHT to form the test set. This opera-tion, followed by the classificaopera-tion, is performed 50 times in order to get a mean performance and a standard deviation.
The results, presented in Table 4, show that training on ADNI-CN and testing on INSIGHT gives similar performances to training and testing on the INSIGHT cohort.
Representativity of the selected population For the selected individuals to be used as a clinical trial cohort, it is important to ensure that the selected population will be representative of the whole population of Aβ+ individuals that could have been selected. We therefore compare the individuals selected using the prediction method followed by a confirmatory PET scan with the Aβ+ individuals of the cohort.
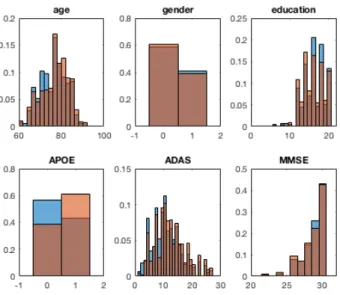
We first pool together the test data set of the 50 cross-validation runs and look at the distribution of age, ADAS (for ADNI cohorts), MMSE, education, age and gender. The histograms obtained for ADNI-CN are presented in figure 4. We can see that these histogram are very similar for age, gender, education, and cognitive features, but the proportion of APOE4 carriers is higher in the group selected with the proposed method. Similar observations can be made for all cohorts.
Fig. 4: Histogram of the different features for the selected group (orange) and for the whole Aβ+ group (blue), for the ADNI-CN cohort
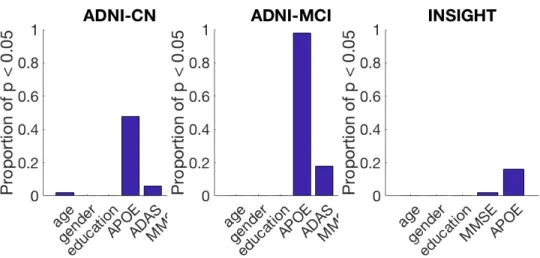
In order to evaluate if there is a significant difference for each of these features, we compare the selected populations of the 50 runs with the populations of Aβ+ individuals of the corresponding test sets. A statistical test is performed for each of the 50 runs and a p-value is obtained for each of them. The used statistical test is a t-test for the features with a normal distribution (age and ADAS), a binomial proportion test for binary features (presence of APOE4 alleles and gender) and a Mann–Whitney U test for the remaining features (MMSE and education). A p-value is obtained for each run, for each feature. Figure 5 presents the proportion of these p-value that are below 0.05, for each feature.
The main bias that can be seen across cohorts is a higher proportion of APOE4 carriers, which is statistically significant in 16% of cases for INSIGHT, 48% for ADNI-CN and 98% for ADNI-MCI. Although this bias is important, especially for the ADNI cohorts, it seems acceptable as many current recruiting procedures also have this bias or only recruit APOE4 carriers, such as in the Alzheimer’s Prevention Initiative Generation study [31].
The proposed method leads to an unbiased cohort in terms of age, gender, and education, as well as cognitive scores in more than 94% of cases for the asymptomatic cohorts, and 82% for ADNI-MCI.
3.4 Building larger cohorts
Pooling data sets Different cohorts can be pooled in order to create a big-ger data set, containing a large number of individuals. However, this operation
Fig. 5: Proportion of runs with a significant difference between the groups for each feature, in each of the 3 cohorts
requires that the heterogeneity of the pooled cohort does not alter the perfor-mances of the method that is applied. In order to verify this hypothesis, we pool the ADNI-CN cohort with the INSIGHT cohort. We train and test the method on individuals coming from both of this cohort, using the same training and test size as in INSIGHT, in order to compare the performances with the one obtained by training and testing solely on INSIGHT. As in the generalization experiment, we use MRI features instead of cognitive features which are different in the 2 cohorts. The results, presented in Table 4 show that the performances are not significantly different when the algorithm is trained and tested on the pooled cohort, which shows that the heterogeneity of pooled data sets does not alter the classification performances.
Effect of sample size When learning on ADNI-CN and testing on INSIGHT to test generalization, we used the same training and learning size as in INSIGHT to have a fair comparison, hence using only 52% of the available data at each run. For the same reason, we used only 42% of the created cohort when we pooled the INSIGHT and the ADNI-CN cohort. We now want to measure the impact of increasing the cohort size by using the full cohort in each case, always keeping the same ratio for the size of the training and test data sets (70%-30%). The results, presented in Table 4 show that increasing the cohort size significantly increases the performances (p<0.0005). This result comforts the need to create large data sets, or pool existing ones, to create more accurate prediction tools.
4
Discussion
4.1 Results of the experiments
Algorithm and feature choice The algorithm benchmark shows there is not one outstanding algorithm that would outperform all the others on all data sets. These findings support the "No free lunch" theorem[47, 46], stating that different algorithms perform best on different problems. As a choice had to be made, we used the Random Forest which performed well on the 3 cohorts. It is not however a general recommendation. When working on a new classification problem, even similar to this one, one should always compare different algorithms to choose the most suited one.
Because the number of features is large compared to the number of available subjects, using all the available features may result in a low performance[24]. The low performance we obtained on the INSIGHT cohort using all the available cognitive features is an illustration of this phenomenon, known as the curse of dimensionality. A typical way of solving this issue is using automatic methods for dimension reduction. We showed that, in our case, selecting features using expert knowledge gives better results. It corroborates the fact that when a large number of features and a small data set are available, feature engineering using domain knowledge is necessary[12].
Hypothetical models of AD suggest neurodegeneration and changes in struc-tural MRI appear earlier than cognitive decline[27]. This hypothesis is supported by findings from Bateman et al. [6], showing that, in autosomal dominant AD, brain atrophy occurs 15 years before AD diagnosis, 5 years before episodic mem-ory decline and 10 years before changes in other cognitive domains. Studies by Ameiva et al. show changes in several domain of cognition can be observed 9 years before diagnosis[1], and up to 16 years before diagnosis for individuals with higher education[2]. Overall, brain atrophy may appear before or at about the same time as cognitive decline, and one could expect using MRI would improve the prediction of amyloidosis, especially for cognitively normal individuals. Our analysis however suggests that it is not the case. This finding that clinical signs can allow for efficient pre-screening goes against the current purely biological definition of AD by NIA-AA[28]. We can suppose memory decline has already started for individuals with a SMC, so that cognitive features are already slightly altered. It leads us to think that subtle cognitive changes appear in late preclin-ical AD, as hypothesized by Sperling et al. in their 3 stage model of pre-clinpreclin-ical AD[41]. The results can however depend on the choice of MRI features. In future studies, different neuroimaging features could be used to test this hypothesis that cognitive changes are anterior to substantial structural changes, in line with pre-vious studies on optimal neuroimaging feature selection in pre-clinical AD[29]. Alternatively, a more advanced feature selection algorithm might be able to iden-tify the most informative MRI features and therefore improve their performance, as proposed in other methods [42].
In the ADNI-CN cohort, adding the MRI features even leads to a decrease in AUC, whereas it leads to a slight increase for INSIGHT. A possible explanation
for this difference between cohorts is that in ADNI, the number of cognitive features (4) is low compared to the number of MRI features (73), whereas the difference is smaller for INSIGHT (26 cognitive features for the same number of MRI features). In ADNI the cognitive scores can therefore be under-represented compared to the MRI features. This effect should be handled by the Random Forest, that can give different weights to different features. It however requires the number of individuals to be large enough compared to the number of features, which is not the case here.
Overall, we showed that with our method the best results are obtained with-out performing an MRI and withwith-out longitudinal features, but using only data that can be easily acquired. MRI should not be performed in the pre-screening phase, however performing an MRI at the end of the recruitment process will always be needed to exclude vascular lesions or tumors and as a reference for adverse event monitoring.
Method performance We showed that using the proposed method as a pre-screening phase for individual recruitment in clinical trials leads to reducing the recruitment cost by about 20%. These findings are however based on cost hypothesis that can seem arbitrary. In particular, the cost of recruiting a new subject is the same whatever the number of subjects that have been recruited. In practice, because a large number of studies intend to recruit large numbers of subjects, the more subjects are recruited, the more difficult it is to recruit a new one. Having a non-constant cost could therefore represent an improvement of the proposed method and be closer to the difficulties encountered in practice. We can expect the method to generalize well and give similar results when applied on any cohort of cognitively normal individuals because we showed we obtain similar performances when training and testing on the same cohort or on two different ones. The cohorts we used for testing are slightly unbalanced, with Aβ+ individuals older than Aβ- individuals, but correcting for age gives similar cost reductions, so the same results should be obtained on cohorts that do not have the same unbalance. Comparing the selected Aβ+ individuals with all the Aβ+ individuals of the cohort shows that the subset selected with the proposed method is unbiased. The proposed method therefore leads to the recruitment of a representative cohort with a reduced cost.
The proposed approach is time efficient, as in the worst case the training phase may take few minutes, while testing a new subject could be done in less than a second. Therefore, computational time is not a limiting factor for using such methods in practice. Furthermore, since only clinical data may be used for good performance, the method could be easily deployed in the current clinical practice.
Data set size Table 4 shows that pooling data sets does not alter the perfor-mance of the prediction, although it brings heterogeneity; and that increasing the cohort size improves the prediction. This last finding is supported by the cur-rent machine learning literature, stating that gathering more data often yields
an increase in performance greater than the increase one could obtain by im-proving the prediction algorithm[12]. It shows the importance of gathering more data in the medical field and more specifically related to dementia. While the largest cohorts widely available usually include less than 1500 subjects, creating larger cohorts could result in a significant increase of performance for predicting amyloidosis or for other predictive task, such as automatic diagnosis based on neuroimages[17, 5]. As long as larger cohorts are not available, we recommend pooling different cohorts in order to get a better prediction performance. For ex-ample, the preclinical cohorts presented by Epelbaum et al[15] could be pooled to create a bigger cohort to train and validate our method.
4.2 Comparison with existing methods
Univariate approaches A standard approach for prediction is using univariate methods. As a comparison with our method, a Random Forest is trained and tested on each input variable separately. The best univariate results are obtained using APOE (Table 2, line 4). The AUC obtained using APOE is significantly lower (p<0.0001) than the AUC of the proposed multivariate method, for all cohorts, with an AUC of 63.7 ±4.6 instead of 67.5 ±5.5 for INSIGHT for example. The proposed method therefore outperforms its univariate equivalent.
Other multivariate approaches We wanted to compare the performance of our method with that of other similar studies. Different cohorts and different per-formance measures have been used in these studies, the comparison is therefore not straightforward and the results should be interpreted with caution.
In the study of Mielke et al [32] the studied cohort is composed of CN indi-viduals from the Mayo Clinic Study of Aging. This cohort is comparable with the ADNI-CN cohort used in this work, as individuals from both cohorts are CN, and the ratio of Aβ+ individuals is close (34.9% in the Mayo Clinic Study of Aging cohort, 37.6% in ADNI-CN). A logistic regression is used with an a priori set and non-optimized threshold, and the performance measures were obtained by training and testing the algorithm on the same individuals. The resulting AUC, of 0.71, is significantly better than the AUC we obtain on ADNI-CN (69.1, p<0.05), which is expected as training and testing an algorithm on the same individuals generally gives better results than testing it on a different set of individuals.
The cohort used by Insel et al [26] contains CN individuals, with a proportion of positive individuals of 40.8%, so the closest cohort is again ADNI-CN. The AUC is not provided in the study, so it cannot be used for comparison. The Pos-itive Prediction Rate (PPR) and Negative Prediction Rate (NPR) are however given and, as shown in Supplementary Materials, they can be used to compute S and R. The normalized cost can therefore be computed, and is significantly lower (p < 0.0001) with our method.
The AUC we obtain on the MCI cohort is comparable to the ones obtained in other studies or slightly higher[43, 4, 42]. Ten Kate et al [42] obtain a slightly
better AUC for the prediction in CN subjects. This difference might be explained by the use of a different feature selection method.
5
Conclusion
We proposed a method for creating cohorts of Aβ+ individuals with a reduced recruitment cost. In a pre-screening phase, we use a classifier to identify a sub-population of individuals who are more likely to be amyloid positive, based on clinical data. We then do a confirmatory PET scan to the individuals of this subpopulation only. The whole algorithm has been optimized so as to minimize the cost of the cohort recruitment. As such automatic methods are today lim-ited by the number of subjects, future studies could be performed on a Phase 3 clinical trial cohort, as such cohorts often include more than 1000 participants. New screening technologies, such as blood-based biomarkers[40, 35], could trans-form the recruitment process for clinical trials, which could also be facilitated by web-based cognition evaluation systems, such as the Brain Health Registry (trial identifier: NCT02402426).
Acknowledgements
This work has been partly funded by the European Research Council under grant agreement No678304, European Union’s Horizon 2020 research and innovation program under grant agreement No666992. This manuscript benefited from the support of the Program “PHOENIX” led by the Sorbonne University Foundation and sponsored by la Fondation pour la Recherche sur Alzheimer. HH is supported by the AXA Research Fund, the “Fondation partenariale Sorbonne Université” and the “Fondation pour la Recherche sur Alzheimer”, Paris, France. The research leading to these results has received funding from the program “Investissements d’avenir” ANR-10-IAIHU-06 (Agence Nationale de la Recherche-10-IA Agence Institut Hospitalo-Universitaire-6). OC is supported by a "contrat d’interface local" from AP-HP.
The INSIGHT-preAD study was promoted by INSERM in collaboration with ICM, IHU-A-ICM and Pfizer and has received support within the "Investisse-ment d’Avenir" (ANR-10-AIHU-06) program. The INSIGHT-preAD study was realized in collaboration with the "CHU de Bordeaux" (coordination CIC EC7), the promoter of Memento cohort, funded by the Foundation Plan-Alzheimer. The study was further supported by AVID/Lilly *Data used in preparation of this article were obtained from the Alzheimer’s Disease Neuroimaging Ini-tiative (ADNI) database (adni.loni.usc.edu). As such, the investigators within the ADNI contributed to the design and implementation of ADNI and/or pro-vided data but did not participate in analysis or writing of this report. A com-plete listing of ADNI investigators can be found at: http://adni.loni.usc.edu/wp-content/uploads/how_to_apply/ADNI_Acknowledgement_List.pdf
References
1. Hélène Amieva, Hélène Jacqmin-Gadda, Jean-Marc Orgogozo, Nicolas Le Carret, Catherine Helmer, Luc Letenneur, Pascale Barberger-Gateau, Colette Fabrigoule, and Jean-François Dartigues. The 9 year cognitive decline before dementia of the Alzheimer type: a prospective population-based study. Brain, 128(5):1093–1101, May 2005.
2. Hélène Amieva, Hind Mokri, Mélanie Le Goff, Céline Meillon, Hélène Jacqmin-Gadda, Alexandra Foubert-Samier, Marc Orgogozo, Yaakov Stern, and Jean-François Dartigues. Compensatory mechanisms in higher-educated subjects with Alzheimer’s disease: a study of 20 years of cognitive decline. Brain, 137(4):1167– 1175, April 2014.
3. Manon Ansart, Stéphane Epelbaum, Geoffroy Gagliardi, Olivier Colliot, Didier Dormont, Bruno Dubois, Harald Hampel, Stanley Durrleman, et al. Prediction of amyloidosis from neuropsychological and mri data for cost effective inclusion of pre-symptomatic subjects in clinical trials. In Deep Learning in Medical Image Analysis and Multimodal Learning for Clinical Decision Support, pages 357–364. Springer, 2017.
4. Liana G. Apostolova, Kristy S. Hwang, David Avila, David Elashoff, Omid Kohan-nim, Edmond Teng, Sophie Sokolow, Clifford R. Jack, William J. Jagust, Leslie Shaw, John Q. Trojanowski, Michael W. Weiner, and Paul M. Thompson. Brain amyloidosis ascertainment from cognitive, imaging, and peripheral blood protein measures. Neurology, 84(7):729–737, February 2015.
5. Mohammad R. Arbabshirani, Sergey Plis, Jing Sui, and Vince D. Calhoun. Sin-gle subject prediction of brain disorders in neuroimaging: Promises and pitfalls. NeuroImage, 145:137–165, 2017.
6. Randall J. Bateman, Chengjie Xiong, Tammie L.S. Benzinger, Anne M. Fagan, Al-ison Goate, Nick C. Fox, Daniel S. Marcus, Nigel J. Cairns, Xianyun Xie, Tyler M. Blazey, David M. Holtzman, Anna Santacruz, Virginia Buckles, Angela Oliver, Krista Moulder, Paul S. Aisen, Bernardino Ghetti, William E. Klunk, Eric McDade, Ralph N. Martins, Colin L. Masters, Richard Mayeux, John M. Ringman, Martin N. Rossor, Peter R. Schofield, Reisa A. Sperling, Stephen Salloway, and John C. Mor-ris. Clinical and Biomarker Changes in Dominantly Inherited Alzheimer’s Disease. New England Journal of Medicine, 367(9):795–804, 2012.
7. Robert E. Becker and Nigel H. Greig. A New Regulatory Road-Map for Alzheimer’s Disease Drug Development. Current Alzheimer research, 11(3):215–220, 2014. 8. L. Breiman. Random forests. Machine learning, 45(1):5–32, 2001.
9. G. Chetelat, R. La Joie, N. Villain, A. Perrotin, V. de La Sayette, F. Eustache, and R. Vandenberghe. Amyloid imaging in cognitively normal individuals, at-risk populations and preclinical alzheimer’s disease. Neuroimage Clin, 2:356–365, 2013. 10. M. Chupin, A. Hammers, R. S. N. Liu, O. Colliot, J. Burdett, E. Bardinet, J. S. Duncan, L. Garnero, and L. Lemieux. Automatic segmentation of the hippocampus and the amygdala driven by hybrid constraints: method and validation. NeuroIm-age, 46(3):749–761, 2009.
11. Christopher M Clark, Michael J Pontecorvo, Thomas G Beach, Barry J Bedell, R Edward Coleman, P Murali Doraiswamy, Adam S Fleisher, Eric M Reiman, Marwan N Sabbagh, Carl H Sadowsky, Julie A Schneider, Anupa Arora, Alan P Carpenter, Matthew L Flitter, Abhinay D Joshi, Michael J Krautkramer, Ming Lu, Mark A Mintun, and Daniel M Skovronsky. Cerebral PET with florbetapir com-pared with neuropathology at autopsy for detection of neuritic amyloid-β plaques: a prospective cohort study. The Lancet Neurology, 11(8):669–678, 2012.
12. Pedro Domingos. A few useful things to know about machine learning. Commu-nications of the ACM, 55(10):78, 2012.
13. R. S. Doody, R. G. Thomas, M. Farlow, T. Iwatsubo, B. Vellas, S. Joffe, K. Kieburtz, R. Raman, X. Sun, P. S. Aisen, E. Siemers, H. Liu-Seifert, and R. Mohs. Phase 3 trials of solanezumab for mild-to-moderate alzheimer’s disease. New England Journal of Medicine, 370(4):311–321, 2014.
14. B. Dubois, H. Hampel, H. H. Feldman, P. Scheltens, P. Aisen, S. Andrieu, H. Bakardjian, H. Benali, L. Bertram, K. Blennow, K. Broich, E. Cavedo, S. Crutch, J.F. Dartigues, C. Duyckaerts, S. Epelbaum, G. B. Frisoni, S. Gauthier, R. Gen-thon, and A. A. Gouw et al. Preclinical Alzheimer’s disease: Definition, natural history, and diagnostic criteria. Alzheimer’s & Dementia, 12(3):292–323, 2016. 15. Stéphane Epelbaum, Rémy Genthon, Enrica Cavedo, Marie Odile Habert, Foudil
Lamari, Geoffroy Gagliardi, Simone Lista, Marc Teichmann, Hovagim Bakardjian, Harald Hampel, and Bruno Dubois. Preclinical Alzheimer’s disease: A system-atic review of the cohorts underlying the concept. Alzheimer’s & Dementia: The Journal of the Alzheimer’s Association, 13(4):454–467, 2017.
16. Jared C. Foster, Jeremy M.G. Taylor, and Stephen J. Ruberg. Subgroup identifica-tion from randomized clinical trial data. Statistics in Medicine, 30(24):2867–2880, October 2011.
17. Katja Franke, Gabriel Ziegler, Stefan Klöppel, and Christian Gaser. Estimating the age of healthy subjects from T1-weighted MRI scans using kernel methods: Exploring the influence of various parameters. NeuroImage, 50(3):883–892, 2010. 18. J. Friedman. Greedy function approximation: A gradient boosting machine. The
Annals of Statistics, 29(5):1189–1232, 2001.
19. J. Friedman, T. Hastie, and R. Tibshirani. Additive logistic regression: a statistical view of boosting. The annals of statistics, 28(2):337–407, 2000.
20. J. Friedman, T. Hastie, and R. Tibshirani. Regularization paths for generalized linear models via coordinate descent. Journal of statistical software, 33(1):1, 2010. 21. J. A. Hardy and G. A. Higgins. Alzheimer’s disease: the amyloid cascade
hypoth-esis. Science, 256(5054):184–185, 1992.
22. John Hardy and David Allsop. Amyloid deposition as the central event in the aetiology of Alzheimer’s disease. Trends in Pharmacological Sciences, 12:383–388, 1991.
23. John Hardy and Dennis J. Selkoe. The Amyloid Hypothesis of Alzheimer’s Disease: Progress and Problems on the Road to Therapeutics. Science, 297(5580):353–356, 2002.
24. G. Hughes. On the mean accuracy of statistical pattern recognizers. IEEE Trans-actions on Information Theory, 14(1):55–63, 1968.
25. A. Hyvarinen. Fast and robust fixed-point algorithms for independent component analysis. IEEE Transactions on Neural Networks, 10(3):626–634, 1999.
26. P. S. Insel, S. Palmqvist, R. S. Mackin, R. L. Nosheny, O. Hansson, M. W. Weiner, and N. Mattsson. Assessing risk for preclinical β-amyloid pathology with APOE, cognitive, and demographic information. Alzheimer’s & Dementia: Diagnosis, As-sessment & Disease Monitoring, 4:76–84, 2016.
27. C. R Jack, D. S Knopman, W. J Jagust, L. M Shaw, P. S Aisen, M. W Weiner, R. C Petersen, and J. Q Trojanowski. Hypothetical model of dynamic biomarkers of the alzheimer’s pathological cascade. Lancet Neurology, 9(1):119, 2010. 28. Clifford R. Jack, David A. Bennett, Kaj Blennow, Maria C. Carrillo, Billy Dunn,
Samantha Budd Haeberlein, David M. Holtzman, William Jagust, Frank Jessen, Jason Karlawish, Enchi Liu, Jose Luis Molinuevo, Thomas Montine, Creighton
Phelps, Katherine P. Rankin, Christopher C. Rowe, Philip Scheltens, Eric Siemers, Heather M. Snyder, Reisa Sperling, Cerise Elliott, Eliezer Masliah, Laurie Ryan, and Nina Silverberg. NIA-AA Research Framework: Toward a biological definition of Alzheimer’s disease. Alzheimer’s & Dementia, 14(4):535–562, April 2018. 29. Clifford R. Jack, Heather J. Wiste, Stephen D. Weigand, David S.
Knop-man, Michelle M. Mielke, Prashanthi Vemuri, Val Lowe, Matthew L. Senjem, Jeffrey L. Gunter, Denise Reyes, Mary M. Machulda, Rosebud Roberts, and Ronald C. Petersen. Different definitions of neurodegeneration produce similar amyloid/neurodegeneration biomarker group findings. Brain, 138(12):3747–3759, December 2015.
30. Eric Karran, Marc Mercken, and Bart De Strooper. The amyloid cascade hy-pothesis for Alzheimer’s disease: an appraisal for the development of therapeutics. Nature Reviews Drug Discovery, 10(9):698–712, 2011.
31. C Lopez Lopez, A Caputo, F Liu, ME Riviere, ML Rouzade-Dominguez, RG Thomas, JB Langbaum, R Lenz, EM Reiman, A Graf, et al. The alzheimer’s prevention initiative generation program: Evaluating cnp520 efficacy in the pre-vention of alzheimer’s disease. The journal of prepre-vention of Alzheimer’s disease, 4(4):242–246, 2017.
32. M. M. Mielke, H. J. Wiste, S. D. Weigand, D. S. Knopman, V. J. Lowe, R. O. Roberts, Y. E. Geda, Dana M. Swenson-Dravis, B. F. Boeve, M. L. Senjem, P. Ve-muri, R. C. Petersen, and C. R. Jack. Indicators of amyloid burden in a population-based study of cognitively normal elderly. Neurology, 79(15):1570–1577, 2012. 33. Stanislav Minsker, Ying-Qi Zhao, and Guang Cheng. Active Clinical Trials for
Per-sonalized Medicine. Journal of the American Statistical Association, 111(514):875– 887, April 2016.
34. K. R. Muller, S. Mika, G. Ratsch, K. Tsuda, and B. Scholkopf. An introduc-tion to kernel-based learning algorithms. IEEE Transacintroduc-tions on Neural Networks, 12(2):181–201, 2001.
35. Akinori Nakamura, Naoki Kaneko, Victor L. Villemagne, Takashi Kato, James Doecke, Vincent Doré, Chris Fowler, Qiao-Xin Li, Ralph Martins, Christopher Rowe, Taisuke Tomita, Katsumi Matsuzaki, Kenji Ishii, Kazunari Ishii, Yu-taka Arahata, Shinichi Iwamoto, Kengo Ito, Koichi Tanaka, Colin L. Masters, and Katsuhiko Yanagisawa. High performance plasma amyloid-β biomarkers for Alzheimer’s disease. Nature, 554(7691):249–254, February 2018.
36. J. T. O’Brien and K. Herholz. Amyloid imaging for dementia in clinical practice. BMC Medicine, 13, 2015.
37. Min Qian and Susan A. Murphy. Performance guarantees for individualized treat-ment rules. The Annals of Statistics, 39(2):1180–1210, April 2011.
38. Stephen Salloway, Reisa Sperling, Nick C. Fox, Kaj Blennow, William Klunk, Mur-ray Raskind, Marwan Sabbagh, Lawrence S. Honig, Anton P. Porsteinsson, Steven Ferris, Marcel Reichert, Nzeera Ketter, Bijan Nejadnik, Volkmar Guenzler, Maja Miloslavsky, Daniel Wang, Yuan Lu, Julia Lull, Iulia Cristina Tudor, Enchi Liu, Michael Grundman, Eric Yuen, Ronald Black, and H. Robert Brashear. Two Phase 3 Trials of Bapineuzumab in Mild-to-Moderate Alzheimer’s Disease. New England Journal of Medicine, 370(4):322–333, 2014.
39. Andrew Satlin, Jinping Wang, Veronika Logovinsky, Scott Berry, Chad Swanson, Shobha Dhadda, and Donald A. Berry. Design of a Bayesian adaptive phase 2 proof-of-concept trial for BAN2401, a putative disease-modifying monoclonal antibody for the treatment of Alzheimer’s disease. Alzheimer’s & Dementia: Translational Research & Clinical Interventions, 2(1):1–12, January 2016.
40. Leslie M. Shaw, Hugo Vanderstichele, Malgorzata Knapik-Czajka, Christopher M. Clark, Paul S. Aisen, Ronald C. Petersen, Kaj Blennow, Holly Soares, Adam Simon, Piotr Lewczuk, Robert Dean, Eric Siemers, William Potter, Virginia M.-Y. Lee, and John Q. Trojanowski. Cerebrospinal Fluid Biomarker Signature in Alzheimer’s Disease Neuroimaging Initiative Subjects. Annals of neurology, 65(4):403–413, 2009.
41. Reisa A. Sperling, Paul S. Aisen, Laurel A. Beckett, David A. Bennett, Suzanne Craft, Anne M. Fagan, Takeshi Iwatsubo, Clifford R. Jack, Jeffrey Kaye, Thomas J. Montine, Denise C. Park, Eric M. Reiman, Christopher C. Rowe, Eric Siemers, Yaakov Stern, Kristine Yaffe, Maria C. Carrillo, Bill Thies, Marcelle Morrison-Bogorad, Molly V. Wagster, and Creighton H. Phelps. Toward defining the pre-clinical stages of Alzheimer’s disease: Recommendations from the National Insti-tute on Aging-Alzheimer’s Association workgroups on diagnostic guidelines for Alzheimer’s disease. Alzheimer’s & dementia : the journal of the Alzheimer’s As-sociation, 7(3):280–292, May 2011.
42. Mara ten Kate, Alberto Redolfi, Enrico Peira, Isabelle Bos, Stephanie J. Vos, Rik Vandenberghe, Silvy Gabel, Jolien Schaeverbeke, Philip Scheltens, Olivier Blin, Jill C. Richardson, Regis Bordet, Anders Wallin, Carl Eckerstrom, José Luis Molinuevo, Sebastiaan Engelborghs, Christine Van Broeckhoven, Pablo Martinez-Lage, Julius Popp, Magdalini Tsolaki, Frans R. J. Verhey, Alison L. Baird, Cristina Legido-Quigley, Lars Bertram, Valerija Dobricic, Henrik Zetterberg, Simon Love-stone, Johannes Streffer, Silvia Bianchetti, Gerald P. Novak, Jerome Revillard, Mark F. Gordon, Zhiyong Xie, Viktor Wottschel, Giovanni Frisoni, Pieter Jelle Visser, and Frederik Barkhof. MRI predictors of amyloid pathology: results from the EMIF-AD Multimodal Biomarker Discovery study. Alzheimer’s Research & Therapy, 10(1):100, September 2018.
43. Duygu Tosun, Sarang Joshi, and Michael W. Weiner. Neuroimaging Predictors of Brain Amyloidosis in Mild Cognitive Impairment. Annals of neurology, 74(2):188– 198, August 2013.
44. Jennifer L. Watson, Laurie Ryan, Nina Silverberg, Vicky Cahan, and Marie A. Bernard. Obstacles And Opportunities In Alzheimer’s Clinical Trial Recruitment. Health affairs (Project Hope), 33(4):574–579, 2014.
45. Michael M. Witte, Norman L. Foster, Adam S. Fleisher, Monique M. Williams, Kimberly Quaid, Michael Wasserman, Gail Hunt, J. Scott Roberts, Gil D. Ra-binovici, James L. Levenson, Ann Marie Hake, Craig A. Hunter, Luann E. Van Campen, Michael J. Pontecorvo, Helen M. Hochstetler, Linda B. Tabas, and Paula T. Trzepacz. Clinical use of amyloid-positron emission tomography neu-roimaging: Practical and bioethical considerations. Alzheimer’s & Dementia: Di-agnosis, Assessment & Disease Monitoring, 1(3):358–367, 2015.
46. David H. Wolpert. The Supervised Learning No-Free-Lunch Theorems. In Ra-jkumar Roy, Mario Köppen, Seppo Ovaska, Takeshi Furuhashi, and Frank Hoff-mann, editors, Soft Computing and Industry, pages 25–42. Springer London, Lon-don, 2002.
47. David H Wolpert and William G Macready. No Free Lunch Theorems for Op-timization. IEEE TRANSACTIONS ON EVOLUTIONARY COMPUTATION, 1(1):16, 1997.
48. Yingqi Zhao, Donglin Zeng, A. John Rush, and Michael R. Kosorok. Estimating Individualized Treatment Rules Using Outcome Weighted Learning. Journal of the American Statistical Association, 107(499):1106–1118, September 2012.
A
Supplementary Materials
A.1 Computing R and S from the PPV and NPR
The number of False Positives (FP) can be computed from the Positive Predicted Value (PPV) and the number of True Positives (TP) as such:
P P V = T P F P + T P T P = P P V ∗ F P + P P V ∗ T P
F P = 1 − P P V
P P V T P (3)
In a similar manner, the number of False Negatives (FN) can be computed from the Negative Predicted Value (NPV) and the number of True Negatives (TN):
T N = N P V
1 − N P V ∗ F N (4)
We know that, NP being the number of positive subjects in the test set,
F N = N P − T P (5)
And, N being the total number of subjects in the test set:
F P + F N + T P + T N = N (6) Using equations 3 to 6, we can deduce
T P = (N (1 − N P V ) − N P ) P P V 1 − N P V − P P V And S and R and be computed using equations 1 and 2.
A.2 Difference of age in the 3 cohorts
Age average for Aβ-individuals (std)
Age average for Aβ+
individuals (std) p-value
INSIGHT 75.7 (3.5) 76.8 (3.4) 0.01
ADNI-CN 74.4 (6.5) 76.2 (6.1) 0.005
ADNI-MCI 72.0 (8.5) 74.7 (6.9) < 0.001
Table S1: Age comparison between Aβ- and Aβ+ individuals for the different cohorts. std = standard deviation.
Algorithm 1 Pseudocode of the method
Input: x and y
Output: probs: probability of each subject to be Aβ+; auc: the obtained AUC; min_cost: minimal cost for recruiting the subjects; optimal_threshold: probability threshold for which the minimal cost is obtained
for i = 1 to 50 do
. Randomly split into training and test set, with 30% in test set x_train, y_train, x_test, y_test ← split(x, y, 0.3)
. Hyper-parameter tuning using the AUC
splits_x, splits_y ← split_in_5(x_train, y_train) for num_fold = 1 to 5 do
. Get the corresponding folds for training and testing
x_test_f old, y_test_f old ← splits_x[num_f old], splits_y[num_f old] x_train_f old ← all_f olds_except_i(splits_x, num_f old)
y_train_f old ← all_f olds_except_i(splits_y, num_f old) for i_size = 1 to number_leaf_sizes do
for i_cycles = 1 to number_num_cycles do . Train and predict with the selected parameters
rf ← f it_rf (x_train_f old, y_train_f old, leaf _sizes[i_size], num_cycles[i_cycles]) probs ← get_rf _score(rf, x_test_f old)
. Compute the corresponding AUC auc ← get_auc(probs, y_test_f old) aucs_table.insert(auc)
end for end for end for
. Average the AUC for each parameters over all folds mean_aucs ← average_over_f olds(aucs_table)
. Select the parameter values corresponding to the best AUC i_best_size, i_best_num_cycles ← argmax(mean_aucs)
leaf _size, num_cycle ← leaf _sizes[i_best_size], num_cycles[i_best_num_cycles] . Train and apply the model with the selected hyper-parameters
rf ← train_rf (x_train, y_train, leaf _size, num_cycles) probs ← get_rf _score(rf, x_test)
auc ← get_auc(probs, y_test) . Get the threshold for minimal cost
sen_table, spe_table, thresholds_table ← get_all_sensitivities_specif icities(probs, y_test) costs_table ← all_possible_costs(sen_table, spe_table)
min_cost ← min(costs_table) i_min ← argmin(costs_table)
optimal_threshold ← thresholds_table[i_min] end for