HAL Id: hal-00302356
https://hal.archives-ouvertes.fr/hal-00302356
Submitted on 12 Dec 2006HAL is a multi-disciplinary open access
archive for the deposit and dissemination of sci-entific research documents, whether they are pub-lished or not. The documents may come from teaching and research institutions in France or abroad, or from public or private research centers.
L’archive ouverte pluridisciplinaire HAL, est destinée au dépôt et à la diffusion de documents scientifiques de niveau recherche, publiés ou non, émanant des établissements d’enseignement et de recherche français ou étrangers, des laboratoires publics ou privés.
Observations of total peroxy nitrates and aldehydes:
measurement interpretation and inference of OH radical
concentrations
P. A. Cleary, P. J. Wooldridge, D. B. Millet, R. C. Cohen, M. Mckay, A. H.
Goldstein
To cite this version:
P. A. Cleary, P. J. Wooldridge, D. B. Millet, R. C. Cohen, M. Mckay, et al.. Observations of total peroxy nitrates and aldehydes: measurement interpretation and inference of OH radical concentrations. Atmospheric Chemistry and Physics Discussions, European Geosciences Union, 2006, 6 (6), pp.12929-12965. �hal-00302356�
ACPD
6, 12929–12965, 2006
Observations of total peroxy nitrates and
aldehydes P. A. Cleary et al. Title Page Abstract Introduction Conclusions References Tables Figures ◭ ◮ ◭ ◮ Back Close
Full Screen / Esc
Printer-friendly Version
Interactive Discussion
EGU
Atmos. Chem. Phys. Discuss., 6, 12929–12965, 2006 www.atmos-chem-phys-discuss.net/6/12929/2006/ © Author(s) 2006. This work is licensed
under a Creative Commons License.
Atmospheric Chemistry and Physics Discussions
Observations of total peroxy nitrates and
aldehydes: measurement interpretation
and inference of OH radical
concentrations
P. A. Cleary1,*, P. J. Wooldridge1, D. B. Millet2,**, R. C. Cohen2, M. McKay2,4, and A. H. Goldstein1,3,4
1
Dept. of Chemistry, University of California, Berkeley, Berkeley, CA 94720, USA
2
Dept. of Environmental Science, Policy and Management, University of California, Berkeley, Berkeley, CA 94720, USA
3
Dept. of Earth and Planetary Science, Univ. of California, Berkeley, Berkeley, CA 94720, USA
4
Environment Technologies Division, Lawrence Berkeley National Laboratory, Berkeley, CA 94720, USA
*
now at: Department of Chemistry, University of Pennsylvania, 231 S. 34th St, Philadelphia, PA 19104, USA
**
now at: Department of Earth and Planetary Sciences, Harvard University, Cambridge, MA 02138, USA
Received: 30 October 2006 – Accepted: 30 November 2006 – Published: 12 December 2006 Correspondence to: R. C. Cohen ([email protected])
ACPD
6, 12929–12965, 2006
Observations of total peroxy nitrates and
aldehydes P. A. Cleary et al. Title Page Abstract Introduction Conclusions References Tables Figures ◭ ◮ ◭ ◮ Back Close
Full Screen / Esc
Printer-friendly Version
Interactive Discussion
EGU
Abstract
We describe measurements of total peroxy nitrates (ΣPNs), NO2, O3and several
alde-hydes at Granite Bay, California, during the Chemistry and Transport of the Sacramento Urban Plume (CATSUP) campaign, from 19 July–16 September 2001. We observed a strong photochemically driven variation of ΣPNs during the day with the median of
5
1.2 ppb at noon. Acetaldehyde, pentanal, hexanal and methacrolein had median abun-dances in the daytime of 1.2 ppb, 0.093 ppb, 0.14 ppb, and 0.27 ppb, respectively. We compare a steady state and a time dependent calculations of the dependence of ΣPNs on aldehydes, OH, NO and NO2 showing that the steady state calculations of are be
accurate to ±30% between 10:00 a.m. and 06:00. We use the steady state calculation
10
to investigate the composition of ΣPNs and the concentration of OH at Granite Bay. We find that PN molecules that have never been observed before make up an unreason-ably large fraction of the ΣPNs unless we assume that there exists a PAN source that is much larger than the acetaldehyde source. We calculate that OH at the site varied between 1 and 6×10⁶molecules cm−3 at noon during the 8 weeks of the experiment.
15
1 Introduction
Peroxyacyl nitrates (or peroxycarboxylic nitric anhydrides) are a class of atmospheric reactive nitrogen (NOy≡ NO + NO2 + peroxy nitrates + alkyl and multifunctional
ni-trates + HONO + HNO3 + NO3 + 2 × N2O5) produced by photochemical reactions of
aldehydes and photolysis of ketones, such as acetone and methyl glyoxal (Blitz et al.,
20
2004; Roberts et al., 2002; Romero et al., 2005). Peroxyacetyl nitrate, PAN, the most abundant and widely studied peroxyacyl nitrate, is produced through the reaction of acetaldehyde with OH, (R1) producing peroxyacyl radical (CH3C(O)O2, or PA) followed by the association of PA with NO2 (R2). Other sources of PA, such as methyl glyoxal
photolysis, may be important, especially where isoprene is the predominant reactive
25
ACPD
6, 12929–12965, 2006
Observations of total peroxy nitrates and
aldehydes P. A. Cleary et al. Title Page Abstract Introduction Conclusions References Tables Figures ◭ ◮ ◭ ◮ Back Close
Full Screen / Esc
Printer-friendly Version
Interactive Discussion
EGU
by the sequential processes of thermal decomposition to regenerate PA (R-2) followed by reaction of PA with NO (R3). acetaldehyde + OH(+O2) → PA + H2O (R1) PA + NO2→ PAN (R2) PAN → PA + NO2 (R-2) 5 PA + NO → products (R3) PAN + OH → products (R4)
The reaction of PAN with OH (R4) is slow Talukdar et al., 1995, however this sink of PNs may be important for other PN species, such as MPAN. Figure 1 summarizes the processes represented by (R1)–(R4). The thermal decomposition of PAN (R-2) has a
10
steep temperature dependence. PAN has a lifetime to thermal decomposition of hours or less in the lower troposphere (T>287 K) and of months in the mid- to high latitude free troposphere (Temp<263 K). PAN that is created in situ or transported to the upper troposphere from a source region near the surface can be transported globally Beine et al., 1996; Singh and Hanst, 1981. When the air containing PAN warms, NO2is
re-15
leased; thus PAN serves as a vehicle for global scale redistribution of NOx (NOx≡ NO
+ NO2). Peroxyacyl nitrates are also a well known component of urban
photochem-istry (Corsmeier et al., 2002b; Rappengluck et al., 2003; Singh, 1987; Stephens et al., 1956). PAN is often observed to be correlated with O3 (Corsmeier et al., 2002a;
Gaffney et al., 1999; Gaffney et al., 2002; Penkett and Brice, 1986; Rappengluck et al.,
20
2000; Rubio et al., 2004) and the ratios of different PANs have been used to assess the relative contributions of anthropogenic and biogenic sources of O3(Roberts et al.,
2001; Williams et al., 1997).
In addition to PAN, other peroxy nitrates are formed following OH-initiated hydro-gen abstraction of larger aldehydes. Simultaneous measurements of the ambient
ACPD
6, 12929–12965, 2006
Observations of total peroxy nitrates and
aldehydes P. A. Cleary et al. Title Page Abstract Introduction Conclusions References Tables Figures ◭ ◮ ◭ ◮ Back Close
Full Screen / Esc
Printer-friendly Version
Interactive Discussion
EGU
concentrations of the aldehyde – peroxyacyl nitrate pairs, propanal-peroxyproprionic nitric anhydride (PPN) (Roberts et al., 2001, 2003), acrolein-peroxyacrylic nitric an-hydride (APAN) (Roberts et al., 2003), and methacrolein-MPAN (Roberts et al., 2001, 2003) have been described. The peroxyacyl nitrates derived from isobutanal: perox-yisobutyric nitric anhydride (PiBN) (Roberts et al., 2002, 2003), n-butanal:
peroxy-n-5
butyric nitric anhydride (PnBN) (Gaffney et al., 1999; Glavas and Moschonas, 2001) and benzaldehyde: peroxybenzoic nitric anhydride (PBzN) (Atkinson and Lloyd, 1984) have also been identified in the atmosphere. Many other PN compounds have been observed in the laboratory (Hurst-Bowman et al., 2003; Noziere and Barnes, 1998; Sehested et al., 1998; Tyndall et al., 2001; Wallington et al., 1995) and based on
10
these laboratory and field measurements, it is reasonable to assume that virtually every aldehyde observed in the atmosphere should have a corresponding peroxya-cyl nitrate. Glavas and Moshonas (Glavas and Moschonas, 2001) have argued that the relative ratios of peroxy nitrates can be deduced from the ratios of parent alde-hydes. Roberts et al. (2001, 2003) use a sequential reaction model (Reactions 1–4
15
and their analogues as applied to each PN/aldehyde pair) to explain the correlations between the observed ratios of PPN/propanal, PAN/acetaldehyde, MPAN/methacrolein and APAN/acrolein (Roberts et al., 2001, 2003). In their analyses, Roberts et al. (2001, 2003) attribute the variability PN/aldehyde ratios to plume age and assume that the ob-servations represent oxidation of an isolated plume downwind of a localized source of
20
aldehydes. They show this model does a reasonable job at representing the correla-tions between different ratios of PN/aldehyde pairs.
In this paper, we describe simultaneous measurements of total peroxy nitrates (ΣPNs), aldehydes, NO2and O3at the eastern edge of the suburbs of Sacramento, CA
as a part of the CATSUP (Chemistry and Transport of the Sacramento Urban Plume)
25
experiment. We take a different point of view from the papers of Roberts et al. (2001, 2003) and assume that PNs in the urban boundary layer do not result from emission at a point source but rather are continually affected by emissions of their aldehyde pre-cursors. We compare time dependent and steady state calculations for PNs showing
ACPD
6, 12929–12965, 2006
Observations of total peroxy nitrates and
aldehydes P. A. Cleary et al. Title Page Abstract Introduction Conclusions References Tables Figures ◭ ◮ ◭ ◮ Back Close
Full Screen / Esc
Printer-friendly Version
Interactive Discussion
EGU
that PNs are in approximate steady state with their source molecules. We then use the steady state calculation to investigate the partitioning of ΣPNs among a variety of individual peroxy nitrates and to investigate the concentration of OH at the Granite Bay site.
2 Experimental
5
Observations of NO2, ΣPNs, total alkyl nitrates (ΣANs), HNO3, O3, VOC, and
mete-orological variables were collected from 19 July–16 September 2001 on the property of Eureka Union School District in Granite Bay, CA (38 E 44.23′ 121 E 12.01′, 277 m
above sea level). This site is located 30 km north-east of Sacramento, CA, at the east-ern edge of the suburban region and between two major highways: Interstate 80, 8 km
10
to the north and Highway 50, 13 km to the south. The instruments were housed in a temperature-controlled trailer with inlets mounted on a rooftop tower 7 m above the ground, (1–2 m above the trailer).The site and instruments are described in detail in Cleary et al. (Cleary et al., 2005) and only a brief description is included here.
Briefly, wind patterns observed at the site were quite regular, at speeds of 2–2.4 m/s
15
from the southwest (directly from Sacramento) during the afternoon (12:00–17:00 h) and from the southeast at 1.6 m/s (downslope from the Sierra Nevada) at night (20:00– 06:00 h). On most days, the wind direction rotated smoothly and continuously from southeasterlies to southwesterlies between the hours of 06:00–12:00 h and then ro-tated back between 17:00 and 20:00. On a typical day, the air parcels observed at
20
Granite Bay at noon had arrived at the Sacramento urban core from the South and then turned toward Granite Bay traveling over the entire length of the Sacramento metropolitan region. Temperatures (mean ±1σ) at Granite Bay during the campaign were 16 (±2.4) ◦C at 05:00 rising to 33 (±3.6) ◦C at 16:00. Skies were clear on all but two days of the campaign, as determined from observations of photosynthetically
25
active radiation. O3 was measured with a Dasibi 1008 ultraviolet photometric ozone analyzer.
ACPD
6, 12929–12965, 2006
Observations of total peroxy nitrates and
aldehydes P. A. Cleary et al. Title Page Abstract Introduction Conclusions References Tables Figures ◭ ◮ ◭ ◮ Back Close
Full Screen / Esc
Printer-friendly Version
Interactive Discussion
EGU
NO2, ΣPNs, ΣANs and HNO3 were measured using a two-channel
thermal-dissociation laser induced fluorescence (TD-LIF) instrument (Day et al., 2002). Briefly, an ambient sample flows rapidly through two ovens where dissociation of NOz (NOz
≡HNO3+ΣANs+ΣPNs) species to NO2occurs. Three different temperatures are used:
180◦C, 350◦C and 550◦C, to observe the three distinct classes of NOz: ΣPNs, ΣANs
5
and HNO3. The ΣPNs measurement includes PAN, PPN, MPAN, PiBN, PBN and any
other peroxy nitrate present in the atmosphere. N2O5 dissociates at this temperature; however, for the inlet configuration we used at Granite Bay, it is likely N2O5 was
con-verted to HNO3 on the inlet surfaces prior to the dissociation region. The NO2 signal
is the sum of the NO2contained in all compounds that dissociate at or below the oven
10
temperature, and the difference between the NO2observed in two separate channels
at adjacent temperature set points is associated with a specific class of compounds. For these measurements NO2was measured using a pulsed dye laser with time gated
detection (Thornton et al., 2000).
We measured NO2, ΣPNs, ΣANs, and HNO3by sequentially adjusting the
tempera-15
tures of each oven so the pair of ovens remained only one class of NOyspecies apart.
The measurements were made on a 4-h repeating cycle. Each time an oven set point was raised, it was pre-programmed to overshoot the set point for a few seconds in order to remove compounds adsorbed to the walls. ΣANs were measured for 75 min each cycle, ΣPNs and NO2for 40 min each cycle, and HNO3for 80 min each cycle, with the
20
remaining time used for measuring zeros, calibrating, and obtaining other diagnostics. During the last six days of the campaign, 11 September–16 September, ΣPNs and NO2were measured continuously.
The accuracy for each class of NOy compound is 15%. Comparison of LIF with
other NO2 measurements indicates the LIF measurements of NO2 are within 5% of
25
other NO2 measurements (Thornton et al., 2003). The NO2 signals observed by TD-LIF are adjusted to account for small (5%) effects of secondary chemistry within our inlet (Rosen et al., 2004). The most important effects are associated with reactions of RO2(e.g. PA) radicals and O3with NO. The extent of these interferences depends on
ACPD
6, 12929–12965, 2006
Observations of total peroxy nitrates and
aldehydes P. A. Cleary et al. Title Page Abstract Introduction Conclusions References Tables Figures ◭ ◮ ◭ ◮ Back Close
Full Screen / Esc
Printer-friendly Version
Interactive Discussion
EGU
the inlet configuration. Over the last few years, we have used 3 different configurations. The configuration used for the Granite Bay experiments was identical to that used in Houston (Rosen, 2004), except that the machined PFA Teflon inlet tip piece was re-placed with standard molded fittings for better HNO3 transmission. This inlet was a 2-channel version of the one described in detail by Day et al. (2002). A key feature
5
was the insertion of pressure-reducing orifices between the heated tubes and the 15 to 20 m long PFA Teflon tubes leading to the instrument housed at the base of the tower. Laboratory experiments confirm that interferences in this configuration are small and that our corrections accurately accounted for their effects. Comparison of ΣPNs to the sum of individual PAN compounds using this inlet and two other inlet configurations
10
during experiments in Houston, TX (Rosen, 2004), from the DC-8 aircraft, from the NCAR C-130 and at a surface site in Nova Scotia have shown that ΣPNs are usually within 15% of the sum of PAN, PPN and MPAN (Wooldridge et al., 20061). The largest differences we have ever observed, as much as 30% (ΣPNs >ΣPNi), were observed
when sampling ambient air during the PAN Intercomparison Experiment in Boulder, CO
15
during summer 2005. During this experiment agreement between ΣPN and specific PN measurements was within 10% for test samples of specific compounds including PAN and PPN (Tyndall et al., 2005). However, the poor agreement when sampling ambi-ent air was shown to result from a large interference in the ΣPN measuremambi-ents that was proportional to the product of NO with O3. Laboratory experiments confirm that
20
the configuration used for the PIE experiments, which omitted the pressure reduction orifices at the back of the heaters in order to keep the pressure at nearly ambient up to the expansion nozzles for the supersonic jets (based on the design outlined by Cleary et al., 2002), resulted in much higher interferences than other configurations because of the longer residence times and higher pressures within 20 m of tubing connecting
25
the heated inlet and the instrument. The inlet configuration used for the Granite Bay 1
Woolridge, P. J., Perring, A. E., and Cohen, R. C.:Total Peroxy Nitrates: the Thermal Dissociation-Laser Induced Fluorescence Technique and Comparisons to Speciated PAN Mea-surements, in preparation, 2006.
ACPD
6, 12929–12965, 2006
Observations of total peroxy nitrates and
aldehydes P. A. Cleary et al. Title Page Abstract Introduction Conclusions References Tables Figures ◭ ◮ ◭ ◮ Back Close
Full Screen / Esc
Printer-friendly Version
Interactive Discussion
EGU
experiments had a more rapid pressure drop and thus has much smaller interferences, ones that we believe are accurately accounted for in the analysis.
Most of the potential systematic error in the individual classes observed by TD-LIF are correlated, in the sense that if ΣPNs are too high by 5% then likely so are NO2,
ΣANs and HNO3. In contrast, ratios of the different classes will be more accurate
5
because these systematic effects will cancel.
We did not measure NO or NOydirectly. We calculate NO using the photostationary
state equation:
[NO]ss=
jNO2[NO2]
kNO+O3[O3] + kHO2+NO[HO2+ RO2]
(1)
Noontime HO2+RO2concentrations are calculated to be 0.050 ppb. The photolysis rate
10
of NO2 was estimated by scaling the J-values obtained from the TUV model (UCAR, 2002) for 11 August 2001, using total ozone column of 299 DU, as measured by TOMS (McPeters, 2001) to the observed PAR. ΣNOyiis calculated as the sum of NOss, NO2,
ΣPNs, ΣANs, and HNO3.
Volatile organic compounds, including aldehydes, were measured hourly with a fully
15
automated, in situ, two-channel gas chromatograph/mass selective detector/flame ion-ization detector (GC/MSD/FID) system. This system has been described in detail else-where (Millet et al., 2005). Briefly, the FID channel was configured for analysis of C3-C6
alkanes, alkenes, and alkynes, and the MSD channel for analysis of a range of other VOC, including aromatic, oxygenated and halogenated compounds. For 36 min out of
20
every hour, two subsample flows (15 ml/min) were drawn from the main sample line (4 liters/min) and passed through a preconditioning trap for the removal of water (–25◦C cold trap). Carbon dioxide and ozone were scrubbed from the FID channel subsample (Ascarite II), and ozone was removed from the MSD channel subsample (KI impreg-nated glass wool). Preconcentration was accomplished using a combination of
ther-25
moelectric cooling (–15◦C) and adsorbent trapping. Samples were injected into the GC by rapidly heating the trap assemblies to 200◦C. The instrument was calibrated several
ACPD
6, 12929–12965, 2006
Observations of total peroxy nitrates and
aldehydes P. A. Cleary et al. Title Page Abstract Introduction Conclusions References Tables Figures ◭ ◮ ◭ ◮ Back Close
Full Screen / Esc
Printer-friendly Version
Interactive Discussion
EGU
times daily by dynamic dilution (factor of 1000) of low ppm level standards (Scott Marin Inc., and Apel-Riemer Environmental Inc.) into zero air. Zero air was analyzed daily to check for blank problems and contamination for all measured compounds. Final data represent samples collected from 15 to 51 min of each hour (a 36 min integral).
The ΣPN and NO2 measurements were put on a common time base with the VOC
5
measurements by averaging over the 36 min of the VOC sampling. Data are included in this analysis if a minimum of 15 min of ΣPNs and NO2were obtained during the 36 min
VOC sampling window.
3 Observations
Measurements of ΣPNs and NO2from 19 July–16 September 2001 are shown in Fig. 2.
10
ΣPNs ranged from 0 to 0.080 ppb at night and had a midday peak that typically occurred between noon and 01:00 p.m. ranging from 0.5–2.5 ppb, with a median of 1.2 ppb. The average daytime (08:00–20:00 h) mixing ratio of ΣPNs was 0.910 ppbv. NO2 peaked
during both the morning and evening rush hours with mean concentrations of 8 and 10 ppb, respectively. Typical noontime concentrations of NO2 were 4.5 ppb. At noon,
15
ΣPNs are typically 10% of ΣNOyi, and they range from 10–30% of NOz. These
obser-vations of ΣPN mixing ratios are within the typical range of peroxy-nitrates measured at other locations. For example, at the University of California Blodgett Forest Research Center, 5 h downwind of the Granite Bay site, summertime ΣPN measurements peak later in the day (08:00 p.m.) at around 0.550 ppb, are 10–20% of ΣNOyiand 15–25% of
20
NOz (Day et al., 2003). Roberts et al. (2002) report the sum of 3 PNs: PAN, PPN and
MPAN, observed outside of Nashville in June 1999, had an average daytime mixing ratio of 1.14 ppb (10% of NOy). At La Porte, Texas during August-September 2000, Roberts et al. (2001) report the sum of 5 different PNs, PAN, PPN, MPAN, PiBN and APAN was on average 1.18 ppb, an amount we calculate was 8% of NOy and 17% of
25
NOz(NOy-NOx) at that site.
ACPD
6, 12929–12965, 2006
Observations of total peroxy nitrates and
aldehydes P. A. Cleary et al. Title Page Abstract Introduction Conclusions References Tables Figures ◭ ◮ ◭ ◮ Back Close
Full Screen / Esc
Printer-friendly Version
Interactive Discussion
EGU
aldehyde, with concentrations ranging 0.5 to 3 ppb. Except for methacrolein, the alde-hydes reached a maximum at night (when the boundary layer is thinnest) suggesting that in addition to photochemical production, direct emissions and/or NO3 chemistry
affect the abundance of aldehydes at this site. Acetaldehyde was generally constant in the morning, then decreased in the early afternoon, rising in the evening to its
night-5
time maximum. However, several different daytime patterns were observed as shown in Fig. 4a, which shows acetaldehyde and ΣPN observations from 11–16 September 2001. Nearly constant daytime acetaldehyde was observed on 12 and 16 September; a morning increase and afternoon decrease were observed on 13 and 15 September ; and a sharp midday decrease was observed on 14 September. On 11 September, the
10
acetaldehyde mixing ratio increased throughout the day. Pentanal and hexanal have similar diurnal patterns to acetaldehyde, although they both show patterns of decreas-ing midday concentration more frequently than acetaldehyde. Methacrolein generally increased in the morning and peaked in the afternoon, and was strongly correlated to isoprene mixing ratios. Median daytime observations of acetaldehyde, pentanal,
hex-15
anal and methacrolein were 1.2 ppb, 0.093 ppb, 0.14 ppb, and 0.27 ppb, respectively. Our observed mixing ratios of aldehydes are in the range of those reported at two other urban sites, as shown in Table 1. Grossman et al. (2003) measured C2-C10
aldehydes and methacrolein in July 1998 near Berlin and report the higher n-aldehydes (C7-C10) had a diurnal pattern with maxima at 10:00 a.m. and minima at midnight.
20
McClenny et al. (1998) report n-aldehydes at Nashville are strongly correlated with each other, and exhibit a diurnal cycle with minima in the early evening and maxima at noon. Wedel et al. (1998) report C5-C9 n-aldehydes in rural north-eastern Germany, during August, 1994 and describe night-time maxima in aldehydes. Concentrations of all aldehydes were much lower at this rural site. Grossman et al. (2003) also report
25
that typical maxima were 2–5 times the minima for all aldehydes observed. These observations indicate that the aldehydes we were able to observe are not a complete set. Measurements have shown that there are significant aldehyde emissions from a variety of plant species (Vuorinen et al., 2005; Wildt et al., 2003) and that aldehydes
ACPD
6, 12929–12965, 2006
Observations of total peroxy nitrates and
aldehydes P. A. Cleary et al. Title Page Abstract Introduction Conclusions References Tables Figures ◭ ◮ ◭ ◮ Back Close
Full Screen / Esc
Printer-friendly Version
Interactive Discussion
EGU
are produced as a result of ozonolysis reactions with fatty acids. Nonanal has received special attention because its production is particularly favorable (Hung et al., 2005; Thornberry and Abbatt, 2004). Ambient mixing ratios for propanal, butanal and hexanal have been reported to be higher than those of pentanal; while mixing ratios of heptanal and octanal are lower than pentanal. Nonanal has been observed at mixing ratios
5
approximately double those of pentanal.
4 Steady state calculation of peroxy nitrates
ΣPNs, the measurement of total peroxy nitrates, are a new measurement (Day et al., 2002), not previously analyzed in detail. To evaluate the contributions of individual PNs (denoted PNi) to ΣPNs we note that when temperatures and OH concentrations are
10
high, individual PNs are approximately in steady state with their acetaldehyde sources (R1) and their sink through the peroxy radical (PAi) + NO Reaction (R3). PNi and PAi
are in rapid steady state with a lifetime on the order of minutes for typical surface condi-tions at Granite Bay in summer, at a daytime mean of 297 K. The steady state condition for the sum of a PNi and PAi will be satisfied when the lifetime of PNT i(PNT i=PAi+PNi)
15
is of order a few hours or less and the concentration of the acetaldehyde precursor is nearly constant on that timescale. For example, the lifetime of [PAN+PA] with respect to loss to R3 is on the order of 40 min at 298 K using rate coefficients outlined in Ta-ble 2 at typical noontime values of NO and NO2 at Granite Bay. The lifetimes of other
PNs are similar or shorter in cases where the reaction with OH is rapid. Thus, at
tem-20
peratures greater than 298 K, each PNi approaches a steady state with its aldehyde source in about an hour. However, the lifetime of acetaldehyde with respect to loss to OH at noon (298 K, OH = 6×10⁶molecules/cm3) is about 3 h. If there were no sources of aldehydes, PNs might not reach a steady state when OH mixing ratios are at their peak, because of the rapidly decreasing aldehyde concentrations. However, as
dis-25
cussed above, aldehydes exhibit a range of diurnal patterns and the aldehydes are often observed to have nearly constant mixng ratios or to be decreasing more slowly
ACPD
6, 12929–12965, 2006
Observations of total peroxy nitrates and
aldehydes P. A. Cleary et al. Title Page Abstract Introduction Conclusions References Tables Figures ◭ ◮ ◭ ◮ Back Close
Full Screen / Esc
Printer-friendly Version
Interactive Discussion
EGU
than the lifetime of 3 h during the day. Thus, PNT i likely achieves near steady-state conditions.
Steady state equations for PAi and the (PNT i)/aldehydei ratio derived from Reac-tions (1)–(4) are:
[PAi]ss =k1aldehydei [OH] ∗ [aldehydei]+ k−2[PNi] k2[NO2]+ k3[NO] (2) 5 [PNT]i [aldehyde]i = k1aldehydei ∗ β ∗ [OH] k−2∗ (1 − β) + k4[OH] whereβ = k 1 3[NO] k2[NO2] + 1 (3)
These equations assume each PN has a single aldehyde source and that the only important sink of PNs is reaction of PA with NO. For the conditions at Granite Bay, we calculate that PA radicals make up less than 1% of HO2 + RO2 and the loss rate for
any peroxy-radical to reaction with NO is about 300 times faster than peroxy-radical
10
self reactions.
In order to evaluate the accuracy of the steady state approximation represented by Eqs. (2) and (3), we solved the differential equation (Eq. 4) describing PAN mixing ratios over the course of a day by numerical integration:
d (PAN)
d (t) = β(t) ∗ k1[acetaldehyde(t)] [OH] − k−2∗ (1 − β(t)) ∗ [PAN(t)] . (4)
15
We compare the solution of the time dependent integration to the instantaneous steady state solution using 4 different models of the production/emission rates for acetalde-hyde. The four scenarios were: A) acetaldehyde production equal to loss (Pacet=Lacet),
B) acetaldehyde production equal to zero (Pacet=0), C) acetaldehyde production equal
to 1.5 times loss (Pacet=1.5Lacet) and D) Pacet=1.5Lacet from sunrise to noon, and
20
Pacet=2/3Lacet from noon to sunset. Acetaldehyde loss (Lacet) was determined by its
reaction rate with the OH field defined above. The acetaldehyde concentrations pro-duced in these scenarios are shown in Fig. 5b. Scenario A is a close match to the ob-servations on 12 September 2001. Scenario D produces acetaldehyde concentrations
ACPD
6, 12929–12965, 2006
Observations of total peroxy nitrates and
aldehydes P. A. Cleary et al. Title Page Abstract Introduction Conclusions References Tables Figures ◭ ◮ ◭ ◮ Back Close
Full Screen / Esc
Printer-friendly Version
Interactive Discussion
EGU
similar to that observed on 13 September 2001. Scenarios B and C represent limiting cases that describe behavior of acetaldehyde outside the range of the observations and thus put useful bounds on the comparison of the time dependent and steady state calculations.
The calculations were initialized using 0.300 ppb for [PAN] and 1.0 ppb for
[acetalde-5
hyde]. These are typical values at sunrise. We used as input the median diurnal cycles of the ratio [NO]/[NO2], temperature, and an estimate for OH of 1.4×10⁷molecules cm−3 at noon (based on the results of Dillon et al. , 2002). The temporal variation in
OH was estimated by scaling to PAR. These parameters are shown in Fig. 5.
Figures 6a and b, respectively, show the steady state and time dependent
calcula-10
tions of PAN for scenarios A and D. Figure 6c shows the ratio of the steady state (SS) to the time dependent (TD) calculations of PAN versus time of day for all 4 scenarios. After an initial spin up time of about two hours, the SS calculation is within ±30% of the TD calculation through the remainder of the day for scenarios A, C and D. For sce-nario A when acetaldehyde concentrations are constant, the steady state calculation
15
agrees with the TD calculation to within ±10%. For scenario B, where the production of acetaldehyde is zero, the acetaldehyde concentration is changing most rapidly com-pared to the PAN lifetime. As a result, the time dependent calculation has higher PN concentrations than steady state. Even in this scenario the time dependent calculation differs from the steady state approximation by only 60% (SS/TD=0.4). For scenario
20
C, the net acetaldehyde lifetime is comparable to the PAN lifetime and the steady state calculation predicts 40% more PAN than the time dependent calculation before 11:00 h. The two calculations for scenario C converge to within 25% at noon. The sign of the SS/TD ratio reflects that production of acetaldehyde is larger than losses in scenario C. Scenario D represents a situation such as on 13 September where there is net
25
production of acetaldehyde in the morning but a decrease during the afternoon. This scenario combines the effects seen in scenarios B and C. The steady state calculation overestimates PAN in the morning, crosses through a point where the two calculations agree at about noon before underestimating PAN for the remainder of the afternoon.
ACPD
6, 12929–12965, 2006
Observations of total peroxy nitrates and
aldehydes P. A. Cleary et al. Title Page Abstract Introduction Conclusions References Tables Figures ◭ ◮ ◭ ◮ Back Close
Full Screen / Esc
Printer-friendly Version
Interactive Discussion
EGU
We tested whether the comparison of time-dependent and steady state calculations had a strong sensitivity to the assumed OH. Using a more than ten-fold decrease in OH, 1×10⁶ at noon, the differences between the steady state and time dependent calculations decreased slightly for scenarios B, C, and D at all times of the day. Steady-state and time dependent calculations using the lower OH agreed less well during the
5
rush hour when the NO/NO2ratio is highest for scenario A.
Most of the observations have similar diurnal patterns to scenarios A or D, and we interpret the comparisons presented in this section to indicate that the steady state approximation for PN to aldehyde ratios is accurate to 30% or better outside of the rush hour periods.
10
5 Partitioning of ΣPNs and estimates of OH
We calculate ΣPNs as the sum of steady state expressions (EQN 3) for each individual peroxy nitrate: ΣPNs = β∗k1i[OH]∗[acet] k−2(1−β)+k4i[OH]+ β∗αi∗k1i[OH]∗[MACR] k−2(1−β)+k4i[OH] + β∗αi∗k1i[OH]∗[ptnl] k−2(1−β)+k4i[OH] + β∗αi∗k1i[OH]∗[hxnl ] k−2(1−β)+k4i[OH] + ... (5)
The reaction rate for each aldehyde with OH (k1i), each PNi with OH (k4i) and the
15
branching ratio of aldehydic abstraction (αi) by OH are specific to each PNi/aldehydei
pair. For example, MPAN has a significant loss to reaction with OH, producing products that are not ΣPNs (Orlando et al., 2002). The reactions of other PNs with OH are slow, but the magnitudes may increase with carbon number (Jenkin et al., 1997). The reac-tions of each peroxy-radical with NO2and NO (rate constants k2and k3) are estimated
20
to be the same for all peroxyacyl radicals. The dissociation of each PN back to NO2
(k−2) is also estimated to be the same as that measured for PAN (Atkinson et al., 1997; Atkinson et al., 2004). The unique solution to Eq. (5) results in determination of the OH concentration and the concentrations for individual peroxy nitrates for each point in the data set. In our tests of the accuracy of the steady-state model we calculated PAN
25
ACPD
6, 12929–12965, 2006
Observations of total peroxy nitrates and
aldehydes P. A. Cleary et al. Title Page Abstract Introduction Conclusions References Tables Figures ◭ ◮ ◭ ◮ Back Close
Full Screen / Esc
Printer-friendly Version
Interactive Discussion
EGU
relationship also applies to calculations of OH using measured ΣPNs and aldehydes, if the assumption that the ΣPNs and aldehydes are in steady-state holds and if the aldehyde sources of PAi represented in the model are a complete set.
We solve Eq. (5) for three models: A) using the observed aldehydes and constraining the relationship of PPN to PAN, B) adding to model A an estimate of the concentration
5
for a broader range of aldehydes and C) adding to model B an additional source of PAN. One of the more abundant and well-studied PNs is PPN. However, we do not have a measurement of propanal, the aldehyde precursor to PPN. At inland sites in California, the PPN/PAN ratio has been observed to be 0.15 with little variation (Grosjean et al., 2002, and references therein). Thus we fix the PPN to PAN ratio at 0.15 and adjust the
10
propanal concentration accordingly in all three models.
In model B we estimate the mixing ratio of other aldehydes based on prior observa-tions at other urban locaobserva-tions (Grossman et al., 2003; McClenny et al., 1998; Wedel et al., 1998; Hurst-Bowman et al., 2003). We include isobutanal, along with C4, C7, C8, and C9n-aldehydes. C4, C7and C8aldehydes are estimated to occur at the same
mix-15
ing ratio as pentanal and nonanal is estimated to be twice as abundant as pentanal. Table 3 lists the rate constants (298K) for the reaction of C2-C9 aldehydes with OH along with the average noontime concentrations that we observed or that we estimate. The branching ratio between aldehyde-H abstraction, which leads to PN formation, and alkyl-H abstraction, which we assume does not, increases with the carbon chain length
20
of the n-aldehydes. For propanal, the ratio of OH abstraction at the aldehydic hydro-gen to the alkyl hydrocarbons is estimated to be 95% and for butanal 90% (Jenkin, et al., 1997) The ratio of aldehyde-H abstraction to alkyl abstraction for nonanal was calculated to be 50% by Hurst-Bowman et al. (2003). As an estimate for other species we smoothly connect the butanal and nonanal points, decreasing the reaction at the
25
aldehydic hydrogen by 8% per carbon (82% for pentanal, 74% for hexanal, 66% for heptanal and 58% for octanal). For methacrolein, observations indicate 45% of OH reactions abstract the aldehydic hydrogen (Orlando et al., 1999).
ACPD
6, 12929–12965, 2006
Observations of total peroxy nitrates and
aldehydes P. A. Cleary et al. Title Page Abstract Introduction Conclusions References Tables Figures ◭ ◮ ◭ ◮ Back Close
Full Screen / Esc
Printer-friendly Version
Interactive Discussion
EGU
In model C, we include an added source of PA radicals contributing to the formation of PAN. Roberts et al. (2001) suggest there is a large source of PA radicals other than acetaldehyde based on their observations in Nashville, TN, an urban area where iso-prene dominates local photochemistry. One suggestion for this source is methylglyoxal (Romero et al., 2005), which is a product of isoprene oxidation and thus likely abundant
5
both in Granite Bay, CA and in Nashville, TN. Based on the calculations by Roberts et al., the missing source of PA could be 2 to 3 times larger than the PA source from ac-etaldehyde. For scenario C, we add an additional source of PA radicals that fixes PAN at 70% of ΣPNs.
The calculated partitioning of peroxy-nitrates using the inputs described above are
10
shown in Table 4. PAN is calculated to be the largest portion of ΣPNs, 65% for model A, 50% in model B, and constrained to be 70% for model C. For model A, PPN, C5PAN,
C6PAN and MPAN are 9.8, 7.7, 11 and 6.3% of ΣPNs, respectively. In model B, PNs
that have never been observed in the atmosphere are estimated to contribute about 1/3 of the total peroxy nitrates, with C9PAN and C6PAN the most abundant of these,
15
each at 8.5% of ΣPNs. Comparisons of ΣPNs with measurements of individual PNs suggest that the 1/3 contribution for previously unmeasured PNs is too large (Roberts et al., 2003; Rosen, 2004; Wooldridge et al., 20061). The contribution of PAN to ΣPNs observed during our previous measurements was never less than 70% and was typi-cally 80%. Thus model C represents a situation that is consistent with the lower end of
20
the prior observations of the PAN/ΣPNs ratio. We found it necessary to insert a source of PA radicals that is 3 times the acetaldehyde source alone in order to increase the PAN fraction of the ΣPNs. In our calculation we have implemented this increase by simply increasing the concentration of acetaldehyde. This has the effect of reducing the calculated OH substantially because of the inverse relationship between the OH
25
that is calculated by rearranging Eqs. (3) and (5) and aldehyde sources of PNs. If the sole source were instead photolysis and reaction of OH with methylglyoxal, with a noon photolysis rate coefficient of 2×10⁻⁴s−1, and a rate constant for reaction of OH of 1.7×10⁻¹¹cm3-molecule−1-s−1about 0.5 ppb of methylglyoxal would be required. This
ACPD
6, 12929–12965, 2006
Observations of total peroxy nitrates and
aldehydes P. A. Cleary et al. Title Page Abstract Introduction Conclusions References Tables Figures ◭ ◮ ◭ ◮ Back Close
Full Screen / Esc
Printer-friendly Version
Interactive Discussion
EGU
would result in a much higher calculated concentration of OH (about a factor of 2), but not so high as to be inconsistent with other estimates. However this concentration of methylglyoxal is likely larger than what is present as the average observed daytime concentrations of methacrolein and methyl vinyl ketone which are thought to be the pri-mary precursors to methylglyoxal are only 0.6 and 0.3 ppb, respectively. We conclude
5
that a source of PA radicals in addition to methylglyoxal must be present in Sacramento to explain the PAN:ΣPN ratio.
The calculated partitioning of ΣPNs varies little over the course of the day because the ratio of aldehydes varies little, although some of the PNs may have much lower mix-ing ratios in the background atmosphere than PAN and may therefore be more affected
10
by mixing, especially early in the day. The peak abundance of each peroxy nitrate and its ratio to PAN from model C are very similar to other measurements. For example, Roberts et al. (1998, 2001, 2002) report daytime MPAN to PAN ratios ranging from 3–9% during experiments Nashville (1994, 1995, 1999) and in Houston (2000), with average concentrations for MPAN of 0.048 ppb (Nashville, 1994), 0.037 ppb (Nashville,
15
1995), 0.084 ppb (Nashville, 1999) and 0.030 ppb (Houston, 2000). Our estimates of the same quantities are 6% and 0.030 ppb using model C. Models A and B both re-sult in MPAN to PAN ratios of 10–11%, higher than any of these prior measurements. Roberts et al. (2001) report average daytime PiBN/PAN ratios of ∼2% at La Porte, TX. Our estimate of the PiBN/PAN ratio from model C is 2% and for model B it is 5%, double
20
that observed in La Porte, TX. The distribution of PNs in model C has a contribution of 15% from PNs that have never previously been measured in ambient samples. We believe this is too high. The most likely reason is that ΣPNs are slightly out of steady state, although the possibilities that the higher PNs have much faster atmospheric re-moval processes or that PAN sources other than acetaldehyde are even larger than we
25
speculated in model C should also be explored.
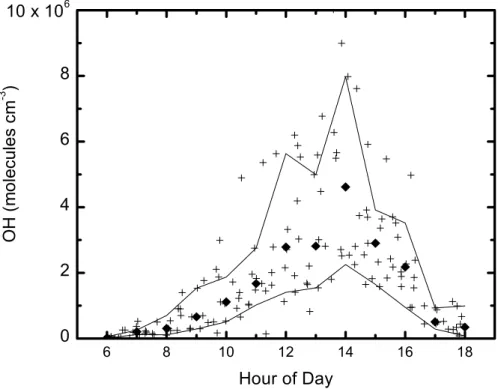
The calculated OH (model C) has a strong diurnal cycle with midday peaks 1–3 h after local noon ranging from 1–6×10⁶molecules/cm3on different days (Figs. 4 and 7). The median results are 2.8×10⁶and 4.6×10⁶molecules cm−3 at 12:00 h and 14:00 h,
ACPD
6, 12929–12965, 2006
Observations of total peroxy nitrates and
aldehydes P. A. Cleary et al. Title Page Abstract Introduction Conclusions References Tables Figures ◭ ◮ ◭ ◮ Back Close
Full Screen / Esc
Printer-friendly Version
Interactive Discussion
EGU
respectively. The inverse relation between modeled PN sources (Eqs. 3 and 5) results in OH calculated using model A that is 250% larger and model B that 100% larger than that calculated with model C. If some large fraction of the PAN production is photolysis of an aldehyde instead of oxidation by OH, then the OH could be as high as that indi-cated by model B. Figure 4b shows the calculated OH (Model C) on 11 September–16
5
September. Notice that for very different ΣPN and acetaldehyde concentrations, sim-ilar OH profiles are derived. For example, on both 11 September and 13 September, the modeled OH peaks at 2×10⁶molecules cm−3 while acetaldehyde and ΣPN
mea-surements peak at midday on 13 September at concentrations roughly twice that of 11 September. Given the approximations that are used to calculate OH, these specific
10
values should be interpreted with caution until a more extensive comparison of this method for inferring OH and direct OH measurements can be made.
The OH we calculate is lower than the values derived from oxidation/dilution analy-ses of observations downwind of Granite Bay within the Sacramento plume by Dillon et al. (2002); Schade et al. (2002) and Dreyfus et al. (2002). Lower OH at Granite
15
Bay than in the average over the Sacramento plume is expected because the Gran-ite Bay sGran-ite is NOx saturated and OH should increase as NOx decreases downwind (Murphy et al., 2006a, b). It is also possible that we underestimate the OH because of treating the additional PAN source as acetaldehyde rather than assuming it is pho-tolytic. The diurnal profile of the calculated OH during the entire campaign is shown
20
in Fig. 7. The black squares represent the mean values and the solid lines ±1σ for each 1-h bin u. We infer a median OH of 2.8×10⁶molecules cm−3 at noon and of 4.7×10⁶molecules cm−3 at 14:00 h. This asymmetry about noon is consistent with
recent measurements of OH by Martinez et al. (2002); Ren et al. (2003) who report maxima at ∼02:00 p.m. Similar noontime OH concentrations have been reported for
25
Los Angeles 3–6×10⁶molecules cm−3 (George et al., 1999) and Munich, Germany
ACPD
6, 12929–12965, 2006
Observations of total peroxy nitrates and
aldehydes P. A. Cleary et al. Title Page Abstract Introduction Conclusions References Tables Figures ◭ ◮ ◭ ◮ Back Close
Full Screen / Esc
Printer-friendly Version
Interactive Discussion
EGU
6 Conclusions
We describe observations of ΣPNs, aldehydes, NO2 and O3 at Granite Bay, CA from
19 July–16 September 2001. The observations are used to characterize the partition-ing of ΣPNs and to demonstrate the possibility of determpartition-ing the mixpartition-ing ratio of OH if the sources of PNs were accurately known. We calculate that PAN is likely 65% of
5
ΣPNs if acetaldehyde is the only PAN source, a value too low to be consistent with prior measurements, suggesting a prominent role for another source of PA radicals. Con-straining PAN to be 70% of ΣPNs and PPN to be 15% of PAN, we estimate MPAN is 3% of ΣPNs, PiBn is 1% and that the sum of C5 and larger PNs that have not previously
been observed outside the laboratory to be 15% of ΣPNs. This value for the fraction
10
of ΣPNs that are species that have never before been observed in the atmosphere is likely too high. We suspect that this is due to PNs being out of steady state with their sources. We also calculate a diurnal profile of OH at the site that is in reasonable correspondence with direct observations at other locations and derive a median OH of 2.6×10⁶molecules cm−3 at noon.
15
We have compared a steady state and time dependent calculation for PNs show-ing that the steady state calculation is accurate to 30%. This implies a relatively rapid interconversion between NOx and ΣPNs in urban plumes, such that ΣPNs do not
rep-resent a terminal sink of NOx. The quantities NOx, NOy and NOz have been widely interpreted based on the assumption that NOzis quite slowly (if at all) returned to the
20
NOxpool. Our results suggest that rethinking the use of these quantities is necessary.
We calculate that peroxy nitrates are usually in steady state with NO2on a time scale of 40 min. In the urban plume described in this manuscript, ΣPNs range from1/4 to
about1/2of NO
2during midday. This short lifetime and the high relative concentrations
of peroxy nitrates compared to NOx imply that the PNs component of NOz can buffer
25
NOx concentrations in the planetary boundary layer. Thus as the Sacramento plume
(and by analogy many other urban plumes) is transported downwind PNs decompose keeping NOx higher than would be the case if PNs were a permanent NOx sink. As
ACPD
6, 12929–12965, 2006
Observations of total peroxy nitrates and
aldehydes P. A. Cleary et al. Title Page Abstract Introduction Conclusions References Tables Figures ◭ ◮ ◭ ◮ Back Close
Full Screen / Esc
Printer-friendly Version
Interactive Discussion
EGU
an alternative to the usual definitions of NOxand NOz we suggest that NOx+PNs and HNO3+ANs (or NOy-NOx-PNs) be used in analyses of the correlations of O3and NOx
in warm urban plumes.
Acknowledgements. We gratefully acknowledge the U.S. Department of Energy support for
measurements under contract AC03-76SF0009 and National Science Foundation support for
5
analysis under grant ATM-0138669. D. Millet also acknowledges a DOE GCEP fellowship for funding. We are grateful to the Eureka Union School District for the use of the measurement site.
References
Atkinson, R. and Lloyd, A. C.: Evaluation of Kinetic and Mechanistic Data For Modeling of
10
Photochemical Smog, J. Phys. Chem. Ref. Data, 13, 315–444, 1984.
Atkinson, R.: Gas-Phase Tropospheric Chemistry of Organic-Compounds, J. Phys. Chem. Ref. Data, 2, 1–216, 1994.
Atkinson, R., Baulch, D. L., Cox, R. A., Hampson, R. F., Kerr, J. A., Rossi, M. J., and Troe, J.: Evaluated kinetic and photochemical data for atmospheric chemistry: Supplement VI
15
– IUPAC subcommittee on gas kinetic data evaluation for atmospheric chemistry, J. Phys. Chem. Ref. Data, 26, 1329–1499, 1997.
Atkinson, R., Baulch, D. L., Cox, R. A., Crowley, J. N., Hampson, R. F., Hynes, R. G., Jenkin, M. E., Rossi, M. J., and Troe, J.: Evaluated kinetic and photochemical data for atmospheric chemistry: Volume I – gas phase reactions of Ox, HOx, NOxand SOxspecies, Atmos. Chem.
20
Phys., 4, 1461–1738, 2004,
http://www.atmos-chem-phys.net/4/1461/2004/.
Beine, H. J., Jaffe, D. A., Blake, D. R., Atlas, E., and Harris, J.: Measurements of PAN, alkyl nitrates, ozone, and hydrocarbons during spring in interior Alaska, J. Geophys. Res.-Atmos., 101, 12 613–12 619, 1996.
25
Blitz, M. A., Heard, D. E., Pilling, M. J., Arnold, S. R., and Chipperfield, M. P.: Pressure and temperature-dependent quantum yields for the photodissociation of acetone between 279 and 327.5 nm, Geophys. Res. Lett., 31, L06111, doi:10.1029/2003GL018793, 2004.
ACPD
6, 12929–12965, 2006
Observations of total peroxy nitrates and
aldehydes P. A. Cleary et al. Title Page Abstract Introduction Conclusions References Tables Figures ◭ ◮ ◭ ◮ Back Close
Full Screen / Esc
Printer-friendly Version
Interactive Discussion
EGU
atmospheric NO2with a commercial diode laser and a supersonic expansion, Appl. Opt., 41, 6950–6956, 2002.
Cleary, P. A., Murphy, J. G., Wooldridge, P. J., Day, D. A., Millet, D. B., McKay, M., Goldstein, A. H., and Cohen, R. C.: Observations of total alkyl nitrates within the Sacramento Urban Plume, Atmos. Chem. Phys. Discuss., 5, 4801–4843, 2005,
5
http://www.atmos-chem-phys-discuss.net/5/4801/2005/.
Corsmeier, U., Kalthoff, N., Vogel, B., Hammer, M. U., Fiedler, F., Kottmeier, C., Volz-Thomas, A., Konrad, S., Glaser, K., Neininger, B., Lehning, M., Jaeschke, W., Memmesheimer, M., Rappengluck, B., and Jakobi, G.: Ozone and PAN formation inside and outside of the Berlin plume – Process analysis and numerical process simulation, J. Atmos. Chem., 42, 289–321,
10
2002a.
Corsmeier, U., Kalthoff, N., Vogel, B., Hammer, M. U., Fiedler, F., Kottmeier, C., Volz-Thomas, A., Konrad, S., Glaser, K., Neininger, B., Lehning, M., Jaeschke, W., Memmesheimer, M., Rappenglueck, B., and Jakobi, G.: Ozone and PAN Formation Inside and Outside of the Berlin Plume – Process Analysis and Numerical Process Simulation, J. Atmos. Chem., 42,
15
289–321, 2002b.
Day, D. A., Wooldridge, P. J., Dillon, M. B., Thornton, J. A., and Cohen, R. C.: A thermal dis-sociation laser-induced fluorescence instrument for in situ detection of NO2, peroxy nitrates, alkyl nitrates, and HNO3, J. Geophys. Res.-Atmos., 107, 4046, doi:10.1029/2001JD000779, 2002.
20
Day, D. A., Dillon, M. B., Wooldridge, P. J., Thornton, J. A., Rosen, R. S., Wood, E. C., and Cohen, R. C.: On alkyl nitrates, O3, and the “missing NOy”, J. Geophys. Res.-Atmos., 108, 4501, doi:10.1029/2003JD003685, 2003.
Dillon, M. B., Lamanna, M. S., Schade, G. W., Goldstein, A. H., and Cohen, R. C.: Chemical evolution of the Sacramento urban plume: Transport and oxidation, J. Geophys. Res.-Atmos.,
25
107, 4045, doi:10.1029/2001JD000969, 2002.
Dreyfus, G. B., Schade, G. W., and Goldstein, A. H.: Observational constraints on the contri-bution of isoprene oxidation to ozone production on the western slope of the Sierra Nevada, California, J. Geophys. Res., 107, 4365, doi:10.1029/2001JD001490, 2002.
Gaffney, J. S., Marley, N. A., Cunningham, M. M., and Doskey, P. V.: Measurements of
peroxy-30
acyl nitrates (PANS) in Mexico City: implications for megacity air quality impacts on regional scales, Atmos. Environ., 33, 5003–5012, 1999.
ACPD
6, 12929–12965, 2006
Observations of total peroxy nitrates and
aldehydes P. A. Cleary et al. Title Page Abstract Introduction Conclusions References Tables Figures ◭ ◮ ◭ ◮ Back Close
Full Screen / Esc
Printer-friendly Version
Interactive Discussion
EGU
Baird, J. C., Dintaman, J., and Hart, H. L.: Field observations of regional and urban impacts on NO2, ozone, UVB, and nitrate radical production rates in the Phoenix air basin, Atmos. Environ., 36, 825–833, 2002.
George, L. A., Hard, T. M., and O’Brien, R. J.: Measurement of free radicals OH and HO2 in Los Angeles smog, J. Geophys. Res., [Atmospheres], 104, 11 643–11 655, 1999.
5
Glavas, S. and Moschonas, N.: Determination of PAN, PPN, PnBN and selected pentyl nitrates in Athens, Greece, Atmos. Environ., 35, 5467–5475, 2001.
Grosjean, E., Grosjean, D., Woodhouse, L. F., and Yang, Y. J.: Peroxyacetyl nitrate and perox-ypropionyl nitrate in Porto Alegre, Brazil, Atmos. Environ., 36, 2405–2419, 2002.
Grossmann, D., Moortgat, G. K., Kibler, M., Schlomski, S., Bachmann, K., Alicke, B., Geyer,
10
A., Platt, U., Hammer, M. U., Vogel, B., Mihelcic, D., Hofzumahaus, A., Holland, F., and Volz-Thomas, A.: Hydrogen peroxide, organic peroxides, carbonyl compounds, and or-ganic acids measured at Pabstthum during BERLIOZ, J. Geophys. Res.-Atmos., 108, 8250, doi:10.1029/2001JD001096, 2003.
Handisides, G. M., Plass-Duelmer, C., Gilge, S., Bingemer, H., and Berresheim, H.:
Hohen-15
peissenberg Photochemical Experiment (HOPE 2000): measurements and photostationary state calculations of OH and peroxy radicals, Atmos. Chem. Phys., 3, 1565–1588, 2003,
http://www.atmos-chem-phys.net/3/1565/2003/.
Hung, H. M., Katrib, Y., and Martin, S. T.: Products and mechanisms of the reaction of oleic acid with ozone and nitrate radical, J. Phys. Chem. A, 109, 4517–4530, 2005.
20
Hurst-Bowman, J., Basket, D. J., and Shepson, P. B.: Atmospheric chemistry of nonanal, Envi-ron. Sci. Technol., 38, 2218–2225, 2003.
Jenkin, M. E., Saunders, S. M., and Pilling, M. J.: The tropospheric degradation of volatile organic compounds: A protocol for mechanism development, Atmos. Environ., 31, 81–104, 1997.
25
Kwok, E. S. C. and Atkinson, R.: Estimation of Hydroxyl Radical Reaction-Rate Constants For Gas- Phase Organic-Compounds Using a Structure-Reactivity Relationship – an Update, Atmos. Environ., 29, 1685–1695, 1995.
Martinez, M., Harder, H., Brune, W., Di Carlo, P., Williams, E., Hereid, D., Jobson, T., Kuster, W., Roberts, J., Trainer, M., Fehsenfeld, F. C., Hall, S., Shetter, R., Apel, E., Reimer, D.,
30
and Geyer, A.: The behavior of the hydroxyl and hydroperoxyl radicals during TexAQS2000, paper presented at AGU Fall Meeting, EOS Transactions, San Francisco, CA, USA, 2002. McClenny, W. A., Daughtrey, E. H., Adams, J. R., Oliver, K. D., and Kronmiller, K. G.: Volatile
ACPD
6, 12929–12965, 2006
Observations of total peroxy nitrates and
aldehydes P. A. Cleary et al. Title Page Abstract Introduction Conclusions References Tables Figures ◭ ◮ ◭ ◮ Back Close
Full Screen / Esc
Printer-friendly Version
Interactive Discussion
EGU
organic compound concentration patterns at the New Hendersonville monitoring site in the 1995 Southern Oxidants Study in the Nashville, Tennessee, area, J. Geophys. Res.-Atmos., 103, 22 509–22 518, 1998.
McPeters, R. D.: TOMS, edited by NASA, 2001.
Millet, D. B., Donahue, N. M., Pandis, S. N., Polidori, A., Stanier, C. O., Turpin, B. J., and
5
Goldstein, A. H.: Atmospheric volatile organic compound measurements during the Pitts-burgh Air Quality Study: Results, interpretation, and quantification of primary and secondary contributions, J. Geophys. Res.-Atmos., 110, D07S07, doi:10.1029/2004JD004601, 2005. Murphy, J. G., Day, D. A., Cleary, P. A., Wooldridge, P. J., Millet, D. B., Goldstein, A. H., and
Cohen, R. C.: The weekend effect within and downwind of Sacramento: Part 1. Observations
10
of ozone, nitrogen oxides, and VOC reactivity, Atmos. Chem. Phys. Discuss., 6, 11 427– 11 464, 2006a.
Murphy, J. G., Day, D. A., Cleary, P. A., Wooldridge, P. J., Millet, D. B., Goldstein, A. H., and Cohen, R. C.: The weekend effect within and downwind of Sacramento: Part 2. Observa-tional evidence for chemical and dynamical contributions, Atmos. Chem. Phys. Discuss. 6,
15
11 971–12 019, 2006b.
Noziere, B. and Barnes, I.: Evidence for formation of a PAN analogue of pinonic structure and investigation of its thermal stability, J. Geophys. Res.-Atmos., 103, 25 587–25 597, 1998. Orlando, J. J., Tyndall, G. S., and Paulson, S. E.: Mechanism of the OH-initiated oxidation of
methacrolein, Geophys. Res. Lett., 26, 2191–2194, 1999.
20
Orlando, J. J., Tyndall, G. S., Bertman, S. B., Chen, W. C., and Burkholder, J. B.: Rate coef-ficient for the reaction of OH with CH2=C(CH3)C(O)OONO2 (MPAN), Atmos. Environ., 36,
1895–1900, 2002.
Penkett, S. A. and Brice, K. A.: The spring maximum in photo-oxidants in the Northern Hemi-sphere tropoHemi-sphere, Nature (London, United Kingdom), 319, 655–657, 1986.
25
Rappengluck, B., Oyola, P., Olaeta, I., and Fabian, P.: The evolution of photochemical smog in the Metropolitan Area of Santiago de Chile, J. Appl. Meteorol., 39, 275–290, 2000.
Rappengluck, B., Melas, D., and Fabian, P.: Evidence of the impact of urban plumes on remote sites in the Eastern Mediterranean, Atmos. Environ., 37, 1853–1864, 2003.
Ren, X. R., Harder, H., Martinez, M., Lesher, R. L., Oliger, A., Shirley, T., Adams, J., Simpas, J.
30
B., and Brune, W. H.: HOx concentrations and OH reactivity observations in New York City during PMTACS-NY2001, Atmos. Environ., 37, 3627–3637, 2003.
ACPD
6, 12929–12965, 2006
Observations of total peroxy nitrates and
aldehydes P. A. Cleary et al. Title Page Abstract Introduction Conclusions References Tables Figures ◭ ◮ ◭ ◮ Back Close
Full Screen / Esc
Printer-friendly Version
Interactive Discussion
EGU
G., Kuster, W. C., McKeen, S. A., Ryerson, T. B., Trainer, M., Williams, E. J., Fehsenfeld, F. C., Bertman, S. B., Nouaime, G., Seaver, C., Grodzinsky, G., Rodgers, M., and Young, V. L.: Measurements of PAN, PPN, and MPAN made during the 1994 and 1995 Nashville Intensives of the Southern Oxidant Study: Implications for regional ozone production from biogenic hydrocarbons, J. Geophys. Res.-Atmos., 103, 22 473–22 490, 1998.
5
Roberts, J. M., Stroud, C. A., Jobson, B. T., Trainer, M., Hereid, D., Williams, E., Fehsenfeld, F., Brune, W., Martinez, M., and Harder, H.: Application of a sequential reaction model to PANs and aldehyde measurements in two urban areas, Geophys. Res. Lett., 28, 4583–4586, 2001.
Roberts, J. M., Flocke, F., Stroud, C. A., Hereid, D., Williams, E., Fehsenfeld, F., Brune, W.,
10
Martinez, M., and Harder, H.: Ground-based measurements of peroxycarboxylic nitric an-hydrides (PANs) during the 1999 Southern Oxidants Study Nashville Intensive, J. Geophys. Res.-Atmos., 107, 4554, doi:10.1029/2001JD000947, 2002.
Roberts, J. M., Jobson, B. T., Kuster, W., Goldan, P., Murphy, P., Williams, E., Frost, G., Riemer, D., Apel, E., Stroud, C., Wiedenmyer, C., and Fehsenfeld, F.: An examination of the chemistry
15
of peroxycarboxylic nitric anhydrides and related volatile organic compounds during Texas Air Quality Study 2000 using ground-based measurements, J. Geophys. Res., 108, 4495, doi:10.1029/2003JD003383, 2003.
Romero, M. T. B., Blitz, M. A., Heard, D. E., Pilling, M. J., Price, B., Seakins, P. W., and Wang, L. M.: Photolysis of methylethyl, diethyl and methylvinyl ketones and their role in the
20
atmospheric HOx budget, Faraday Discuss., 130, 73–88, 2005.
Rosen, R. S.: Observations of NO2, peroxy nitrates, alkyl nitrates, HNO3, and total NOy in Houston, TX: implications for O3photochemistry, PhD,200, University of California, Berkeley, Berkeley, 2004.
Rosen, R. S., Wood, E. C., Wooldridge, P. J., Thornton, J. A., Day, D. A., Kuster, W., Williams,
25
E. J., Jobson, B. T., and Cohen, R. C.: Observations of total alkyl nitrates during Texas Air Quality Study 2000: Implications for O3 and alkyl nitrate photochemistry, J. Geophys. Res.-Atmos., 109, D07303, doi:10.1029/2003JD004227, 2004.
Rubio, M. A., Oyola, P., Gramsch, E., Lissi, E., Pizarro, J., and Villena, G.: Ozone and peroxy-acetylnitrate in downtown Santiago, Chile, Atmos. Environ., 38, 4931–4939, 2004.
30
Schade, G. W., Dreyfus, G. B., and Goldstein, A. H.: Atmospheric methyl tertiary butyl ether (MTBE) at a rural mountain site in California, J. Environ. Quality, 31, 1088–1094, 2002. Sehested, J., Christensen, L. K., Nielsen, O. J., Bilde, M., Wallington, T. J., Schneider, W.
ACPD
6, 12929–12965, 2006
Observations of total peroxy nitrates and
aldehydes P. A. Cleary et al. Title Page Abstract Introduction Conclusions References Tables Figures ◭ ◮ ◭ ◮ Back Close
Full Screen / Esc
Printer-friendly Version
Interactive Discussion
EGU
F., Orlando, J. J., and Tyndall, G. S.: Atmospheric chemistry of acetone: Kinetic study of the CH3C(O)CH2O2+NO/NO2 reactions and decomposition of CH3C(O)CH2O2NO2, Int. J.
Chem. Kinetics, 30, 475–489, 1998.
Singh, H. B. and Hanst, P. L.: Peroxyacetyl Nitrate (PAN) in the Unpolluted Atmosphere – an Important Reservoir For Nitrogen-Oxides, Geophys. Res. Lett., 8, 941–944, 1981.
5
Singh, H. B.: Reactive nitrogen in the troposphere, Environ. Sci. Technol., 21, 320–327, 1987. Stephens, E. R., Hanst, P. L., Doerr, R. C., and Scott, W. E.: Reactions of Nitrogen Dioxide and
Organic Compounds in Air, Industrial Eng. Chem., 48, 1498–1504, 1956.
Talukdar, R. K., Burkholder, J. B., Schmoltner, A. M., Roberts, J. M., Wilson, R. R., and Rav-ishankara, A. R.: Investigation of the Loss Processes For Peroxyacetyl Nitrate in the
At-10
mosphere – UV Photolysis and Reaction With Oh, J. Geophys. Res.-Atmos., 100, 14 163– 14 173, 1995.
Thornberry, T. and Abbatt, J. P. D.: Heterogeneous reaction of ozone with liquid unsaturated fatty acids: detailed kinetics and gas-phase product studies, Phys. Chem. Chem. Phys., 6, 84–93, 2004.
15
Thornton, J. A., Wooldridge, P. J., and Cohen, R. C.: Atmospheric NO2: In situ laser-induced fluorescence detection at parts per trillion mixing ratios, Analytical Chem., 72, 528–539, 2000.
Thornton, J. A., Wooldridge, P. J., Cohen, R. C., Williams, E. J., Hereid, D., Fehsenfeld, F. C., Stutz, J., and Alicke, B.: Comparisons of in situ and long path measurements of NO2in urban
20
plumes, J. Geophys. Res.-Atmos., 108, 4496, doi:10.1029/2003JD003559, 2003.
Tyndall, G. S., Orlando, J. J., Wallington, T. J., and Hurley, M. D.: Products of the chlorine-atom-and hydroxyl-radical-initiated oxidation of CH3CN, J. Phys. Chem. A, 105, 5380–5384, 2001. Tyndall, G. S., Apel, E., Williams, E., Flocke, F., Cohen, R. C., Gilge, S., Kim, S., Kim, S.,
Mills, G., O’Brien, J., Perring, A., Rappenglueck, B., Roberts, J., Schmitt, R., Swanson, A.,
25
Tanimoto, H., and Wooldridge, P. J.: PIE 2005: An intercomparison of measurement tech-niques for peroxynitrates (PANs), paper presented at AGU Fall Meeting, EOS Transactions, San Francisco, 2005.
UCAR: TUV (Total Ultraviolet and Visible radiation model), edited, http://www.acd.ucar.edu/
TUV/, 2002.
30
Vuorinen, T., Nerg, A. M., Vapaavuori, E., and Holopainen, J. K.: Emission of volatile organic compounds from two silver birch (Betula pendula Roth) clones grown under ambient and elevated CO2and different O-3 concentrations, Atmos. Environ., 39, 1185–1197, 2005.
ACPD
6, 12929–12965, 2006
Observations of total peroxy nitrates and
aldehydes P. A. Cleary et al. Title Page Abstract Introduction Conclusions References Tables Figures ◭ ◮ ◭ ◮ Back Close
Full Screen / Esc
Printer-friendly Version
Interactive Discussion
EGU
Wallington, T. J., Schneider, W. F., Mogelberg, T. E., Nielsen, O. J., and Sehested, J.: Atmo-spheric Chemistry of FCOx Radicals – Kinetic and Mechanistic Study of the FCO(O)2+No2
Reaction, Int. J. Chem. Kinetics, 27, 391–402, 1995.
Wedel, A., Muller, K. P., Ratte, M., and Rudolph, J.: Measurements of volatile organic com-pounds (VOC) during POPCORN 1994: Applying a new on-line GC-MS-technique, J. Atmos.
5
Chem., 31, 73–103, 1998.
Wildt, J., Kobel, K., Schuh-Thomas, G., and Heiden, A. C.: Emissions of oxygenated volatile organic compounds from plants – part II: Emissions of saturated aldehydes, J. Atmos. Chem., 45, 173–196, 2003.
Williams, J., Roberts, J. M., Fehsenfeld, F. C., Bertman, S. B., Buhr, M. P., Goldan, P. D., Hubler,
10
G., Kuster, W. C., Ryerson, T. B., Trainer, M., and Young, V.: Regional ozone from biogenic hydrocarbons deduced from airborne measurements of PAN, PPN, and MPAN, Geophys. Res. Lett., 24, 1099–1102, 1997.
ACPD
6, 12929–12965, 2006
Observations of total peroxy nitrates and
aldehydes P. A. Cleary et al. Title Page Abstract Introduction Conclusions References Tables Figures ◭ ◮ ◭ ◮ Back Close
Full Screen / Esc
Printer-friendly Version
Interactive Discussion
EGU
Table 1. Observed aldehydes at Granite Bay in comparison to those made in Berlin
(Gross-mann et al., 2003), Nashville (McClenny et al., 1998) and rural Germany (Wedel et al., 1998) given as average concentrations.
Aldehyde this study (ppb) Berlin Germanya Nashville, rural, northwestern TN USAb Germanyc Acetaldehyde 1.20 0.30 Propanal 0.14d 0.20 Butanal 0.10 0.40 Pentanal 0.093 0.10 0.22 0.011 Hexanal 0.140 0.15 0.33 0.023 Heptanal 0.07 0.14 0.002 Octanal 0.02 0.27 0.006 Nonanal 0.08 0.52 0.0017 Methacrolein 0.270 0.03 a (Grossmann et al., 2003) b (McClenny et al., 1998) c (Wedel et al., 1998) d estimated
ACPD
6, 12929–12965, 2006
Observations of total peroxy nitrates and
aldehydes P. A. Cleary et al. Title Page Abstract Introduction Conclusions References Tables Figures ◭ ◮ ◭ ◮ Back Close
Full Screen / Esc
Printer-friendly Version
Interactive Discussion
EGU
Table 2. Important temperature dependent rate coefficients for PAN and products. All rate
coefficients from (Atkinson et al., 1997, 2004).
Reaction k(T) or k(T,[M])a k (300 K) PAN → PA + NO2 k0= 4.9 × 10 −3 s−1exp (–12100/T) [M] 6.3×10⁻⁴s−1 k∞= 5.4 × 10¹⁶exp (–13830/T) Fc= 0.3 N = 1.41 PA + NO2→ PAN k0= 2.7 × 10⁻²⁸(T/300)−7.1[M] 8.6×10⁻¹² k∞= 1.2 × 10⁻¹¹(T/300)−0.9 cm3 molec−1s−1 Fc= 0.3 N = 1 PA + NO → Products 8.1 × 10⁻¹²exp (270/T) 2.0 × 10⁻¹¹ cm3molec−1s−1 a Where k(M) = k0[M] 1+ k0k[M] ∞ ∗ F log F = logFc 1+ (logk0[M] k∞ ) N 2
ACPD
6, 12929–12965, 2006
Observations of total peroxy nitrates and
aldehydes P. A. Cleary et al. Title Page Abstract Introduction Conclusions References Tables Figures ◭ ◮ ◭ ◮ Back Close
Full Screen / Esc
Printer-friendly Version
Interactive Discussion
EGU
Table 3. Measured and estimated aldehydes shown with their rate constant with OH, noon
lifetime (OH = 1×10⁷molecules cm−3), mean daily concentration and branching ratio to peroxy
nitrates. aldehyde kaOH(cm3molecule−1s−1) τb OH(h) ave. daytime (ppb) α acetaldehyde 1.58×10⁻¹¹ 1.2 1.2 1 propanal 1.96×10⁻¹¹ 1 0.14c 0.95c butanal 2.35×10⁻¹¹ 0.8 0.047c 0.90c isobutanal 2.63×10⁻¹¹ 0.8 0.047c 0.90c pentanal 2.99×10⁻¹¹ 0.6 0.093 0.82c hexanal 3.17×10⁻¹¹ 0.6 0.14 0.74c heptanal 3.03 × 10⁻¹¹ d 0.6 0.093c 0.66c octanal 3.17×10⁻¹¹ d 0.6 0.093c 0.58c nonanal 3.6×10⁻¹¹ e 0.5 0.093c 0.5 methacrolein 3.35×10⁻¹¹ 0.6 0.27 0.45 a
Atkinson et al. (1994) unless otherwise stated
b
[OH] = 1× 10⁷molecule cm−3. c
estimated
d
estimated from Kwok et al. (1995)
e


![Fig. 6. Steady-state versus time-dependent models of PAN generation. Plot (a) shows the diurnal profile of calculated PAN concentrations using scenario D with measured acetaldehyde concentrations as input ([PAN] T D = solid line, [PAN] SS = dotted line)](https://thumb-eu.123doks.com/thumbv2/123doknet/14555713.537470/37.918.216.488.52.455/dependent-generation-calculated-concentrations-scenario-measured-acetaldehyde-concentrations.webp)
![[PDF] Apprendre la programmation Android avec base de données - Free PDF Download](data:image/gif;base64,R0lGODlhAQABAIAAAP///wAAACH5BAEAAAAALAAAAAABAAEAAAICRAEAOw==)