Transcriptional signature of human
pro-in
flammatory T
H
17 cells identi
fies reduced IL10
gene expression in multiple sclerosis
Dan Hu
1
, Samuele Notarbartolo
2
, Tom Croonenborghs
3,4,5
, Bonny Patel
1
, Ron Cialic
1
, Tun-Hsiang Yang
6
,
Dominik Aschenbrenner
2,10
, Karin M. Andersson
7
, Marco Gattorno
8
, Minh Pham
1
, Pia Kivisakk
1
,
Isabelle V. Pierre
1
, Youjin Lee
1
, Karun Kiani
3
, Maria Bokarewa
7
, Emily Tjon
1
, Nathalie Pochet
3
,
Federica Sallusto
2,9
, Vijay K. Kuchroo
1
& Howard L. Weiner
1
We have previously reported the molecular signature of murine pathogenic T
H17 cells that
induce experimental autoimmune encephalomyelitis (EAE) in animals. Here we show that
human peripheral blood IFN-
γ
+IL-17
+(T
H1/17) and IFN-
γ
−IL-17
+(T
H17) CD4
+T cells display
distinct transcriptional pro
files in high-throughput transcription analyses. Compared to T
H17
cells, T
H1/17 cells have gene signatures with marked similarity to mouse pathogenic T
H17
cells. Assessing 15 representative signature genes in patients with multiple sclerosis, we
find
that T
H1/17 cells have elevated expression of
CXCR3 and reduced expression of IFNG, CCL3,
CLL4, GZMB, and IL10 compared to healthy controls. Moreover, higher expression of IL10 in
T
H17 cells is found in clinically stable vs. active patients. Our results de
fine the molecular
signature of human pro-inflammatory T
H17 cells, which can be used to both identify
pathogenic T
H17 cells and to measure the effect of treatment on T
H17 cells in human
autoimmune diseases.
DOI: 10.1038/s41467-017-01571-8
OPEN
1Ann Romney Center for Neurologic Diseases and Evergrande Center for Immunologic Diseases, Brigham and Women’s Hospital, Harvard Medical School, Boston, MA 02115, USA.2Institute for Research in Biomedicine, Università della Svizzera italiana, via Vincenzo Vela 6, CH-6500 Bellinzona, Switzerland. 3Program in Translational NeuroPsychiatric Genomics, Brigham and Women’s Hospital, Harvard Medical School, Boston, MA 02115, USA.4KU Leuven Technology Campus Geel, AdvISe, Kleinhoefstraat 4, 2440 Geel, Belgium.5Broad Institute of Massachusetts Institute of Technology and Harvard, Cambridge, MA 02142, USA.6Department of Genetics, Harvard Medical School, Boston, MA 02115, USA.7Department of Rheumatology and Inflammation Research, Sahlgrenska University Hospital, Gothenburg University, Box 480, 405 30 Gothenburg, Sweden.8Second Division of Pediatrics, G. Gaslini Scientific Institute, Largo Gerolamo Gaslini, 5, 16100 Genova(GE), Italy.9Institute of Microbiology, ETH Zurich, Vladimir-Prelog-Weg 1-5/10, 8093 Zürich, Switzerland.10Present address: Translational Gastroenterology Unit, NDM Experimental Medicine, University of Oxford, Headington, OX3 9DU, UK. Dan Hu and Samuele Notarbartolo contributed equally to this work. Correspondence and requests for materials should be addressed to
T
H17 cells are a subset of interleukin-17 (IL-17)-secreting
T-helper (T
H) cells implicated in the pathogenesis of multiple
sclerosis (MS), rheumatoid arthritis, juvenile idiopathic
arthritis (JIA), and psoriasis
1,2, whose differentiation is regulated
by the transcription factor RAR-related orphan nuclear receptor
gamma (RORγt)
3. Initially, T
H
17 cells were considered a
uni-formly pro-inflammatory population driven by IL-23 and
expressed a unique pattern of pro-inflammatory cytokines
dif-ferent from T
H1 and T
H2 cells
4–6. Subsequent studies showed the
function of T
H17 cells in autoimmune diseases and defense
c
IFN-γ IL-17A IL-10 1.13 0.23 1.31 0.026 IL-17Aa
b
IFN-γ IL-17 TH17 TH1 TH1/17 DN nCounter analysis Cell sortingg
e
f
PC1 (80%) PC2 (16%) 0.4 0.2 0.0 –0.2 –0.4 –0.4 –0.3 –0.2 –0.1 A B C E D –1 0 1 DN Relative expression 0 0.5 1 r A B C E D 0.98 0.43 0.78 0.97 0.83 0.55 0.96 0 50,000 100,000 150,000 IFNG*
*
*
**
**
DN TH1 TH17 TH1/17 DN TH1 TH17 TH1/17 TH1 TH17 TH1/17 DN TH1 TH17 TH1/17 DN TH1 TH17 TH1/17 0 25,000 50,000 75,000 100,000 Rel expression IL17A**
***
***
**
TH17 TH1/17 0 1000 2000 3000 4000 Rel expression p =0.19d
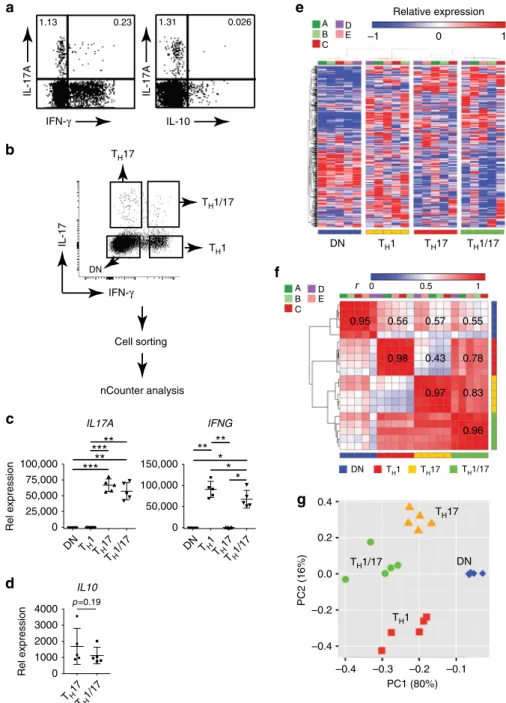
IL10 0.95 0.56 0.57Fig. 1 Transcriptionally distinct human TH17 subsets in peripheral blood.a IFN-γ and IL-10 expression in human TH17 cells. Isolated PBMCs were stimulated with PMA and ionomycin for 4 h. Production of indicated cytokines in CD4+T cells were assessed byflow cytometry with intracellular cytokine staining assay. Dotplots shown were gated on CD4+lymphocytes. Data are representative of two independent experiments with similar results.b Isolation of live TH1/17, TH17, TH1, and DN cells from human PBMC for nCounter analysis. CD4+T cells isolated from the peripheral blood of healthy donors were stimulated with PMA and ionomycin for 3 h. CD3+CD4+-T
H1/17 (IFN-γ+IL-17+), TH17 (IFN-γ−IL-17+), TH1 (IFN-γ+IL-17−), and DN (IFN-γ−IL-17−) cells were sorted after being stained withfluorescence-conjugated anti-CD3 and CD4 in combination with cytokine secretion detection kits (Miltenyi) (n = 5). b Isolated CD4+T subsets were stimulated and stained as ina. c–f CD4+T-cell subsets treated as ina were measured using the nCounter (nanoString Technologies) CodeSet HuTH17 and subsequently analyzed (hereafter abbreviated as nCounter analysis).c Differential expression analysis of mRNA levels ofIL17A and IFNG. *p < 0.05, **p < 0.005, ***p < 0.0005, One-way ANOVA with Tukey’s multiple comparison test (mean ± s.d.). d Differential expression analysis of mRNA levels ofIL10. Two tailed, paired Student’s t test p-value was shown (mean ± s.d.). The 326 out of the 418 measured genes in the HuTH17 CodeSet that showed unsupervised variation across the sample population were used fore hierarchical clustering of the individual samples (individual donors: A, B, C, D, and E),f hierarchical clustering of the Pearson’s linear correlations between the samples (individuals n = 5; individual donors: A, B, C, D, and E), andg principal component analysis of the samples (individualsn = 5)
against bacterial and fungal pathogens
7–10. T
H17 cells can be
induced to produce T
H1 and T
H2 cytokines
11and not all T
H17
cells are pathogenic. Murine T
H17 cells are pathogenic or
non-pathogenic based on their ability to induce experimental
auto-immune encephalomyelitis (EAE)
12; pathogenic T
H17 cells
express higher levels of IFN-γ while non-pathogenic T
H17 cells
produce IL-10 with IL-17
13.
As in mice, human T
H17 cells can also co-produce IFN-γ or
IL-10. IL-10-producing T
H17 cells are induced in response to
Sta-phylococcus aureus, whereas T
H17 cells induced by Candida
albicans produce IL-17 and IFN-γ. Both types of T
H17 cells are
enriched in a subset of human memory CD45RA
–CD4
+T
Hcells
expressing the chemokine receptors CCR6 and CCR4, while
IFN-γ-secreting T
H17 (T
H1/17) cells may additionally express
CXCR3
9,14. A deficiency in IL-17 or the T
H17 pathway
com-promises host defenses against S. aureus and C. albicans, and
reduces the frequency of circulating CCR6
+memory CD4
+T
Hcells
15,16. Thus both IFN-γ and IL-10-producing T
H17 cells may
be protective during infection.
IFN-γ and IL-10-producing T
H17 cells are considered
pro-inflammatory and anti-pro-inflammatory, respectively, and have
opposite functions in autoimmunity
17,18. Studies of T-cell
libraries from patients with MS showed that CCR6
+myelin-reactive T cells exhibit enhanced production of IFN-γ, IL-17, and
GM-CSF and reduced production of IL-10, when compared with
those from healthy individuals
19. In JIA, IFN-γ-secreting T
H1/17
cells are highly enriched in the synovial
fluid (SF) of inflamed
joints
20. The inflammatory environment in diseased joints can
induce IFN-γ-negative T
H17 cells to co-produce IFN-γ,
impli-cating plasticity of T
H17 cells
21. The proportions of T
H1/17-enriched CD4
+CD161
+T cells in the SF of affected joints
cor-relate with the erythrocyte sedimentation rate and serum levels of
C-reactive protein, suggesting these cells function in disease
pathogenicity
20. These and other reports of elevated numbers of
T
H1/17 cells in inflamed tissues in human autoimmune
diseases
21–23associate T
H1/17 cells with human autoimmune
diseases.
The complexity of T
H17 function is further manifested in
therapeutic studies. Although anti-IL-17 therapy benefits
psor-iasis, blocking the IL-17 pathway in Crohn’s disease is either
ineffective or exacerbates diseases
24–26. Similarly, in the
CD45RB
hiadoptive transfer mouse model of experimental colitis,
a deficiency of IL-17 production or IL-17R expression in
trans-ferred CD45RB
hiCD4 T cells results in accelerated disease
27. The
protective function of IL-17 in these studies may be due to the
fact that T
H17 cells that line the gut mucosa prevent invasion of
the gut microbiome and promote intestinal homeostasis
28. In
tumors, T
H17 cells are reported to have both beneficial
29–31and
detrimental effects
32both in animal models and human disease.
Hence, the function of T
H17 cells in diverse immune responses is
complex.
We previously reported that murine T
H17 cells can be
differ-entiated into pathogenic vs. non-pathogenic subsets, as well as
characterized the molecular signature of murine pathogenic T
H17
cells through global gene expression analysis
12. In the present
study, we compare the gene expression profiles between human
IFN-γ
+and IFN-γ
–T
H17 subsets, and between IL-10
+and IL-10
–T
H17 clones. Comparative transcriptomic analyses show that
human T
H1/17 cells and IL-10
–T
H17 clones display gene
sig-natures with marked similarities to mouse pathogenic T
H17 cells.
We then assess T
H1/17 cells in patients with MS and
find reduced
expression of anti-inflammatory IL10 and elevated expression of
CXCR3. When we compare clinically active vs. stable patients, we
find that stable patients have higher IL10 expression in T
H17 cells,
whereas active patients have higher expression of STAT3 in
IFN-γ
–/IL-17
–CD4
+T cells. Our results define the molecular
signature of human pro-inflammatory T
H17 cells, which can be
used to both identify pathogenic T
H17 cells and to measure the
effect of treatment on T
H17 cells.
Results
Transcriptionally distinct T
H17 subsets in peripheral blood.
We
first performed intracellular cytokine staining of blood CD4
+T cells and identified distinct populations of IFN-γ co-producing
T
H17 cells, but no IL-10 co-producing T
H17 cells (Fig.
1a;
Sup-plementary Fig.
1). It is known that IFN-γ
+T
H17 cells are
increased
in
inflamed tissues in human autoimmune
diseases
21–23, and are also present in the blood of healthy
indi-viduals, whereas IL-10
+T
H17 cells are barely detected
14. We
divided peripheral T
H17 cells into IFN-γ
+(T
H1/17) and IFN-γ
–(T
H17) subsets. We utilized a capture assay that separates live
CD4
+T subsets based on differential secretion of IL-17 and/or
IFN-γ to sort ex vivo T
H1/17 cells and T
H17 cells without in vitro
polarization and with only short-term (3 h) Phorbol 12-myristate
13-acetate (PMA) plus ionomycin stimulation (Fig.
1b;
Supple-mentary Fig.
2). Based on our global transcriptional analysis of
murine T
H17 cells and studies on autoimmunity from ours and
other groups, we designed a nanoString nCounter CodeSet
HuT
H17 that detects 418 genes associated with human T
Hcell
differentiation and activation. The HuT
H17 CodeSet encompasses
genes encoding transcription factors, cytokines, cell surface
markers, kinases, lytic proteins, and housekeeping proteins
(Supplementary Data
1). We used this CodeSet to generate
high-throughput transcription profiles of isolated ex vivo T
H1/17,
T
H17, T
H1, and double negative (DN) CD4
+T cells from
five
healthy donors to generate high-throughput transcription
pro-files. We found high expression of IL17A in T
H17 and T
H1/17
cells and high expression of IFNG in T
H1 and T
H1/17 cells,
whereas only minimal expression of IL17A was observed in T
H1
and DN cells and minimal expression of IFNG was observed in
T
H17 and DN cells (Fig.
1c), thus demonstrating that we isolated
pure populations of T
H1/17, T
H17, and T
H1 cells. IL10
gene expression was detected in both T
H17 and T
H1/17 cells
(Fig.
1d).
For the 20 CD4
+T-cell subset samples from the
five healthy
individuals we analyzed, 362 of the 418 genes demonstrated
unbiased variation across the population, defined as an
unsupervised expression difference (difference between
max-imum and minmax-imum relative gene expression values, not taking
into account information about the subset classes)
≥5 across all
samples, and these genes were selected for further study.
Hierarchical clustering of gene expression profiles of the 20
individual samples from the CD4
+subpopulations in the context
of these 362 unsupervised varying genes properly segregated the
T
H1/17, T
H17, T
H1, and DN cells into four different clusters,
revealing their distinct transcriptional features (Fig.
1e). The
in-group Pearson correlation values for these gene expression
profiles were high for all four CD4
+T-cell subsets and ranged
from 0.95
± 0.06 for DN cells to 0.98 ± 0.02 for T
H1 cells. Pearson
correlation values for the gene expression profiles of T
H1/17 vs.
T
H17 and T
H1/17 vs. T
H1 were 0.83
± 0.05 and 0.78 ± 0.06,
respectively, whereas the correlation coefficient for T
H17 vs. T
H1
was only 0.43
± 0.06 (Fig.
1f), which were consistent with the
degree of similarities observed among the cell subsets in the
hierarchical clustering analysis (Fig.
1e). Principal component
analysis (PCA) showed that DN cells were clearly distinct from
the other three subsets, whereas T
H1/17 cells lay in between T
H17
and T
H1 cells (Fig.
1g). These results demonstrate that human
T
H17 cells can be transcriptionally categorized into IFN-γ
+T
H17
(T
H1/17) and IFN-γ
–T
H17 (T
H17) subsets and that T
H1/17 show
Human ex vivo T
H17 subsets vs. murine T
H17 cells. Murine
T
H17 cells generated with TGF-β3/IL-6 or IL-1/IL-6/IL-23 induce
more severe EAE than T
H17 cells generated with TGF-β1/IL-6
12.
In comparing TGF-β3 vs. TGF-β1-induced murine T
H17 cells, we
defined a pathogenic transcriptional signature composed of 16
upregulated genes in TGF-β3-induced pathogenic T
H17 cells
including CCL3, CCL4, CLL5, CSF2, IL22, IL3, GZMB, STAT4,
and TBX21
12. In humans, 10 of the 16 signature genes were
upregulated in CCR6
+myelin-reactive memory CD4
+T cells in
patients with MS although these cells also displayed elevated
levels of IL10
19, while 12 genes were upregulated in T
H1/17-enriched CCR7
loCCR6
+CCR4
loCXCR3
himemory CD4
+T cells
in healthy donors compared to T
H17-enriched CCR7
loCCR6
+CCR4
hiCXCR3
locells
33(Supplementary Data
2). There are no
known unique surface markers for T
H17 cells and all of memory
CD4
+T-cell populations contain not only IFN-γ
+and IFN-γ
–T
H17 cells but also IL-17
–IFN-γ
+T
H1 cells, especially for
CCR7
loCCR6
+CCR4
loCXCR3
himemory CD4
+T cells, for which
the frequency of IL-17
–IFN-γ
+cells may be up to four times
higher than IL-17
+cells
33. Among the 14 signature genes shared
by murine T
H17 cells and human T
H17-enriched CD4
+T cells, 13
are included in the HuT
H17 CodeSet (Supplementary Data
2) and
we assessed their expression in T
H1/17, T
H17, T
H1, and DN CD4
+T cells (Fig.
2a). We found that except for LRMP, the other 12
genes were detected by the CodeSet. Compared to T
H1/17 cells,
10 of the 12 genes had comparable or higher messenger RNA
(mRNA) levels in T
H1 cells, which included CCL3, CCL4, CCL5,
GZMB, ICOS, IL3, IL7R, LAG3, STAT4, and TBX21, emphasizing
the importance of minimizing T
H1 contamination when
analyz-ing the gene signature of pro-inflammatory or pathogenic T
H17
cells. The high purity of the T
H1/17 and T
H17 cells we isolated
based on IL-17 and IFN-γ secretion allowed us to determine the
pathogenicity-associated
molecular
signature
of
human
T
H17 subsets.
We identified 60 genes differentially expressed in T
H1/17 cells
vs. T
H17 cells with 39 upregulated and 21 downregulated
(Supplementary Data
3). To test the hypothesis that the
relationship of T
H1/17 to T
H17 cells in humans is similar to
that of mouse pathogenic vs. non-pathogenic T
H17 cells, we
performed gene set enrichment analysis (GSEA)
34. The
upregu-lated and downreguupregu-lated genes in T
H1/17 cells relative to T
H17
cells were divided into two gene sets. Since both TGF-β3/IL-6 and
IL-1/IL-6/IL-23 induced mouse pathogenic T
H17 cells whereas
TGF-β1/IL-6 induced non-pathogenic T
H17 cells
12, our
first
comparison (Scenario I) explored microarray data from TGF-β3/
IL-6-induced T
H17 cells (pathogenic) vs. TGF-β1/IL-6-induced
T
H17 cells (non-pathogenic) and the second comparison
(Scenario II) explored microarray data from
IL-1/IL-6/IL-23-induced T
H17 cells (pathogenic) vs. TGF-β1/IL-6-induced T
H17
cells (non-pathogenic). GSEA results demonstrated that genes
upregulated in human T
H1/17 vs. T
H17 cells were enriched in
mouse pathogenic T
H17 cells vs. non-pathogenic T
H17 cells in
both scenarios with 17
“leading edge” genes in Scenario 1 and 19
genes in Scenario 2 (Kolmogorov–Smirnov test p < 0.0001; false
discovery rate (FDR) q
< 0.0001 for both scenarios) (upper panels
of Fig.
2b, c). The
“leading edge” subset of genes is defined as
genes that drive the enrichment scores, thus the genes that appear
in the top of the ranked list of genes at, or before, the point where
the running sum reaches the maximum deviation from zero. The
“leading edge” subset can be interpreted as the core subset of a
gene set that accounts for the enrichment signal
34. Genes
upregulated in human T
H17 vs. T
H1/17 cells were also enriched
in mouse non-pathogenic T
H17 cells vs. pathogenic T
H17 cells in
both comparison scenarios, with seven identical
“leading edge”
genes (Kolmogorov–Smirnov test p = 0.0007; FDR q = 0.001 for
Scenario I; Kolmogorov–Smirnov test p = 0.004; FDR q = 0.004
for Scenario II) (lower panels of Fig.
2b, c). The gene signatures
obtained from both scenarios were almost identical even though
the TGF-β3/IL-6-induced T
H17 cells and
IL-1/IL-6/IL-23-induced T
H17 cells were differentiated via treating naive CD4
+T cells with different cytokines, suggesting that the integrated
gene expression analysis identified common features shared by
the two types of mouse pathogenic T
H17 cells. Thus, we found
marked similarities in differential gene expression signatures
between human IFN-γ
+vs. IFN-γ
–T
H
17 cells and mouse
pathogenic vs. non-pathogenic T
H17 cells indicating that human
T
H1/17 and T
H17 cells are counterparts of murine pathogenic
and non-pathogenic T
H17 cells.
Among the 27 signature genes identified in both comparison
scenarios, 13 had an absolute fold change
>1.5 for T
H1/17 vs.
T
H17 cells, which were selected as the robust predicted
pathogenic signature (PreP-Signature) of T
H1/17 cells for later
analyses (Fig.
2d). The upregulated robust PreP-Signature genes
with pro-inflammatory/pathogenic potential can be grouped into
chemokines and cytokines (CCL3, CCL4, CCL5, CSF2, IFNG, and
IL3), chemokine and cytokine receptors (CXCR3 and IL23R),
cytokine responding genes (EPSTI1), effector proteins (GZMB),
and signaling molecules (RGS2). The downregulated genes are the
chemokine receptor (CCR6) and the transcription factor
(STAT1).
We also investigated genes not shared between human and
mouse pathogenic/non-pathogenic Th17 cells to identify other
potentially relevant genes to test in human conditions. We
identified 33 non-shared genes including 19 that were
upregu-lated and 14 that were downreguupregu-lated (Supplementary Data
4).
Human ex vivo T
H17 subsets vs. T
H17 clones. IL-10 has a
pivotal role in regulation of both innate and adaptive immunity
35and murine TGF-β1/IL-6-induced non-pathogenic T
H17 cells
produce IL-10
13. Human IL-10
+T
H17 cells are a potential
counterpart of mouse non-pathogenic T
H17 cells. However,
IL-10-secreting T
H17 cells cannot be directly isolated from human
blood for nCounter gene expression analysis because few or no
T
H17 cells produce IL-10 after PMA/ionomycin stimulation
(Fig.
1a). This is likely due to the delayed production of IL-10
after stimulation. Nonetheless, for established human T
H17
clones, IL-10
+T
H17 clones can be identified by IL-10 intracellular
staining 5 days after T-cell receptor activation
9. Thus, we
estab-lished CD4
+T cells clones from CCR6
+CCR4
+CXCR3
–memory
CD4
+T cells (Supplementary Fig.
3) that were enriched for T
H17
cells
14,18and screened for clones producing IL-17 with or without
co-secretion of IL-10. qRT-PCR showed that IL-10
–T
H17 clones
expressed high levels of IFNG, low levels of IL10, and high levels
of IL23R, whereas IL-10
+T
H17 clones expressed minimal levels of
IFNG and high levels of IL10 (Fig.
3a). To assess whether the gene
expression profile of cloned T
H17 cells maintained their pro or
anti-inflammatory features after long-term culture, we used the
HuT
H17 CodeSet to analyze the gene expression profile of IL-10
–and IL-10
+T
H17 clones. We identified 63 genes that were
dif-ferentially expressed between IL-10
–vs. IL-10
+T
H17 clones with
49 upregulated and 14 downregulated genes (Supplementary
Data
5). To compare genes differentially expressed between
human T
H1/17 vs. T
H17 cells (Supplementary Data
3) to those
between IL-10
–vs. IL-10
+T
H17 clones (Supplementary Data
5),
we assessed enrichment of overlaps between gene lists using the
hypergeometric enrichment test. We found that genes
upregu-lated in T
H1/17 vs. T
H17 cells display significant overlap with
genes upregulated in IL-10
–vs. IL-10
+T
H17 clones (one-sided
Fisher’s exact test p < 0.0001, FDR q = 0.0001) (Fig.
3b). The
upregulation of CBLB, CLL5, CXCR3, IL23R, REL, TBX21, and
TNFSF14 in IL-10
–T
H17 clones is shared by human T
H1/17 cells
and mouse pathogenic T
H17 cells (Fig.
2b, c). To identify
reg-ulatory molecules predicted to influence the differentiation/
development of T
H1/17 cells and IL-10
–T
H17 clones, we
inter-rogated genes differentially expressed between T
H1/17 vs. T
H17
cells (Supplementary Data
3) and between IL-10
–vs. IL-10
+T
H17
clones (Supplementary Data
5) for upstream regulator prediction
analysis in ingenuity pathway analysis (IPA). T
H1/17 cells and
IL-10
–T
H17 clones displayed a similar pattern of the activation of
signaling pathways involved in T
H17 differentiation/development
(Fig.
3c), especially for activation of IL-1β signaling, which is
critical to promote co-producing IFN-γ and to inhibit IL-10
production in T
H17 cells
9. These results demonstrate the
simi-larities between T
H1/17 vs. T
H17 cells and IL-10
–vs. IL-10
+T
H17
clones, and also indicate that IL-10
–and IL-10
+T
H17 clones
maintained their pro- or anti-inflammatory characteristics after
long-term culture.
0 1000 2000 3000 4000 Rel expression CCL3 * 0 10,000 20,000 30,000 40,000 CCL4 * ** ** ** ** 0 500 1000 1500 2000 CCL5 * ** ** ** ** ** 0 5000 10,000 15,000 20,000 CSF2 * ** **** 0 2000 4000 6000 8000 IL3 0 1000 2000 3000 4000 IL7R* ** ** 0 20 40 60 80 100 Rel expression LAG3* ** ** ** 0 25 50 75 100 LRMP 0 400 800 1200 STAT4* ** **** 0 500 1000 1500 TBX21* **** ** DN TH1 TH17 TH1/17 DN TH1 TH17 TH17 TH1/17 TH1/17 TH17 TH1/17 DN TH1 TH17 TH1/17 DN TH1 TH17 TH1/17 DN TH1 TH17 TH1/17 0 2500 5000 7500 10,000 GZMB* ** ** ** ** 0 600 1200 1800 2400 Rel expression ICOS* 0 40,000 80,000 120,000 IL22* ** ** ** ** ** Human Mouse TGFβ1 IL-1/6/23b
Human Mousec
TGFβ1 CBLB CCL4 CCL5 CSF2 CXCR3 EPSTI1 IFNG IL2 IL22 IL23R IL3 REL RGS2 SLAMF1 STAT4 TBX21 TNFSF14 AHR ANTXR2 CCR6 IFNGR2 IGSF3 NETO2 STAT1 CBLB CCL3 CCL4 CCL5 CSF2 CXCR3 EGR3 EPSTI1 GZMB IFNG IL2 IL22 IL23R IL3 REL RGS2 SLAMF1 STAT4 TBX21 AHR ANTXR2 CCR6 IFNGR2 IGSF3 NETO2 STAT1 TGFβ3 –1 0 1 –1 0 1d
a
IFNGCCL5CCL4CCL3EPSTI1GZMB IL3CXCR3RGS2CSF2IL23RSTA T1 CCR6 –5 0 5 10 15 20 80 100 120 *** * ** ** ** ** * * * * * * * Expression (fold) (TH 1/17 vs. TH 17) Relative expression Relative expression
Human T
H17 clones vs. murine T
H17 cells. We performed
GSEA to investigate the similarity between human T
H17 clones
and mouse T
H17 cells. The upregulated and downregulated genes
in IL-10
–T
H17 clones relative to IL-10
+T
H17 clones T
H17 cells
were divided into two gene sets (Supplementary Data
5) to
explore the enrichment of the gene sets in Scenarios I and II
(defined above). GSEA showed that genes upregulated in IL-10
–vs. IL-10
+T
H17 clones were enriched in mouse pathogenic vs.
non-pathogenic T
H17 cells in both scenarios, with 17
“leading
edge” genes in Scenario I (Kolmogorov–Smirnov test p = 0.004;
FDR q
= 0.005) and 14 “leading edge” genes in Scenario II
(Kolmogorov–Smirnov test p = 0.005; FDR q = 0.010). Among
the
“leading edge” genes, 11 overlapped between both scenarios
(upper panels of Fig.
3d, e). Genes upregulated in human IL-10
+vs. IL-10
–T
H17 clones were also enriched in mouse
non-pathogenic vs. non-pathogenic T
H17 cells in both scenarios, with six
“leading edge” genes in Scenario I (Kolmogorov–Smirnov test
p
= 0.004; FDR q = 0.003) and seven “leading edge” genes in
Scenario II (Kolmogorov–Smirnov test p = 0.016; FDR q = 0.009).
Among the
“leading edge” genes, six genes were represented in
both scenarios (lower panels of Fig.
3d, e). These results
demonstrate extensive similarities between human IL-10
–vs.
IL-10
+T
H17 clones and mouse pathogenic vs. non-pathogenic T
H17
cells.
T
H17 PreP-signatures predict STAT3 as an upstream regulator.
Integrated analysis of gene expression profiles of human ex vivo
T
H17 cells, human T
H17 clones, and cytokine-induced mouse
T
H17 cells resulted in four sets of gene signatures associated with
the pathogenicity of T
H17 cells (Figs.
2,
3). We merged the
“leading edge” genes from the above GSEA comparisons and
consolidated these four gene signatures into one complete
PreP-Signature for human ex vivo T
H17 cells with 27 signature genes
and one complete PreP-Signature for human T
H17 clones with
26 signature genes. Among the signature genes upregulated in
human T
H1/17 cells and IL-10
–T
H17 clones, seven genes were
shared by both types of T
H17 cells, while for downregulated
genes, two genes overlapped between T
H1/17 cells and IL-10
–T
H17 clones (Fig.
4a). Since our molecular signatures derive from
integrated analysis of pro-inflammatory human T
H17 cells with
mouse pathogenic T
H17 cells in autoimmunity, they reduce the
number of potential targeting genes and also help define human
T
H17 cells with potential pathogenicity in autoimmunity.
We interrogated the complete PreP-Signatures of ex vivo T
H1/
17 cells and IL-10
–T
H17 clones for upstream transcription factor
prediction analysis using the Enrichr ChEA2016 analysis
36,37.
STAT3 in CD4
+T cells was the top predicted transcription factor
common for both resulting lists (Fig.
4b; Supplementary Datas
6,
7) and thus may regulate the pathogenicity of human T
H17 cells
in autoimmune diseases.
Investigation of PreP-Signature genes in multiple sclerosis. To
investigate PreP-Signature genes in human pro-inflammatory
T
H17 cells in MS, we isolated T
H1/17 and T
H17 cells from
untreated patients with relapse-remitting MS (RRMS) and age
and sex-matched healthy controls (Table
1; Supplementary
Fig.
2), assessed frequencies of T
H1/17 and T
H17 cells, and
measured the expression of the PreP-Signature genes. T
H1 and
DN cells were isolated in parallel as internal controls. Of 19
patients with RRMS, sufficient RNA for quantitative PCR (qPCR)
analysis was obtained from 15 T
H1/17 samples, 18 T
H17 samples,
19 T
H1 samples, and 19 DN samples. Of 16 healthy controls, we
obtained sufficient RNA for qPCR analysis from 16 T
H1/
17 samples, 14 T
H17 samples, 16 T
H1 samples, and 16 DN
samples. We found no difference in frequency of T
H1/17, T
H17,
and total T
H17 cells among total CD4
+T cells in patients vs.
controls (Fig.
5a). The percentage of T
H1/17 in total T
H17 cells
was also similar (Fig.
5b). To assess purity of isolated cell subsets,
we measured the expression of IL17 and IFNG by qPCR. We
detected high levels of IL17 in T
H1/17 and T
H17 cells but not in
DN cells (Supplementary Fig.
4a), and high levels of IFNG in
T
H1/17 cells but not in T
H17 and DN cells (Supplementary
Fig.
4b), demonstrating that the isolated populations were of high
purity. In both groups, IL17 expression was higher in T
H17 vs.
T
H1/17 cells (Supplementary Fig.
4a), whereas IL17 expression
was similar for T
H1/17 and T
H17 cells (Fig.
5c). To validate the 13
robust PreP-Signature genes identified via the nCounter analysis,
we measured their expression in T
H1/17 and T
H17 cells in healthy
controls by qPCR (Fig.
5d, left). For the 11 genes upregulated in
T
H1/17 cells, 9 were confirmed; the 2 downregulated genes were
not validated. In MS, the nine validated genes displayed the
similar upregulated expression pattern (Fig.
5d, right). Thus, the
transcriptional regulation of the nine validated robust
PreP-Signature genes of T
H1/17 cells was tightly associated with IFN-γ
secretion in both controls and MS. These results indicate that
studying frequency or number of IFN-γ-secreting T
H17 cells may
not identify important biological differences.
We investigated differences between MS and control using the
robust PreP signature genes we identified above. We first measured
the expression of the 13 robust PreP-Signature genes in T
H1/17 cells
in MS and found elevated expression of CXCR3 and reduced
expression of IFNG, CCL3, CLL4, and GZMB (Fig.
6a). In T
H17
cells, GZMB showed reduced expression in MS (Fig.
6b). No
difference was observed between MS and controls in T
H1 cells
(Supplementary Fig.
5). Thus, the altered expression of these
five
PreP-Signature genes are specific for T
H1/17 and T
H17 subsets, but
not for T
H1 cells. We then measured the expression of TBX21 and
IL10, since we found downregulation of TBX21 and upregulation of
IL10 in IL-10
+T
H17 clones (Fig.
3a, d). We found TBX21
expression elevated in T
H1/17 relative to T
H17 cells in MS and
controls (Fig.
6c, upper panel), with no difference in IL10
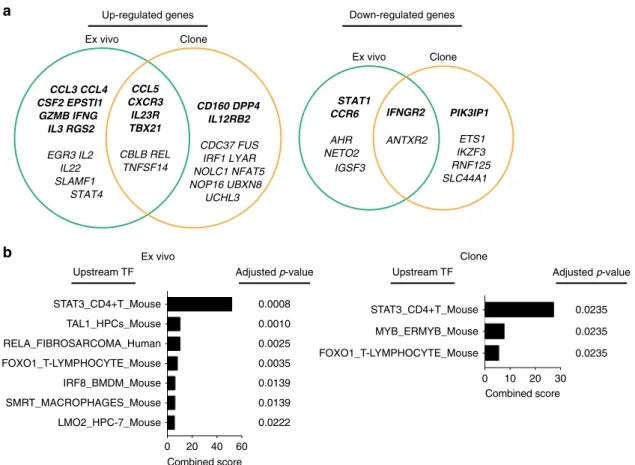
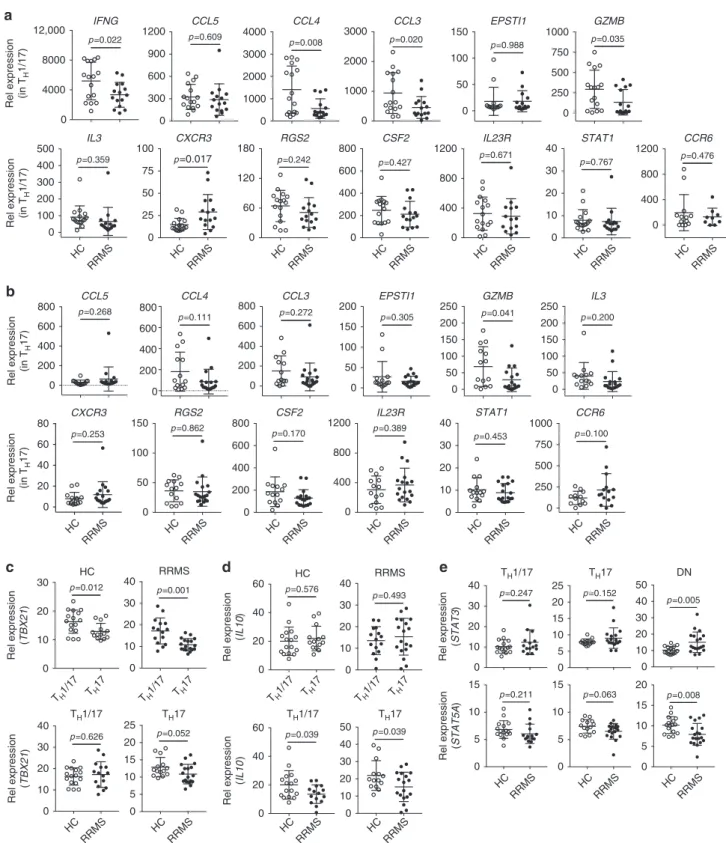
Fig. 2 Gene expression comparison between human TH1/17 vs. TH17 cells and mouse pathogenic vs. non-pathogenic TH17 cells.a The expression of previously reported murine and human TH17 signature genes in purified ex vivo TH1 cells. The mRNA gene expression levels in TH1/17, TH17, TH1, and DN cells were measured as described in Fig.1. *p < 0.05, repeated measures one-way ANOVA; **p < 0.05, pairwised group comparison with Tukey’s multiple comparison test (mean± s.d., n = 5). b, c Gene set enrichment analysis comparing human TH1/17 vs. TH17 cells with mouse pathogenic vs. non-pathogenic TH17 cells.b Heatmap of upregulated (upper panels) and downregulated (lower panels)“leading edge” genes of comparison Scenario 1: human TH1/17 vs. TH17 cells vs. mouse TGF-β3 plus IL-6-induced TH17 cells vs. TGF-β1 plus IL-6-induced TH17 cells (Kolmogorov–Smirnov test p < 0.0001; FDR q < 0.0001 for upregulated genes; Kolmogorov–Smirnov test p = 0.0007; FDR q = 0.001 for downregulated genes). c Heatmap of upregulated (upper panels) and downregulated (lower panels)“leading edge” genes of comparison Scenario 2: human TH1/17 vs. TH17 cells vs. mouse IL-1, IL-23 plus IL-6-induced TH17 cells vs. TGF-β1 plus IL-6-induced TH17 cells (Kolmogorov–Smirnov test p < 0.0001; FDR q < 0.0001 for upregulated genes; Kolmogorov–Smirnov test p = 0.004; FDRq = 0.004 for downregulated genes). Each column represents one donor in human (n = 5) or one sample in murine (n = 4). d The robust predicted pathogenic signature (PreP-Signature) of human TH1/17 cells. Signature genes are those identified as differentially expressed between human TH1/17 and TH17 cells that are identified as enriched “leading edge” genes when assessing these human genes in the mouse profiles in b, c and that are additionally curated for robustness based on supervised absolute fold change>1.5. Two tailed, paired Student’s t test p-value < 0.05. *p < 0.05, **p < 0.05, ***p < 0.0005, n = 5expression (Fig.
6d, upper panel). However, when we compared
T
H1/17 and T
H17 cells between MS and controls, IL10 was reduced
in T
H1/17 and T
H17 cells in patients (Fig.
6d, lower panel), though
no difference was detected with TBX21 expression (Fig.
6c, lower
panel). The predicted upstream transcription factor STAT3 was
elevated in the DN cells in MS (Fig.
6e, upper panel), while the
expression of its antagonistic transcription factor STAT5A
38–40was
reduced (Fig.
6e, lower panel).
Thus, the altered expression of
five PreP-Signature genes for
T
H1/17 cells in MS (CXCR3, IFNG, CCL3, CLL4, and GZMB) is
T
H17-specific. The low expression of IL10 in CXCR3
hiT
H1/17
cells in MS suggests these pro-inflammatory cells may more
readily migrate to central nervous system (CNS) since CXCL10
(IP-10), a ligand for CXCR3, is increased in the inflamed CNS in
MS
41–44. It has been suggested that STAT3 facilitates T
H17
differentiation and STAT5 facilitates Treg differentiation
38–40,
b
TH17 TH1/17 Ex vivo IL-10+ IL-10– Clone AHI1 CBLB CCL5 CTPS CXCR3 DUSP5 EGR-2 FASLG HSPH1 IL23R MALT1 REL TBX21 TNFSF14a
–2 0 2 4 IL-10 PI3K (complex) NFkB (complex) IL-21 IL-18 IL-12 (complex) IL-1B Activation z -score Ex vivo Clonec
Clone CBLB CCL5 CD160 CDC37 CXCR3 DPP4 FUS IL12RB2 IL23R IRF1 LYAR NFAT5 NOP16 REL TBX21 TNFSF14 UCHL3 ANTXR2 ETS1 IFNGR2 IKZF3 RNF125 SLC44A1 CBLB CCL5 CXCR3 DPP4 FUS IL12RB2 IL23R IRF1 LYAR NOLC1 NOP16 REL TBX21 UBXN8 PIK3lP1 ANTXR2 ETS1 IFNGR2 IKZF3 RNF125 SLC44A1IL-10+ IL-10– IL-10+ IL-10–
Mouse TGFβ1 TGFβ3
d
–1 0 1 –1 0 1 Relative expression –1 0 1 Relative expression Relative expression Clone Mouse TGFβ1e
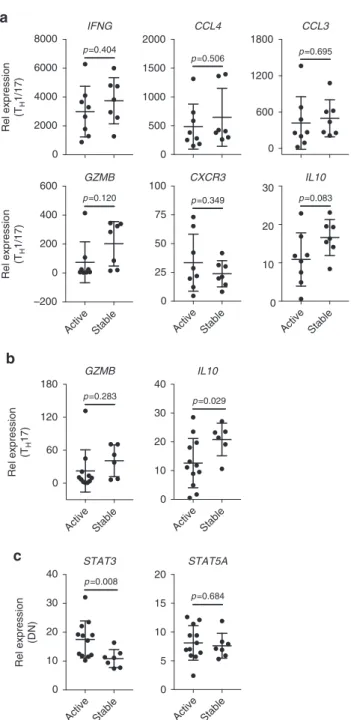
IL-1/6/23 Upstream regulator IL-10 – IL-10 + IL-10 – IL-10 + 0 100 200 300 400 Rel expression p =0.064 IFNG 0 10 20 30 p =0.032IL23R 0 4000 8000 12000 Rel expression p =0.207 IL17A 0 1000 2000 3000 p =0.025 IL10which is consistent with our observation of their expression in
DN cells in MS.
We then investigated whether the PreP-Signature genes, which
had altered expression in MS, were linked to disease activity in
MS. Disease activity was defined as a gadolinium-enhancing
lesion on magnetic resonance imaging (MRI) or disease relapse
within 6 months to the time of blood sampling. All patients were
untreated at the time of blood sampling. From 12 active patients,
we obtained sufficient RNA for qPCR from 8 T
H1/17 samples, 12
T
H17 samples, and 12 DN samples. From seven stable patients,
we obtained sufficient RNA for qPCR from 7 T
H1/17 samples, 6
T
H17 samples, and 7 DN samples. We found reduced expression
of IL10 in T
H17 cells (primarily in T
H1/17 cells) and increased
expression of STAT3 in DN cells in active patients with RRMS
(Fig.
7). Given the facilitating role of STAT3 in T
H17
differentiation and the anti-inflammatory function of IL-10,
these results together with the altered expression of CXCR3,
IFNG, CCL3, CLL4, GZMB, IL10, STAT3, and STAT5A in MS
(Fig.
6) are consistent with an important role for T
H17
cells in MS.
Discussion
We found human IL-17-secreting CD4
+helper T cells were
dis-tinct from T
H1 cells, and could be transcriptionally segregated
into IFN-γ
+T
H
17 (T
H1/17) and IFN-γ
–T
H17 (T
H17) subsets. On
a transcriptional level, T
H1/17 cells have features of both T
H17
and T
H1 cells. In addition to IFN-γ, T
H1/17 cells expressed
ele-vated levels of the pro-inflammatory molecules CCL3, CCL4,
CCL5, granzyme B, IL-3, IL-22, GM-CSF, STAT1, T-bet, and
IL-23R, which are pathogenic signature genes of mouse T
H17
cells
12. These results not only transcriptionally segregate human
T
H1/17 cells from other T
H17 cells, but also indicate that these
cells have acquired pro-inflammatory properties similar to
mur-ine pathogenic T
H17 cells. This provided the foundation for the
cross-species comparative transcriptomic analysis between mouse
and human.
We compared the gene expression profiles of human T
H1/17
cells vs. T
H17 cells with mouse pathogenic vs. non-pathogenic
T
H17 cells via GSEA and found human T
H1/17 vs. T
H17 cells
displayed gene expression signatures that were enriched in mouse
pathogenic vs. non-pathogenic T
H17 cells. We obtained similar
results in comparing human IL-10
–vs. IL-10
+T
H17 clones with
and mouse pathogenic vs. non-pathogenic T
H17 cells. Through
this integrated analysis, we identified gene expression features to
support the hypothesis that T
H1/17 cells are the pathogenic T
H17
population in immune-mediated human disease.
The PreP-Signature genes derived from comparative
tran-scriptional analysis of human and mouse studies identify genes
shared between human T
H1/17 vs. T
H17 cells or between human
IL-10
–vs. IL-10
+T
H17 clones and mouse pathogenic vs.
non-pathogenic T
H17 cells. We obtained a robust PreP-Signature for
T
H1/17 cells of 13 genes and assessed them in MS. We
find that
T
H1/17 cells in patients with MS have elevated expression of
CXCR3 and reduced expression of IL10. It has been shown that
CXCL10 (IP-10), a ligand for CXCR3, is increased in the inflamed
CNS of MS
41–44. Given that IL-10 is a potent anti-inflammatory
cytokine, this combination may facilitate migration of more
pro-inflammatory CXCR3
hiIL-10
lowT
H
1/17 cells to the inflamed
CNS. However, it is unexpected to observe reduced expression of
signature genes IFNG, CCL3, CLL4, and GZMB in T
H1/17 cells in
MS vs. healthy controls, especially the reduced expression of
IFNG. Natalizumab, a humanized monoclonal antibody targeting
α4 integrin used in the treatment of MS, functions by preventing
immune cells from crossing the blood–brain barrier
45. A study
has shown that both natalizumab treated and untreated patients
during relapse have lower frequencies of T
H17 cells in peripheral
blood compared to stable patients. Moreover, T
H17 cells become
almost undetectable in patients with breakthrough disease that
occurs following natalizumab withdrawal
46. Thus, one
explana-tion for reduced expression of IFNG, CCL3, CLL4, and GZMB in
T
H1/17 cells in MS could be that migration of cells to the CNS
removes CXCR3 high, active T
H1/17 cells from the blood.
Another possibility may be that expression of IFN-γ ensures high
expression of CXCR3, which is critical for cells to migrate to
inflamed CNS, and reduced IFN-γ may indicate the further
enhancement of the pathogenicity of IL-10
loT
H17 cells in MS.
IFN-γ-stimulation is required for CXCR3 induction on T cells
upon T-cell receptor stimulation
47. Although counter-intuitive,
the potent pro-inflammatory T
H1 cytokine IFN-γ is protective
during EAE induction
48–50. It suppresses EAE induction by
inhibiting generation of T
H17 cells
51, converting CD4
+CD25
–T cells to CD4
+Tregs
52and limiting myelin lipid peroxidation in
CNS
53. IFN-γ is dispensable for generation of pathogenic T
H17
cells, however, T-bet the transcription factor for T
H1 was initially
considered essential due to the high resistance of Tbet
−/−mice to
EAE
54,55. Later studies show that T-bet is essential for T
H1 but
not T
H17-mediated EAE
56,57. Studies in Tbet
−/−mice have shown
that reduced IFN-γ in T
H17 cells does not affect their
patho-genicity though the conversion of T
H17 cells to T
H1/17 cells as
well as T
H1-like IFN-γ
+ex-T
H17 cells is prevented
56,58,59.
Interrogating the PreP-Signatures for the identification of
upstream regulators and transcription factors
36,37, we identified
STAT3 as the top predicted upstream transcription factor from
Fig. 3 Gene expression comparison between human TH1/17 vs. TH17 cells and IL-10–vs. IL-10+TH17 clones.a Quantitative RT-PCR analysis of gene expression in human IL-10–and IL-10+TH17 clones isolated from healthy donors (two tailed, paired Student’s t test, mean ± s.d., n = 3). For IFNG, IL17A, and IL23R, resting TH17 clones were stimulated with anti-CD3 and anti-CD28 for 4 h before RNA extraction. ForIL10, resting TH17 clones were stimulated with anti-CD3 and anti-CD28 for 5 days, then cells were re-stimulated with anti-CD3 and anti-CD28 for 4 h before RNA extraction.b Hypergeometric enrichment test between human TH1/17 vs. TH17 cells and IL-10–vs. IL-10+TH17 clones. Genes differentially expressed between human TH1/17 and TH17 cells (Supplementary Data3) were analyzed for enrichment in those of human IL-10–vs. IL-10+TH17 clones (Supplementary Data5). Heatmap shows the overlapping genes (one-sided Fisher’s exact test p < 0.0001, FDR q = 0.0001). Each column represents one donor (n = 5). c Predicted upstream regulators for TH1/17 and IL-10–TH17 clone differentiation. The differentially expressed genes with corresponding fold changes andp-values from the TH1/17 vs. TH17 comparison (Supplementary Data3) and IL-10–vs. IL-10+TH17 clone comparison (Supplementary Data5) were analyzed using the IPA upstream regulator analysis. Ex vivo, TH1/17 vs. TH17 comparison; Clone, IL-10–vs. IL-10+TH17 clone comparison.d, e Gene set enrichment analysis comparing human IL-10– vs. IL-10+TH17 clones with mouse pathogenic vs. non-pathogenic TH17 cells.d Heatmap of upregulated (upper panels) and downregulated (lower panels) “leading edge” genes of comparison Scenario 1: human IL-10–vs. IL-10+T
H17 clones vs. mouse TGF-β3 plus IL-6-induced TH17 cells vs. TGF-β1 plus IL-6-induced TH17 cells (Kolmogorov–Smirnov test p = 0.004; FDR q = 0.005 for upregulated genes; Kolmogorov–Smirnov test p = 0.004; FDR q = 0.003 for downregulated genes).e Heatmap of upregulated (upper panels) and downregulated (lower panels)‘‘leading edge” genes of comparison Scenario 2: human IL-10–vs. IL-10+TH17 clones vs. mouse IL-1, IL-23 plus IL-6-induced TH17 cells vs. TGF-β1 plus IL-6-induced TH17 cells (Kolmogorov–Smirnov test p = 0.005; FDR q = 0.010 for upregulated genes; Kolmogorov–Smirnov test p = 0.016; FDR q = 0.009 for downregulated genes). Each column represents one donor in human (n = 5) or one sample in murine (n = 4)
previous studies in CD4
+T cells, which suggests that STAT3 may
regulate the pathogenesis of human T
H17 cells in autoimmune
diseases. It has been reported that STAT3 is a critical regulator for
the induction of T
H17 cells in humans. Humans with a genetic
defect in STAT3 expression not only have reduced expression of
T
H17 without any impact on other T-cell subsets, but also
develop a hyper-IgE syndrome with severe infections of
C. albicans and S. aureus
60,61. STAT3 and STAT5 are a pair of
mutual restraint transcription factors that regulate T
H17 and Treg
differentiation with STAT3 facilitates T
H17 differentiation and
STAT5 facilitates Treg differentiation
38–40. We thus investigated
the expression of STAT3 and STAT5A in MS. We found
upre-gulation of STAT3 and downreupre-gulation of STAT5A in DN cells
from patients with MS, which included naive and other memory
CD4
+T cells but not T
H1/17, T
H17, and T
H1 cells. One
expla-nation for the different behavior of STAT3 and STAT5A between
DN vs. T
H1/17 and T
H17 cells is that STAT3 may be critical for
T
H17 differentiation but not required for T
H17-associated
immunopathology after differentiation.
Leveraging comparative transcriptomic approaches, we
inte-grated gene expression profiles derived from human and mouse
T
H17 cells to identify pathogenicity-associated signature
(PreP-Signature) genes that are shared by human pro-inflammatory
T
H17 cells and mouse pathogenic T
H17 cells, and to predict the
upstream regulators or transcription factors that may be critical
for the differentiation of human pro-inflammatory T
H17 cells.
These comparative transcriptomic analyses allowed us to identify
altered gene expression associated with T
H17 subsets and their
differentiation in subjects with MS and to identify associations of
the expression of STAT3 in DN cells and IL10 in T
H17 cells that
are dependent on MS disease activity. Of note, we used a
nCounter codeset with a limited set of pre-selected 418 genes,
which may miss other disease related, highly discriminant genes
in humans. Thus, follow-up studies, such as RNA-sequencing
analysis on T
H17 and T
H1/17 subsets isolated from MS patients,
may help to identify more disease-related genes.
b
a
Ex vivo CCL5 CXCR3 IL23R TBX21 CBLB REL TNFSF14 Clone CD160 DPP4 IL12RB2 CDC37 FUS IRF1 LYAR NOLC1 NFAT5 NOP16 UBXN8 UCHL3 CCL3 CCL4 CSF2 EPSTI1 GZMB IFNG IL3 RGS2 EGR3 IL2 IL22 SLAMF1 STAT4 Ex vivo IFNGR2 ANTXR2 Clone PIK3IP1 ETS1 IKZF3 RNF125 SLC44A1 STAT1 CCR6 AHR NETO2 IGSF3Up-regulated genes Down-regulated genes
Clone Adjusted p-value 0 10 20 30 FOXO1_T-LYMPHOCYTE_Mouse MYB_ERMYB_Mouse STAT3_CD4+T_Mouse Combined score 0.0235 0.0235 0.0235 Upstream TF Ex vivo Adjusted p-value 0 20 40 60 LMO2_HPC-7_Mouse SMRT_MACROPHAGES_Mouse IRF8_BMDM_Mouse FOXO1_T-LYMPHOCYTE_Mouse RELA_FIBROSARCOMA_Human TAL1_HPCs_Mouse STAT3_CD4+T_Mouse Combined score Upstream TF 0.0008 0.0010 0.0025 0.0035 0.0139 0.0139 0.0222
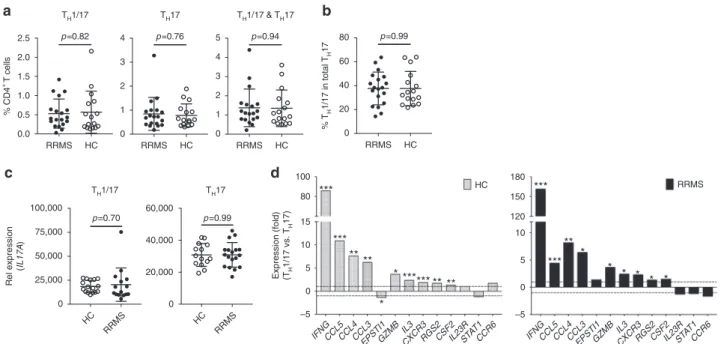
Fig. 4 Predicting STAT3 as upstream transcription factor by the PreP-Signatures of TH17 cells.a Venn diagram representations of signature genes upregulated (left) and downregulated (right) in human TH1/17 cells and IL-10–TH17 clones. Complete PreP-Signatures from GSEA comparison Scenarios I and II were merged for ex vivo cells (Fig.2b, c) and TH17 clones (Fig.3d, e), respectively. Genes with supervised absolute fold change>1.5 in either ex vivo cells or TH17 clones were shown in italic bold letters. Ex vivo, differentially expressed“leading edge” genes from TH1/17 vs. TH17 GSEA comparisons presented in green circles; Clone, differentially expressed“leading edge” genes from IL-10–vs. IL-10+T
H17 clone GSEA comparisons presented in yellow circles.b Predicted upstream transcription factors for TH1/17 and IL-10–TH17 clone differentiation. The molecular signatures of TH1/17 cells and IL-10–TH17 clones ina were analyzed using the Enrichr ChEA2016 analysis and the predicted transcription factors with Benjamini–Hochberg adjusted p-value <0.05 were shown. TF transcription factor
Table 1 Demographics of patients with multiple sclerosis
and healthy controls
RRMS patients Healthy controls
Participants,n 19 16 Gender f/m,n 15/4 13/3 Female Age, y 46± 12 48± 11 Male Age, y 41± 9 42± 8
Disease duration, y 10± 10 n.a.
EDSS 2.0± 1.2 n.a.
EDSS expanded disability status scale ranging from 0 to 10, n.a. not applicable, RRMS untreated relapsing-remitting multiple sclerosis
In summary, our study demonstrates that human T
H1/17 cells
and IL-10
−T
H17 clones display significant similarities to mouse
pathogenic T
H17 cells in their transcriptomic patterns. The
ele-vated expression of pro-inflammatory cytokines and chemokines
in human IFN-γ-secreting T
H17 cells and the similarity in gene
expression profiles between human IFN-γ-secreting T
H17 cells
and mouse pathogenic T
H17 cells indicates a higher
pro-inflammatory capacity of human T
H1/17 cells and additionally
provides transcriptional evidence to support the role of human
T
H1/17 in the pathogenesis of human autoimmune diseases. The
differential molecular signature of human IFN-γ-secreting T
H17
cells that we identified provides a new tool that can be utilized to
assess T
H17 cells both under physiologic conditions and in
association with disease.
Methods
Reagents. EasySep human CD4+T-cell enrichment kit (catalog number 19052) for CD4+T-cell isolation was purchased from StemCell Technologies. FITC-conjugated human IFN-γ (clone, B27; 1:100), Alexa 647-FITC-conjugated anti-human IL-17A (clone, N49-653; 1:20), PE-conjugated anti-anti-human IL-10 (clone, JES3-19F; 1:660), and their corresponding isotype control antibodies for intracel-lular cytokine staining assay were purchased from BD Biosciences. IFN-γ cytokine secretion detection kit (APC) (catalog number 130-090-762) and IL-17 cytokine secretion detection kit (PE) (catalog number 130-094-537) were purchased from Miltenyi Biotec. nCounter CodeSet HuTH17 was custom designed and manu-factured by nanoString Technologies. Fluorescence-conjugated antibodies for cell surface staining forflow cytometry were purchased from Biolegend. RNAqeous micro total RNA isolation kit (catalog number AM1931), SuperScript VILO master mix (catalog number 11755050), TaqMan preAmp master mix (catalog number 4391128), TaqMan fast universal PCR master mix (2x) (catalog number 4352042), and qPCR primers (Supplementary Data8) were purchased from ThermoFisher Scientific.
Human subjects. Blood samples for TH17 cloning from healthy donors were obtained from the Swiss Blood Donation Center of Basel and Lugano. Informed, written consent was obtained from all donors. All uses of human material were approved by the Federal Office of Public Health (authorization no. A000197/2 to F. S.). Blood samples from MS patients and healthy controls were obtained from the Partners MS Center at Brigham and Women’s Hospital under IRB Protocol
2001P001431 and 2014P000124. Informed, written consent was obtained from all donors. MS patients were untreated for a minimum of 6 months before sampling. Disease activity was identified as a gadolinium-enhancing lesion on MRI or disease relapse within 6 months of sampling. Age- and sex-matched healthy donors did not have history of autoimmune diseases or malignancies and no acute or chronic infections. The samples from healthy donors for nCounter gene expression analysis were fresh blood samples. The MS samples and age- and sex-matched healthy control samples were frozen peripheral blood mononuclear cells (PBMCs). Intracellular cytokine staining. For intracellular cytokine staining for PBMC or CD4+T cells, assays were carried out with staining buffers and antibodies from BD Biosciences. Briefly, cells were seeded into a 96-well plate (up to 1 × 10⁶cell per well) and stimulated with PMA (100 ng/ml) and ionomycin (1μg/ml) in the pre-sence of GolgiStop for 4 h. After stimulation, cells werefixed with BD Cytofix fixation buffer and washed with BD Perm/Wash buffer. Cells in each well were equally divided into two wells, with one for intracellular cytokine staining and the other for isotype control staining. The followingfluorophore-conjugated antibodies from BD Biosciences were used for staining analysis or as isotype controls: anti-CD4-pacific blue (clone: RPA-T4; 1:330), anti-IL-17A-Alexa647 (clone: N49-653; 1:20), anti-IFN-γ-FITC (clone: B27: 1:100), anti-IL-10-PE (clone: JES3-19F: 1:660), mouse IgG1-Alexa647 (clone: 21; 1:40), mouse IgG1-FITC (clone: MOPC-21; 1:100), and rat IgG2a-PE (clone: R35-95: 1:660). Stained cells were analyzed with a BD LSR II cytometer. Cytokine secretion in CD4+lymphocytes was accessed with FlowJo.
Isolation of viable THsubsets from human PBMC. PBMC isolated with Ficoll-Pague PLUS (GE Healthcare) gradient centrifugation from the peripheral blood of healthy donors. Total CD4+T cells were purified with the EasySep human CD4+ T-cell enrichment kit (StemCell Technologies). CD4+T cells seeded in a 96-well plate (1 × 10⁶cells/well) were stimulated with PMA (30 ng/ml) and ionomycin (1μg/ml) for 3–4 h (3 h for fresh blood samples and 4 h for frozen PBMC samples). Viable TH1/17, TH17, TH1, and DN cells were sorted with a FACSAria (BD Biosciences) after being stained with IFN-γ and IL-17 cytokine secretion detection kits (Miltenyi Biotec) andfluorescence-conjugated anti-CD3 and anti-CD4 antibodies following the manufacturer’s suggested protocol.
Isolation of human IL-10−and IL-10+TH17 clones. PBMC were isolated by Ficoll-Paque PLUS (GE Healthcare) separation. CD4+T cells were isolated from PBMC by positive selection using CD4 magnetic microbeads (Miltenyi Biotec). CCR6+ CCR4+CXCR3–CD45RA–CD25–CD8–CD14–CD19–CD56–(enriched in T
H17
cells) memory CD4 T cells were sorted with a FACSAria (BD Biosciences) and
a
d
RRMS HC 0.0 0.5 1.0 1.5 2.0 2.5 % CD4 + T cells TH1/17 TH1/17 p=0.82 RRMS HC 0 1 2 3 4 TH17 TH17 p=0.76 RRMS HC 0 1 2 3 4 5 TH1/17 & TH17 p=0.94 RRMS HC 0 20 40 60 80 % T H 1/17 in total TH 17 p=0.99b
c
IFNGCCL5CCL4CCL3 EPSTI1GZMB IL3 CXCR3RGS2CSF2IL23RST AT1 CCR6 –5 0 5 10 15 80 100 *** ** *** * HC * *** ** ******* IFNGCCL5CCL4CCL3 EPSTI1GZMB IL3 CXCR3RGS2CSF2IL23RST AT1 CCR6 –5 0 5 10 120 150 180 *** * ** * *** * * * * RRMS Expression (fold) (TH 1/17 vs. TH 17) HC RRMS 0 25,000 50,000 75,000 100,000 p=0.70 HC RRMS 0 20,000 40,000 60,000 p=0.99 Rel expression (IL17A )Fig. 5 Frequency of TH17 subsets and differential expression of PreP-Signature genes in TH1/17 vs. TH17 cells in MS. Peripheral CD4+T cells isolated from the PBMC of untreated RRMS patients (n = 19) and age- and sex-matched healthy controls (HC) (n = 16) were stimulated, stained, and sorted for TH1/17, TH17, TH1, and DN cells as described in Fig.2b. RNA isolated from sorted cell subsets was subjected to low-input qPCR analysis.a Frequencies of TH1/17, TH17, and total TH17 cells in total peripheral CD4+T cells (Welch’s t test, p-values, mean ± s.d.). b Frequency of TH1/17 in total TH17 cells (Welch’s t test, mean± s.d.). c, d qPCR analysis of gene expression in isolated CD4+T-cell subsets.c Comparison ofIL17A expression between HC and patients in TH1/17 or TH17 cells (Welch’s t test, mean ± s.d.). d Differential expression of PreP-Signature genes between TH1/17 vs. TH17 cells in HC and MS patients. Two tailed, paired Student’s t test, *p < 0.05, **p < 0.001, ***p < 0.0001
seeded at 0.6 cells per well in a 384 well plate. The following antibodies were used for FACS-based sorting: anti-CD45RA-Qdot655 (Life Technologies; clone: MEM-56; 1:1000); anti-CCR7-BV421 (Biolegend; clone: G043H7; 1:80); anti-CCR6-PE (BD Biosciences; clone: 11A9; 1:80) or anti-CCR6-BV605 (Biolegend; clone: G034E3; 1:60); CCR4-PECy7 (BD Biosciences; clone: 1G1; 1:100); CXCR3-PE-Cy5 or CXCR3-APC (BD Biosciences; clone: 1C6; 1:20);
anti-CD8-FITC or anti-CD8-PE-Cy5 (Beckman Coulter; clone: B9.11; 1:25); anti-CD25-FITC or anti-CD25-PE-Cy5 (Beckman Coulter; clone: B1.49.9; 1:25); anti-CD14-FITC or anti-CD14-PE-Cy5 (Beckman Coulter; clone: RMO52; 1:25); anti-CD19-FITC (BD Biosciences, clone: HIB19), or anti-CD19-PE-Cy5 (Beckman Coulter; clone: J3-119; 1:25); CD56-PE-Cy5 (Beckman Coulter; clone: N901; 1:25). CD4 T-cell clones were established in the presence of irradiated (45 Gy) allogeneic PBMC
b
0 4000 8000 12,000 IFNG p =0.022 0 300 600 900 1200 p =0.609CCL5 0 1000 2000 3000 4000 CCL4 p =0.008 0 1000 2000 3000 CCL3 p =0.020 0 50 100 150 EPSTI1 p =0.988 0 250 500 750 1000 GZMB p =0.035 HC RRMS 0 100 200 300 400 500 IL3 p =0.359 HC RRMS 0 25 50 75 100 CXCR3 p=0.017 HC RRMS 0 60 120 180 RGS2 p =0.242 HC RRMS 0 200 400 600 800 CSF2 p =0.427 HC RRMS 0 400 800 1200 IL23R p =0.671 HC RRMS 0 10 20 30 40 STAT1 p =0.767 HC RRMS 0 400 800 1200 CCR6 p =0.476a
Rel expression (in T
H
1/17)
Rel expression (in T
H 1/17) 0 200 400 600 800 CCL5 p =0.268 0 200 400 600 800 CCL4 p =0.111 0 200 400 600 800 CCL3 p =0.272 0 50 100 150 200 EPSTI1 p =0.305 0 50 100 150 200 250 GZMB p =0.041 0 50 100 150 200 250 IL3 p =0.200 HC RRMS 0 20 40 60 80 CXCR3 p =0.253 HC RRMS 0 50 100 150 RGS2 p =0.862 HC RRMS 0 200 400 600 800 CSF2 p =0.170 HC RRMS 0 400 800 1200 p =0.389IL23R HC RRMS 0 10 20 30 40 STAT1 p =0.453 HC RRMS 0 250 500 750 1000 CCR6 p =0.100 Rel expression (in T H 17) Rel expression (in T H 17)
d
0 10 20 30 40 RRMS p =0.493 HC RRMS 0 10 20 30 40 50 p =0.039 HC RRMS 0 20 40 60 p =0.039 Rel expression (IL10 ) 0 20 40 60 HC p =0.576 Rel expression (IL10 )c
0 10 20 30 40 RRMS p =0.001 HC RRMS 0 5 10 15 20 25 TH17 p =0.052 TH1/17 TH 17 TH1/17 TH 17 TH1/17 TH 17 TH1/17 TH 17 0 10 20 30 p =0.012HC Rel expression (TBX21 ) HC RRMS 0 10 20 30 40 TH1/17 TH1/17 TH17 p =0.626 Rel expression (TBX21 )e
0 10 20 30 40 p =0.247 0 5 10 15 20 25 p =0.152 0 10 20 30 40 50 p =0.005 HC RRMS 0 5 10 15 p =0.063 HC RRMS 0 5 10 15 p =0.211 HC RRMS 0 5 10 15 20 p =0.008 Rel expression (STAT3 ) Rel expression (STAT5A ) TH1/17 TH17 DNFig. 6 Expression of PreP-signature genes of human pro-inflammatory TH17 cells in RRMS. RNA isolated from TH1/17, TH17, and DN cells (Fig.5) was subjected to qPCR analysis. Comparison of PreP-Signature gene expression between HC and patients with RRMS ina TH1/17 cells andb TH17 cells. (Welch’s t test, mean ± s.d.). Comparison of c TBX21 and d IL10 expression between HC and patients with RRMS in TH1/17 and TH17 cells.e Comparison of STAT3 (upper panel) and STAT5A (lower panel) expression between HC and patients with RRMS in TH1/17, TH17, and DN cells. Welch’s t test p-values were shown (mean± s.d.)