HAL Id: hal-01734735
https://hal.uca.fr/hal-01734735
Submitted on 15 Mar 2018
HAL is a multi-disciplinary open access archive for the deposit and dissemination of sci-entific research documents, whether they are pub-lished or not. The documents may come from teaching and research institutions in France or abroad, or from public or private research centers.
L’archive ouverte pluridisciplinaire HAL, est destinée au dépôt et à la diffusion de documents scientifiques de niveau recherche, publiés ou non, émanant des établissements d’enseignement et de recherche français ou étrangers, des laboratoires publics ou privés.
A framework to link patient satisfaction with customer
satisfaction
Corinne Rochette, Pierre Féniès
To cite this version:
Corinne Rochette, Pierre Féniès. A framework to link patient satisfaction with customer satisfaction. EUROMA, Jul 2008, Groningen, Netherlands. �hal-01734735�
A framework to link patient satisfaction with customer
satisfaction.
Corinne Rochette
Centre de Recherche Clermontois en Gestion Management- GREGOR Paris I IUP management et Gestion des Entreprises - Université d'Auvergne
Clermont-Ferrand, France.
Mail: [email protected] Pierre Féniès
Centre de Recherche Clermontois en Gestion Management- LIMOS UMR CNRS 6158 IUP management et Gestion des Entreprises - Université d'Auvergne
Clermont-Ferrand, France. Mail: [email protected]
The customer satisfaction is a field which is not fully explored, especially in its transposition to non-profit services like health-care systems. As shown in many researches, in the service area, the satisfaction can be approached with the service quality concept. The customer satisfaction is an important aspect of the business performance. In health-care systems, medical services managers, public institutions, practitioners and employees are interested in knowing and evaluating the patient satisfaction. This can be a dimension of the patient satisfaction in the health-care “industries” and a performance indicator. Researchers have identified the dimensions of satisfaction and work on its measurement. Thus scales can be used to measure the customer satisfaction and the ability to deliver a good service quality. The researches showed that a direct link exists between satisfaction and service quality. We propose in this article a reflection on the possible transposition of these scales to evaluate the patient satisfaction. For that we have used a qualitative approach (semi-conducted interviews on patients, doctors and nursing staffs), then we have proposed an ad-hoc scale to measure both patient satisfaction and service quality. Finally a model has been created.
Design, study and management of hospital systems are increasingly difficult and expansive areas existing multiple and complex system. A hospital can be defined such as an Health care Supply Chain (Chabrol et al., 2006). Health care Supply Chain is an opened set, crossed by human, material, informational and financial flows, composed of autonomous entities (suppliers, hospital departments, logistic services and external medical services…) which use restricted resources (time, material, capital, …) and coordinate their actions thanks to an integrated logistic process to improve firstly their collective performance (patient’s satisfaction) and secondly their individual performance. Most part of the studies in patient satisfaction is done for Operation Research models and does not deal with qualitative approach. Linking patient satisfaction and customer satisfaction is one of the goal of this
paper. The realisation of the customer satisfaction for the most part of companies is still a challenge, because many don’t succeed in developing the long term advantage which is a high level of customer satisfaction. The abundant academics works shows that the customer satisfaction is a real opportunity of profits. The links between satisfaction and profitability have between highly studied. More recently, the development of international standards based on quality have integrated the customer satisfaction as an important indicator of the quality generated.
The customer satisfaction has been approached at first in its operational dimensions: the capacity to deliver products and services respecting specifications and delays, the capacity to manage the claims. Now obtaining customer satisfaction is a stake with tactical and strategic dimensions.
The measure of the customer satisfaction has to contribute to develop more efficient processes and to build a long term advantage. It is a real tool of piloting of the performance.
If the research and the measurement of the customers’ satisfaction interested at first companies, the structures which directly not belonging to the trade sphere are henceforth interested too in this aspect of the performance. So we suggest in this communication to think about the transposition of the models used to measure of the customers’ satisfaction in the non trade area. First we will present what the customer satisfaction is. In a second part, we will study how patient satisfaction is studied in the literature. In a third part, we will discuss the link between (service) quality and customer satisfaction using some models as the SERVQUAL model and the service quality gaps model. This paper is the first step of a beginning research program on patient satisfaction and health care service.
1. Customer satisfaction building
The building process of the satisfaction is based on a model of the consumer behaviour called "multi-attributes" model. This model is the stone of the classic marketing theory. Every goods can be seen as a basket of attributes (use function, design, price, ergonomics…). The consumer as a rational person looks for the good which has the higher sum of the associated profits. In the facts he buys a future satisfaction. The unconscious reasoning leads to the selection of the good among others and it can be schematized as follows (Figure 1).
Identification of key attributes => weight of attributes=> for every good allocation of a mark for every attribute => Selection of the good obtaining the best global score
Figure 1. Good selection and customer behaviour.
This model is based on the principle of a linear contribution of every attribute to the global satisfaction.
The mode of evaluation that a customer uses for a product is based on its evaluation of three criteria: his perception of the good, his expectations, and the time.
The satisfaction varies according to the levels of expectation. Those are directly linked to the state of the market, to the personal experiences of purchase, to the information obtained by the consumer and diffused by the firm. The expectations are defined according to the current state of the offers; these offers evolve with the competition and with the time. In practice the measurement of the customer satisfaction is made at a very precise time, but we notice that the satisfaction evolves during the use of the product under the influence of certain phenomena such as the everyday acceptance of the product (which can then lose its competitive advantage which was the dominant element of satisfaction).
So the evaluation of the satisfaction is the result of a confrontation between perceived quality and expected quality.
Three perceptions can be identified (figure 2).
Perceived quality < expected quality = dissatisfaction Perceived quality = expected quality = satisfaction Perceived quality > expected quality = strong satisfaction
Figure 2. Good perceptions.
Most of the Anglo-Saxon measures of customer satisfaction are diverted from this classic vision, indeed scales are generally built around three states: “worse than expected”, “just have expected”, “better than expected”. For each of these states, nuances can be brought, that is why the satisfaction is generally considered as a continuum with two extremes: one extreme represented by the extreme dissatisfaction and the other by the extreme satisfaction.
However there are domains for which this continuum does not exist. The customer who buys a car waits that his car starts, thus there are only two possible states of satisfaction in that case: satisfaction (it starts), dissatisfaction (it does not start). This type of criteria constitutes) the base of the satisfaction. It is normal that the performance is good for these criteria (the car starts) and that the customer removes no particular satisfaction (it is a normal event), but in case of abnormality he is dissatisfied. Besides a second situation related to satisfaction can be identified. We have cases without dissatisfaction and some with an over satisfaction. So the satisfaction and the dissatisfaction are not two opposite states because they result from different elements (figure 3).
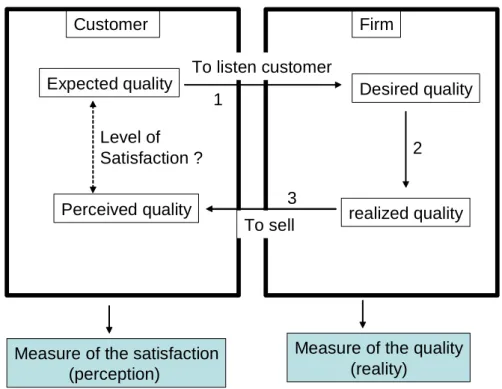
Expected quality Desired quality
1 To listen customer Customer Firm realized quality 2 Perceived quality 3 To sell Level of Satisfaction ?
Measure of the quality (reality)
Measure of the satisfaction (perception)
The satisfaction measures the potential gaps between the beginning and the end of the process. To satisfy the customer it is necessary to reduce the gaps, to match the expectations and the perceptions or to create some positive gaps.
The links represented on the scheme focus on the possible origins of the dissatisfaction. A gap on link 1 (expected quality and desired quality) shows that in this company customers are not listened. This gap reveals a non customer oriented company. A gap between desired quality and realized quality (link number 2) underlines difficulties to manage quality and to respect the quality standards. The gap between realized quality and perceived quality focuses on the communication and selling process, the problems in this case have a logistic origin (delays, errors on delivery…). In this scheme we can clearly see the two types of indicators: the indicators of the internal quality which measure the real performance of the firm and the measure of the customer satisfaction which includes all the process. If it is easier to use quality criteria as service rate, or defection rate because they have a reality, the satisfaction criteria (for example customer perception) are harder to manage.
The researches done in the satisfaction area showed that it is necessary to integrate the specificities of each economic sector. In the service area because of the intangibility, heterogeneity, and because production and consumption are simultaneous, the measurement of the service quality is more difficult. The evaluation of the quality of service is at the same time on the final result (outcome) and on how the service has been produced (the process) (Boss, 1999).
2. Health care system and services evaluation
The major contribution for services evaluation in health care system is done by operation researches models. The goal of this section is to analyse patient satisfaction in this kind of model and to test if measures of quality services are included in this kind of model.
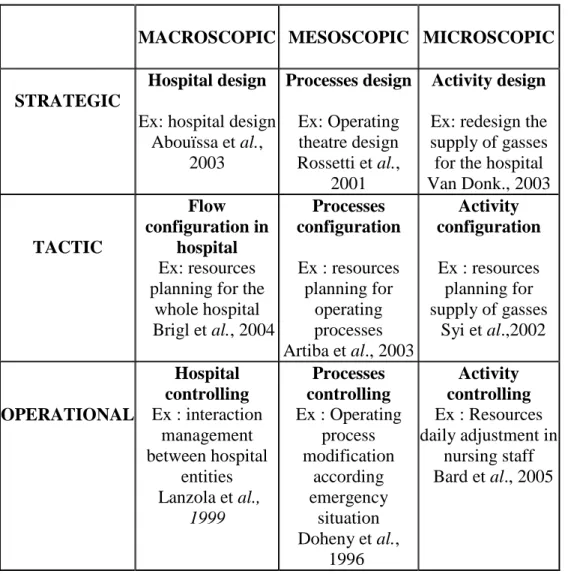
The hospital manager has to possess a set of tools and methods able to help him in design and in piloting problems. In a generic way, whatever the hospital under study, these problems can be classified according to three temporal levels (Ballou, 1992): (i) strategic level, which correspond to design problem and hospital’s network’s construction; (ii) tactical level which corresponds to hospital’s utilization, adequacy means/needs; (iii) operational level which relates to hospital’s piloting with short-term. These various temporal horizons need different modelling levels for any modelling study realized to bring decision-making tools. It is interesting to couple temporal sight with various possible types of modelling and simulation on HSC. Three approaches (Chabrol et al., 2006) allow characterizing a modelling approach by flows thanks to 3 types of modelling: macroscopic, mesoscopic, and microscopic modelling. Macroscopic modelling considers the flow in a complex system as an aggregated phenomenon, whereas microscopic modelling considers individual interactions. Mesoscopic approach incorporates entities in pack-age forms and constitutes an intermediate level between the macroscopic one and the microscopic one. Table 1 shows the coupling between these three approaches with various temporal horizons. Examples of decisional studies are included in the proposed matrix.
MACROSCOPIC MESOSCOPIC MICROSCOPIC
STRATEGIC
Hospital design
Ex: hospital design Abouïssa et al., 2003 Processes design Ex: Operating theatre design Rossetti et al., 2001 Activity design
Ex: redesign the supply of gasses for the hospital Van Donk., 2003 TACTIC Flow configuration in hospital Ex: resources planning for the
whole hospital Brigl et al., 2004 Processes configuration Ex : resources planning for operating processes Artiba et al., 2003 Activity configuration Ex : resources planning for supply of gasses Syi et al.,2002 OPERATIONAL Hospital controlling Ex : interaction management between hospital entities Lanzola et al., 1999 Processes controlling Ex : Operating process modification according emergency situation Doheny et al., 1996 Activity controlling Ex : Resources daily adjustment in nursing staff Bard et al., 2005
Table 1. The coupling temporal horizons and surrounding areas of modelling
A literature review about the health care systems and patient satisfaction is given in (Fenies and Tchernev, 2005). Judging from the literature, very few papers proposes decisional models in which satisfaction patient is evaluated. Most of them focus on patient route and then deducted workload resources. In these papers, medical resources are considered fixed. For example, Artiba et al., (2004) deal with hospital problematics as a hybrid jobshop. They use simulation to find an optimal method to allocate patient beds in a healthcare unit. They take into consideration different assignment rules, e.g. the sex of the patient or his age, in order to compare an exact method and three heuristics. In the same way, Swisher et al. (2001) use a discrete event simulation to model the behaviour of a healthcare clinic which is based on the patient moves between the different rooms. The focus of this study is to provide a tool for decision-making in order to determine the number of the medical staff and rooms for patients satisfaction. Most of the paper in Operational Research models for hospital decisional tools includes patient satisfaction such as a time delay. Qualitative satisfaction is not included, or not transformed in quantitative metrics.
3. Measuring services qualities
There are a number of different "definitions" as to what is meant by service quality. One that is commonly used defines service quality as the extent to which a service meets customers’
needs or expectations (Lewis and Mitchell, 1990; Dotchin and Oakland, 1994a; Asubonteng
et al , 1996; Wisniewski and Donnelly, 1996). Service quality can thus be defined as the
difference between customer expectations of service and perceived service. If expectations are greater than performance, then perceived quality is less than satisfactory, and hence, customer dissatisfaction occurs (Parasuraman et al ., 1985; Lewis and Mitchell, 1990). According to Edvardsen et al . (1994) the starting point in developing quality in services is analysis and measurement.
→ The Definitions of the SERVQUAL
Many researches had been done on this point. The SERVQUAL approach of A. Parasuraman, V. Zeithaml and L. Berry is a strong reference which can be used to measure the service quality, even if this model had been criticized. The SERVQUAL scale was first published in 1988 and has undergone numerous improvements and revisions since then. The scale currently contains 21 perception items distributed throughout the five service quality dimensions.
The five main dimensions to evaluate the quality generated are :
• Tangibles elements like physical facilities, equipments, front line employees’ appearance, tools, communication materials …,
• Reliability: ability to perform the promised service accurately,
• Helpfulness, responsiveness: Willingness to answer to the customers to help them and to provide a prompt service.
• Assurance: skills and courtesy of the front line employees, the ability to inspire trust and confidence
• Empathy: to take care of the customer, to pay an individualized attention. In the SERVQUAL instrument, 21 statements measure the performance across these
five dimensions, using a seven point Likert scale (from strongly disagree to strongly agree) measuring both customer expectations and perceptions (Gabbie and O'Neil, 1996).
Public utilities are not the last ones to be interested in measuring the satisfaction of the users. They are conscious firstly that the satisfaction is a part of their performance evaluation and secondly that the satisfaction of the users can be a strongly mobilizing objective for the employees. The health care area is a good illustration of this aspect. But in this area there are some particularities which need to adapt the model currently used to measure the customer satisfaction to the patient satisfaction evaluation.
We can explore what are the expected quality and the perceived quality for a patient? Because of the specificities of the health care it is more difficult to reach the wished quality and the realized quality. The process of realization of the service is complex.
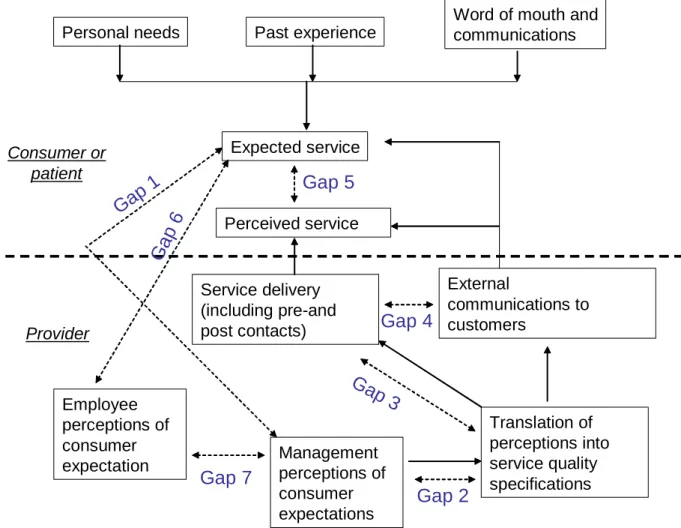
→ The Model of service quality gaps presented figure 2 (Parasuraman et al., 1985; Curry, 1999; Luk and Layton, 2002) can be useful to have a better understanding of the possible origins of patient dissatisfaction; it can be used as a basis to propose a most adapted model to represent the service satisfaction for the patient in the health care industry. As in the monetary economy we can imagine that the expected service is the result of personal needs, past experience, word of mouth and communication. But we have to consider at the same time that in the health care industry the professionals can identify better than the customer his needs on the strictly medical point of view (technical aspect). In this case the identification of the “personal needs” is also the result of a good diagnosis of the “service provider”.
We have to pay a particular attention to the link between “external communication to customers” and “expected service”. If we have no or few external communications it is probably because of the bad quality of the contacts with patient. But what is a bad quality contact? The patient directly can help us to define it, that is why in our research project we plan to use non structured interviews (before, during and after the care process) but also to pay attention to critical incidents and complaints. After this step we could be able to propose a list of criteria on which the patients evaluate their satisfaction and to classify them according to their contribution to the satisfaction (key criteria, secondary criteria).
We have enlighted the importance of the understanding of what is the expected service for a patient. The cure sometimes is not realistic that why we propose that it does not intervene or interfere a lot in the definition of the expected quality of service. Only a qualitative approach can allow us to estimate the main dimensions on which the patient estimates his experiment of care, and the way he lives the stages of the process of care.
Employees and managers have to clearly know what the patient expectations are. Do they really know their expectations how do they evaluate them? And how the perceptions of patient expectations are integrated in the service quality specifications?
We have to consider if and how the process of care and the process of service are differentiated or considered as a whole (figure 4)
Perceived service
Word of mouth and communications
Personal needs Past experience
Expected service Consumer or patient Provider External communications to customers Service delivery (including pre-and post contacts) Employee perceptions of consumer expectation Translation of perceptions into service quality specifications Management perceptions of consumer expectations
Ga
p
1
Gap 2
Gap
3
Gap 4
Gap 5
G
a
p
6
Gap 7
Figure 4. The Model of service quality gaps (Parasuraman et al., 1985; Curry, 1999; Luk and Layton, 2002)
According to Brown and Bond (1995), "the gap model is one of the best received and most heuristically valuable contributions to the services literature". The model identifies seven key
gaps relating to managerial perceptions of service quality, and tasks associated with service delivery to customers. The first six gaps (Gap 1, Gap 2, Gap 3, Gap 4, Gap 6 and Gap 7) are identified as functions of the way in which service is delivered, whereas Gap 5 pertains to the customer and as such is considered to be the true measure of service quality. The Gap on which the SERVQUAL methodology has influence is Gap 5.
4. Proposition of a model to investigate the satisfaction of the patient.
The first step of the process of the evaluation of patient satisfaction is to explore the link between expected quality and perceived quality (figure 5) on the three steps of a health care service (before the care, during the care and after the care). Therefore, we propose a qualitative analysis in order to evaluate patient satisfaction in health care system. A matrix (table 2) is built and is now on test with medical staff in hospital and patients.
Some items to explore during the interviews
Before care During care After care
Tangibles dimension:
Buildings, rooms, Equipments, Physical facilities, Employees appearance,
Materials associated with service…
Reliability dimension:
The promise done,
The importance of respecting delay, Technology
Diagnosis,
Interest and involvement of the “hospital” and the staff…
Helpfulness dimension: Importance of information, Explanations, Answer to questions… Assurance Courtesy, Knowledge to answer, Confidence, Empahty
Individual attention, consideration Politeness,
Respect.
It is a base to develop and adapt the items currently used by the SERVQUAL model to the health care area or to find new items to explore.
Conclusion
In this paper, we studied if it was possible to evaluate patients’ satisfaction such as customers’ satisfaction. The first result of our studies seems to prove that marketing tools could be adapted without many difficulties on this domain. We propose a matrix to test patient
satisfaction in the hospital system. Further researches (qualitative interview and quantitative analysis) will give us the possibility to propose a model for patients’ satisfaction evaluation. We also would like to introduce this kind of patients’ satisfaction evaluation in OR models.
References
Abouïssa, H., Nicolas, J.C., Benasser, A., Cherkouk, N. : Systèmes Multi Agent et réseaux de Petri pour la modélisation et l’Evaluation des Performance des Systèmes hospitaliers, In 1ère conférence francophone en Gestion et Ingénierie de Systèmes Hospitaliers (GISEH). Lyon (2003)
Artiba, A., Briquet, M., Colin, J., Dontaine, A., Gourc, D., Pourcel, C., Stock, R.: Modélisation d'établissement de santé. In 2ème conférence francophone en Gestion et Ingénierie de Systèmes Hospitaliers (GISEH). Mons (2004).
Ballou, R.: Business Logistics Management, Prenctice-Hall Inc Englewood Cliffs, New Jersey (1992) Bard, J.F., Purnomo, H.D.: Preference scheduling for nurses using column generation. EJOR 164 (2005). Bon J., Conde-salazar M., 1999/1, «Gestion de l'interface client et marketing de service public.», Revue
Française du Marketing, n°171, pp. 77-85.
Boss J. F., «La contribution des éléments de service à la satisfaction des clients , Revue Française du Marketing, n°171, pp. 115-128. (1999/1)
Brigl, B., Ammenwerth, E., Dujat, C. Gräber, S., Grosse, A., Häber, A., Jostes, C., Winter, A.: Preparing
Strategic information management plans for hospitals: a practical guideline SIM plans for hospital: a guideline. International Journal of Medical Informatics. (2004)
Brown S. W., Schwartz T. A., 1989, «A gap of professional service quality.», Journal of Marketing, vol. 53, pp. 92-98.
Chabrol M., Chauvet J., Fenies P., Gourgand M., (2006) A methodology for process evaluation and activity based costing in health care supply chain. Lecture Notes in Computer Sciences (Springer) as a special issue on Interoperability, 2006 Volume 3812, p. 375 – 384.
Chabrol, M., Sarramia, D. : Modélisation orientée objets et multi agents du système d’information des systèmes de trafic urbain. INFORSID, Genève (2001).
Doheny, J.G., and J.L., Fraser: MOBEDIC – A decision modeling tool for emergency situation. Expert system With applications, vol 10. (1996)
Fenies P., Tchernev N., (2005) La modélisation d'une unité générique de soins : une brique essentielle pour le système d'information et d'aide à la décision de la supply chain du Nouvel Hôpital d'Estaing. Logistique et Management, n°13, Décembre 2005, p-39-52.
Lanzola, G., Gatti, L., Falasconi, S., Stefanelli, M.: A framework for building cooperative software agents in medical application». Artificial Intelligence in Medicine (1999)
Parasuraman A., Zeilthman V. A., Berry L. L.,1985, «A conceptual model of service quality and its implications
for future research.», Jçournal of Marketing, vol. 49, pp. 41-49.
Rossetti, M.D., Selandari, F.: Multi-objective analysis of hospital delivery systems. Computers and Industrial Engineering 41 (2001)
Syi Su ScD., Chung Liang Shih M.D Resource Reallocation in an Emergency Medical Service System Using Computer
Simulation. American Journal of Emergency Medicine, Vol 20. (2002)
Van Donk, P.D.: Redisigning the supply of gasses in a hospital. Journal of purchasing and supply chain management 9 (2003).