PIL S1353^i50S(97)00040-9 1353-4505/97 sn.oo+o.oo
Patient Satisfaction With Emergency House Calls
THOMAS V. PERNEGER,* MARIE
VOUILLOZ,f BERNARD GREDER.f
JOSE BARROS,t JASMINA
FROIDEVAUXf and PIERRE
FROIDEVAUXf
* Institute of Social and Preventive Medicine, University of Geneva, Geneva, Switzerland; t SOS-Medecins, Geneva, Switzerland
Study objectives: To identify determinants of patient satisfac-tion with emergency house caDs and to assess the properties of a satisfaction measurement questionnaire.
Design: Patient surrey, combined with routinely collected information on the circumstances of tbe bouse calL
Setting: Emergency boose caDs provided by an independent emergency care organization (ECO) in Genera, Switzerland.
Participants: Consecutive sample of 389 patients (67% response rate).
Main outcome measure: Patient satisfaction. Predictor vari-ables: patient age and sex, type of medical problem, time of visit, waiting time, duration of visit, perceived effectiveness of treat-ment.
Results: Tbe satisfaction questionnaire was easy to administer. Factor analysis identified 3 separate dimensions of satisfaction, which pertained to tbe visit itself, to access and to general attitude toward tbe ECO. Validation tests were consistent with expecta-tions. In mnltivarlate analysis, older patient age and greater perceived treatment effectiveness predicted independently aD satisfaction scales. Presence of a mixed physical and mental problem reduced satisfaction with the visit itself only, a delay between tbe phone call and the visit exceeding one hour reduced satisfaction with access and worsened tbe attitude toward tbe ECO.
Conclusion: The instrument used to measure patient satisfac-tion with emergency bouse calls performed welL Overall levels of satisfaction were high. Perceived effectiveness of treatment was the strongest correlate of patient satisfaction. Monitoring of patient satisfaction in emergency settings may contribute to improvements of quality of care. © 1997 Elsevier Science Ltd. Key words; Patient satisfaction, emergency medical services,
house calls, treatment effectiveness, reliability and validity.
INTRODUCTION
Patient satisfaction is a useful indicator of the performance of health services [1]. Little is known about specific aspects of patient satisfaction in emergency care
settings. Emergency care differs from scheduled medical care in several aspects which may affect patient satisfac-tion: patients are often in acute distress, providers work in stressful conditions, no established relationship exists between the patient and the provider and the patient often has little choice when selecting a particular provider. In Britain, patients tend to be less satisfied with out-of-hours care provided by a substitute physician who stands in for their usual physician [2-6].
This paper examines patient satisfaction with emer-gency house calls provided by physicians affiliated with an independent emergency care organization (ECO) in Geneva, Switzerland. Provision of emergency medical home care is the organization's only activity. All patients who use its services are referred for follow-up to their own physician, so that all visits are isolated encounters. The purpose of this study was to elicit patients' assessments of these health care services, and to identify patient- or visit-related risk factors for (dis)satisfaction. A secondary aim was to document the psychometric properties of a brief satisfaction questionnaire developed for use in this setting.
METHODS
Study design
Data from a patient satisfaction survey were combined with prospectively collected data regarding the consulta-tion. To maintain confidentiality, databases were stripped of personal identifiers and transmitted to an independent researcher (TVP) for analysis.
Study setting
The privately owned ECO was established in 1987 in Geneva, Switzerland. The organization provides emer-gency house calls every day, 24 hours per day. The organization supplies the infrastructure (telephone lines, receptionists, planning of physician work hours, emer-gency vehicles, medical equipment, information manage-ment, billing services, medical supervision) and contracts with independent physicians, who are paid fee-for-service, after deduction to cover the organization's expenses, according to customary rates for outpatient
Received 13 January 1997; accepted 4 June 1997.
Correspondence to: Dr Thomas Perneger, Institute of Social and Preventive Medicine, University of Geneva, CMU Case Postale, CG-1211 Geneva 4, Switzerland.Tel: +41-22-702 5910, Fax: + 41-22-702 5912, E-mail:[email protected].
368 T. V. Pemeger et al.
visits. Some physicians work full-time for the ECO, others part-time. House calls are reimbursed by health insurance companies after deduction of a 10% copay-ment (health insurance is mandatory in Switzerland; the state subsidizes persons with low income). The organiza-tion provided 30 000 house calls in 1995 (to a populaorganiza-tion of about 350 000). The average duration of the consulta-tion was 20 minutes, the mean delay between the call and the visit was 57 minutes. As well as the ECO involved in this study, the Geneva Medical Association also provides an emergency house call service to the same population.
Study variables
The outcome measure was patient satisfaction with the house call, measured with a 14-item closed-format questionnaire. Items were selected from published instru-ments [7-10] and adapted to the circumstances of an emergency visit. An additional item addressed the perceived effectiveness of the prescribed treatment. Open questions asked about the best and worst aspects of the visit; responses were coded by one of the authors (MV) as positive, neutral, or negative with regard to each domain of satisfaction represented in the closed-format questionnaire.
Independent variables included patient age and sex, the time of the house call (coded as business hours: 8 am to 5 pm on weekdays, or after-hours), the interval between the call and the arrival of the physician (in minutes), the duration of the consultation (in minutes), the number of consultations received from the ECO in the past year and the type of medical problem (somatic excluding trauma, mental, both somatic and mental, trauma) that motivated the consultation. Variables other than patient satisfaction were extracted from routine records, except the type of medical problem, which was determined by one of the authors (BG), based on the medical report issued for each consultation.
Study population and survey procedure
All patients who consulted the ECO during preselected days in September 1995 and who lived in Geneva were eligible. Physicians were not warned that a satisfaction survey would be conducted. Patients received a letter which explained the purpose of the survey, the ques-tionnaire and a stamped return envelope. If the patient was less than 16 years old, the questionnaire was addressed to the patient's parents. Returns were mon-itored continuously, and nonrespondents were sent up to two reminders.
Analysis
To assess the performance of the satisfaction ques-tionnaire, each item was examined for acceptability (proportion of missing answers) and ceiling and floor effects (proportions of respondents choosing extreme
response options). A factor analysis on the 14 items was used to identify independent dimensions of satisfaction [11]. Summative satisfaction scores were computed, based both on factor analysis results and on item content. Items were allocated to the dimension on which their loading was highest; when the 2 highest loadings were close to each other (difference < 0.2), the item was allocated to the scale which best fit the intended item content. Each score was a simple mean of relevant items, scaled between 0 and 100 (lowest and highest possible scores), computed whenever half or more of contributing items were present. To estimate scale reliability, we computed internal consistency coefficients [11].
We tested three construct validity hypotheses:
(1) The factorial structure of the 14 items would identify the following dimensions of patient satisfaction: a global assessment of visit (items 1 and 10), medical aspects of visit (items 4-9), access to care (items 2 and 3), cost of visit (item 11), and general attitude toward provider organization (items 12-14).
(2) Items measuring a general attitude toward the ECO (12-14) would correlate with the sum of visit-specific items (items 1-11).
(3) Closed-format satisfaction scores would correlate with open comments (positive, negative, or absent). The amount of variation in a score that was explained by open comments was estimated by partial eta-squared statistics from ANOVA models [11].
To assess the potential impact of nonresponse on study results, we compared survey respondents and nonrespon-dents using all routinely collected data for this analysis.
To identify predictors of patient satisfaction, we examined satisfaction scores across subgroups of patients, using regression methods: ANOVA [12] (for subgroup comparisons and for multivariate models) or linear regression [12] (for continuous covariates). Multi-variate modelling was conducted in a stepwise manner, starting with the strongest univariate predictor, addi-tional covariates were added if the change significantly improved the fit of the model, or removed if their contribution became nonsignificant. The same level of statistical significance (p < 0.05, based on the corre-sponding F-statistic) was used as criterion for adding and for removing a predictor. Analyses were conducted using SPSS [13].
RESULTS
Enrolment
During the enrolment period, 594 patients consulted the ECO, 581 (98%) were eligible for the study (5 names were duplicates, 4 patients died, 3 had left Geneva, and 1 was too sick to respond), and 389 (67% of the eligibles) responded to the survey (158 did not respond to mailings, 26 refused to participate, and 8 failed to respond for other reasons). Participants responded on
average 41 days after the consultation (standard devia-tion (SD) 19 days).
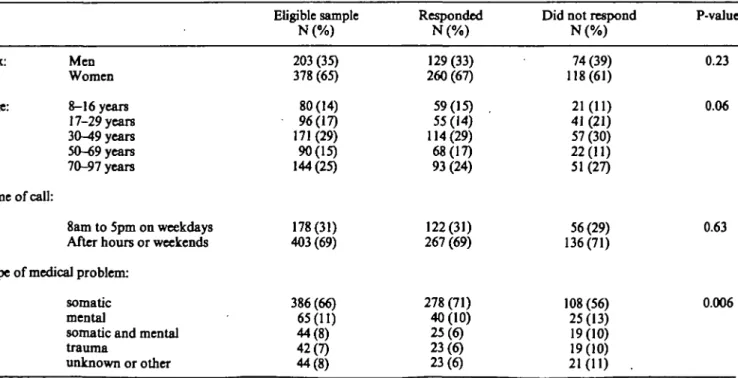
Respondents and nonrespondents differed little (Table 1). Response rates were somewhat lower among men, young adults and patients who consulted for other than somatic health problems. Waiting time between, the telephone call and the house call and the duration of the consultation were similar in the 2 groups. Nonrespon-dents had had on average more consultations with the ECO in 1995 than did respondents (4.4 versus 2.3, P = 0.09). For descriptive purposes only, all consultation reports were reviewed by one of the authors (BG) to assess the degree of emergency, rated as "low" (293 visits, 50%), "intermediate" (185 visits, 32%), "high" (60 visits, 10%) or uncodable (43 visits, 7%). The degree of emergency was not related to participation (because of the presumed limited reliability of assessments of emergency carried out after the fact, we did not use this variable as a predictor of satisfaction).
Properties of questionnaire
Because we used an instrument developed specifically for this study, we had to verify its psychometric proper-ties. The proportion of missing answers was low (Table 2). All questions (except the item about the amount of the bill) had strong "ceiling" effects, negligible "floor" effects and distributions strongly skewed toward the most desirable response. Response options between "excel-lent" and "poor" (items 1, 2, 4-6) produced the least skewed distributions.
Factor analysis identified 3 principal components, which accounted for 66% of total variance in the 14
items (Table 2). Although there were fewer independent dimensions than we anticipated, the structure of the instrument was generally consistent with theory. The global assessment items loaded on the same factor as medical items (first dimension), and the cost item was grouped with access items (second dimension). The three general attitude items constituted the third dimension. Only the item regarding whether the doctor fulfilled expectations about treatment had to be allocated accord-ing to theory, and not usaccord-ing the highest loadaccord-ing rule. Based on this analysis, 4 scales were constructed by summing corresponding items: a "summary" scale (all 14 items), a "visit" scale (items 1 and 4-10), an "access" scale (items 2, 3 and 11), and a "general attitude" scale (items 12-14). These 4 scores were used in further analyses.
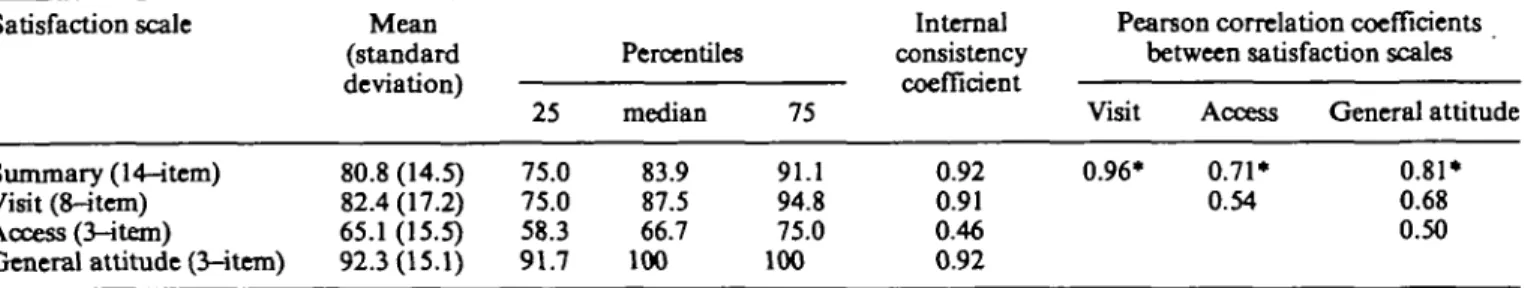
All scores were skewed toward high values (Table 3). However, ceiling effects were minimal for the "summary" (1.3%) and "access" (2.1%) scales, moderate for the "visit" (17.2%) scale, and problematic only for the "general attitude" scale (68.4%). Internal consistency coefficients (Cronbach a) were high for 3 of the scales (Table 3), but modest for the "access" scale. Correlations between the 3 independent scores were in the 0.5 to 0.7 range, suggesting that each conveyed sufficiently inde-pendent information.
Items measuring "general attitude" were not visit-specific; i.e. they did not refer directly to the house call performed. We hypothesized that the general attitude towards the ECO would be strongly determined by the patient's opinion of the house call, which was measured by the remaining 11 items. As predicted, the correlation between the 3 attitude items and the sum of the
visit-TABLE 1. Participation rates in satisfaction surrey of patients who requested an argent bouse call, Genera, Switzerland, 1995
Sex: Men Women Age: 8-16 years 17-29 years 30-49 years 50-69 years 70-97 years Time of call: 8am to 5pm on weekdays After hours or weekends Type of medical problem:
somatic mental
somatic and mental trauma unknown or other Eligible sample N(%) 203 (35) 378 (65) 80 (14) 96(17) 171 (29) 90(15) 144(25) 178(31) 403(69) 386(66) 65(11) 44(8) 42(7) 44(8) Responded N ( % ) 129(33) 260(67) 59(15) . 55(14) 114(29) 68(17) 93 (24) 122(31) 267 (69) 278 (71) 40(10) 25(6) 23(6) 23(6)
Did not respond N ( % ) 74(39) 118(61) 21(11) 41 (21) 57(30) 22(11) 51(27) 56(29) 136(71) 108 (56) 25(13) 19(10) 19(10) 21(11) . P-value 0.23 0.06 0.63 0.006
370 T. V. Pemeger et al.
TABLE 2. Distributions of answers to satisfaction questionnaire, and results of factor analysis, among 389 patients who requested an emergency house call, Genera, Switzerland, 1995
Abbreviated item content
1 Overall quality of care received during visit 2 Attitude of receptionist who took the call 3 Waiting time between phone call and visit 4 Doctor's professional competence 5 Doctor's relational skills
6 Doctor's ability to listen
7 Doctor's explanations about health problem 8 Doctor met expectations about treatment 9 Duration of consultation
10 General satisfaction with house call 11 Amount of bill
12 Would call ECO again for urgent care 13 Fully trusts services provided by ECO 14 Would recommend ECO to family or friends
* Response options:
Items 1, 2, 4, 5, 6: excellent; very good; good; fair; poor
Items 3, 9: very satisfactory; rather satisfactory; indifferent; not very satisfactory; not satisfactory at all Item 7: very clear, rather clear, don't know; rather confusing; very confusing
Item 8: yes, completely; rather yes; don't know; rather not; not all all
Item 10: very satisfied; rather satisfied; indifferent; rather dissatisfied; very dissatisfied Item 11: too low; rather low, appropriate; rather high; too high
Items 12-14: yes, certainly; probably yes; don't know; probably not; certainly not
fltem loadings on 3 principal components, after varimax rotation. Items included in a given scale are shaded. missing 1.5 1.5 0.3 0.0 3.1 0.8 1.5 2.8 3.3 2.1 5.7 2.6 1.5 2.3 Percent responding* best 34.4 37.8 41.1 41.9 48.6 39.3 59.4 64.3 51.2 57.1 0.0 79.2 70.4 77.4 2 37.0 38.6 44.5 33.4 29.8 37.8 31.6 24.4 34.2 35.5 0.5 10.8 23.7 14.1 3 23.7 19.8 4.1 22.1 15.9 19.3 4.6 4.4 6.9 2.1 49.4 5.9 2.8 4.9 4 2.6 1.8 8.2 1.5 2.1 1.3 1.0 1.3 3.1 1.8 35.2 1.0 1.0 0.8 worst 0.8 0.5 1.8 1.0 0.5 1.5 1.8 2.8 1.3 1.5 9.-3 0.5 0.5 0.5 visit
WM
0.48 0.31m
Egg
111
BBal
mm)
m
-0.09 0.25 • 0.30 0.23 Factor analysist access | 0.28 BflgBl I 0.12 I 0.14 1 0.14 0.09 1 -0.07 1 0.29 1 0.05 0.25 0.20 0.25 general attitude 0.27 0.06 0.08 0.30 0.16 0.20 0.39 0.63 0.37 0.52 0.36m
m
m
TABLE 3. Distributions, internal consistency coefficients and correlations among 4 summary satisfaction scores, among 389 patients who requested an emergency house call, Geneva, Switzerland, 1995
Satisfaction scale
Summary (14-item) Visit (8-item) Access (3-item)
General attitude (3-item)
Mean (standard deviation) 80.8 (14.5) 82.4 (17.2) 65.1 (15.5) 92.3(15.1) 25 75.0 75.0 58.3 91.7 Percen tiles median 83.9 87.5 66.7 100 75 91.1 94.8 75.0 100 Internal consistency coefficient 0.92 0.91 0.46 0.92
Pearson correlation coefficients between satisfaction scales Visit Access General attitude 0.96* 0.71* 0.81*
0.54 0.68 0.50 • Not corrected for overlap
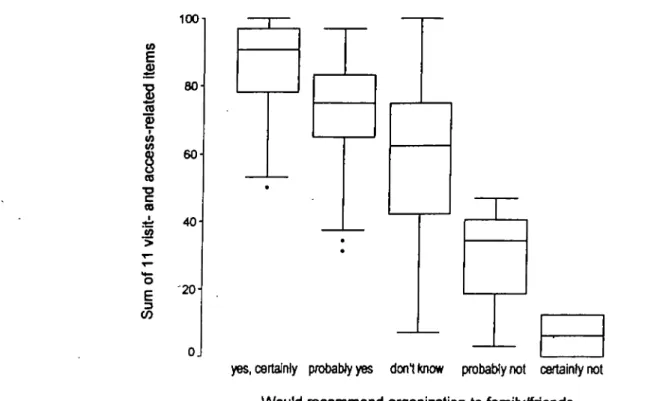
specific items was strong and approximately linear (example: Fig. 1); all 3 linear trends were statistically significant (P-values for linear trend < 0.001).
Overall, 277 respondents (71%) contributed 603 written comments: 257 (66%) gave 449 positive com-ments, and 104 (27%) gave 143 negative comments (the remaining 11 comments were not value-laden). Com-ments predicted summary satisfaction scores: mean scores increased progressively in those who gave 0 (76.9), 1 (78.9), 2 (84.0) or 3 (89.3) positive comments (p < 0.001), and decreased progressively in those who gave 0 (83.7), 1 (78.0), 2 (66.8), 3 (40.2) or 4 (22.3) negative comments. Negative comments explained a greater proportion of the variance in global satisfaction scores than did positive comments (partial eta-squared 0.36 for negative comments, 0.13 for positive comments).
In addition, the validation by open comments was domain-specific: comments related to medical aspects explained a greater part of variability in "visit" scores (eta-squared 0.42) than in "access" scores (0.10), while comments related to issues of access or cost explained more variation in "access" scores (0.09) than in "visit" scores (0.01).
Predictors of satisfaction
The summary satisfaction score was higher among participants who responded to the first mailing (mean 81.8) than in those who responded after the first (79.9) and second (77.6) reminder (test for linear trend, P= 0.053).
£
§
TO CD i2 | 100 80 60 40 '20-Ojyes, certainly probably yes don't know probably not certainly not Would recommend organization to family/friends
FIGURE 1. Boxplots of satisfaction scores (sum of 11 visit-related and access-related items) for patients who would and who would not recommend the emergency care organization to family or friends, among 389 patients who requested an emergency house call, Geneva, Switzerland, 1995.
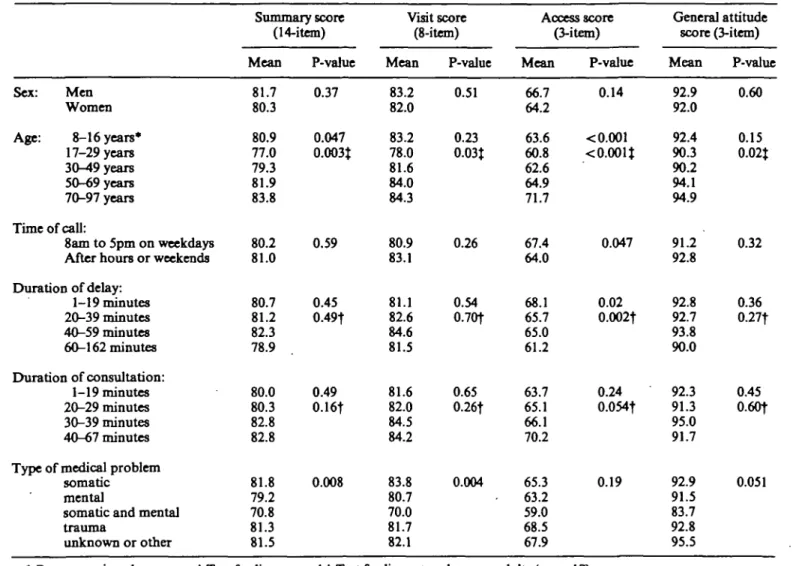
slightly more satisfied with access to care (Table 4). Young adults were least satisfied and the increasing trend in satisfaction with age among adults was statistically significant for all dimensions. Parents of children attended to by the ECO were about as satisfied as middle-aged patients. Differences between patients who were seen during and after usual business hours were small. Visit satisfaction decreased only when the delay between the telephone call and the consultation exceeded one hour, but the "access" score decreased more gradually with increasing delay. All patient satisfaction scores increased (but not significantly) with the duration of the consultation. Patients seen for somatic medical problems or for injuries were the most satisfied, and those who suffered from mixed somatic and mental health problems were the least satisfied. By far the strongest predictor of satisfaction was the patient's opinion of treatment effectiveness: associations with all satisfaction scores were strong and highly statistically significant (summary score: Fig. 2). Overall, 41% of respondents rated the treatment they received as "very effective", 31 % as "rather effective", 5% had no opinion, 4% as "rather ineffective", 2% as "totally ineffective", and 14% had not received any treatment.
Time-related items
The two time-related items were also analysed sepa-rately. Satisfaction with the delay between the telephone call and the consultation was examined for association with actual delay (in minutes, recorded routinely). A
longer delay predicted a lower level of satisfaction with the delay (P < 0.001). Satisfaction with the duration of the consultation was weakly associated with actual duration (P = 0.30).
Multivariate models
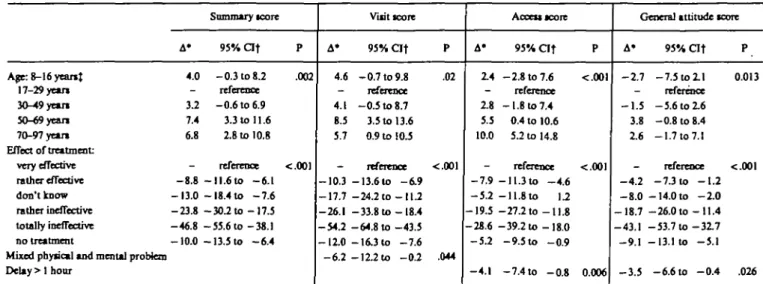
Only two variables remained as independent predictors of patient satisfaction in all multivariate models: patient age and perceived effectiveness of treatment (Table 5). In addition, patients who consulted for mixed physical and mental problems were less satisfied with the visit itself and had less favorable general attitudes toward the ECO and when delays between the initial phone call and the arrival of the doctor exceeded one hour, ratings of access to care were lower.
Open comments
Open comments provided many useful insights about patients' perceptions of strengths and weaknesses of the organization that could not be captured by closed-format items. Many comments stressed the importance human factors in the patient-physician relationship, such as a sensitivity to psychological distress and a good ability to listen to the patient. Other patients gave practical advice. For instance, some respondents sug-gested that pediatricians should be available to deal with pediatric emergencies. Others felt that the best thing about the ECO was its existence and the reassurance this provided. Others appreciated the convenience of house
372 T.V. Pernegerrto/.
TABLE 4. Patient and boose call characteristics in relation to 4 satisfaction scores: summary score, visit score, access score and general attitude score, among 389 patients who requested an emergency boose caD, Geneva, Switzerland, 1995
Summary score (14-item) Visit score (8-item) Access score (3-item) General attitude score (3-item) Sex: Men Women Age: 8-16 years* 17-29 years 30-49 years 50-69 years 70-97 years Time of call: 8am to 5pm on weekdays After hours or weekends Duration of delay: 1-19 minutes 20-39 minutes 40-59 minutes 60-162 minutes Duration of consultation: 1-19 minutes 20-29 minutes 30-39 minutes 40-67 minutes Type of medical problem
somatic mental
somatic and mental trauma unknown or other Mean 81.7 80.3 80.9 77.0 79.3 81.9 83.8 80.2 81.0 80.7 81.2 82.3 78.9 80.0 80.3 82.8 82.8 81.8 79.2 70.8 81.3 81.5 P-vahie 0.37 0.047 0.003J 0.59 0.45 0.49t 0.49 0.16f 0.008 Mean 83.2 82.0 83.2 78.0 81.6 84.0 84.3 80.9 83.1 81.1 82.6 84.6 81.5 81.6 82.0 84.5 84.2 83.8 80.7 70.0 81.7 82.1 P-value 0.51 0.23 0.03J 0.26 0.54 0.70t 0.65 0.26t 0.004 Mean 66.7 64.2 63.6 60.8 62.6 64.9 71.7 67.4 64.0 68.1 65.7 65.0 61.2 63.7 65.1 66.1 70.2 65.3 63.2 59.0 68.5 67.9 P-value 0.14 < 0.001 <0.001J 0.047 0.02 0.002t 0.24 0.054t 0.19 Mean 92.9 92.0 92.4 90.3 90.2 94.1 94.9 91.2 92.8 92.8 92.7 93.8 90.0 92.3 91.3 95.0 91.7 92.9 91.5 83.7 92.8 95.5 P-value 0.60 0.15 0.02J 0.32 0.36 0.27f 0.45 0.60t 0.051
• Response given by parents f Test for linear trend J Test for linear trend among adults (age > 17)
calls, which suggests that perceived medical emergency may not be the only criterion for using emergency house call services.
DISCUSSION
This study indicates that reliable and valid measure-ments of patient satisfaction with emergency house calls can be obtained, that general levels of satisfaction are high even in the emergency setting and that several factors influence the patient's rating of the consultation, including patient's age and the perceived effectiveness of treatment
Measurement of patient satisfaction
We encountered few practical problems with the survey. The response rate of 67% after two reminders was acceptable, especially given that information routi-nely collected by the organization did not reveal major differences between participants and nonparticipants. Satisfaction scores decreased progressively with each
reminder mailing. This suggests that dissatisfied patients may be harder to convince to fill the questionnaire; alternatively, respondents may become more critical of the care they have received as time goes by, or they may feel more free to voice discontent Similar evidence of moderate selection bias has been observed elsewhere [14]. The survey questionnaire had adequate psychometric properties. The proportion of missing answers was low, but ceiling effects for individual items were important. Internal consistency coefficients were > 0.9 for 3 of 4 summary scales, exceeding the minimum reliability of 0.7 recommended for between-group comparisons [11]. Internal consistency of the "access" scale was lower, both because of its brevity and because its items addressed unrelated aspects of patient experience (satis-faction with the receptionist, with waiting time, and with the bill). The reliability of this scale should be examined by a test-retest procedure.
Tests of validity also yielded favorable results. Factor analysis identified fewer dimensions of satisfaction than were initially postulated, as it often does [15,16], but the factorial structure appeared logical, separating
visit-£
8
M O=8
to us ra 100 BO 60 40 20-Ojvery effective doni know totally ineffective
rather effective rather ineffective no treatment
Perceived effectiveness of treatment
FIGURE 2. Boxplots of summary satisfaction scores (14-item scale), according to patient perceptions of the effectiveness of treatment, among 389 patients who requested an emergency house call, Geneva, Switzerland, 1995.
related, access-related and general-attitude items. All but one item could be allocated to their postulated dimension using the highest loading rule. The lack of independence of the items probing various aspects of physician behavior may correspond to reality (doctors who are good at explaining things may also be the ones who are technically competent), or may result from the patient's inability to distinguish separate components of physician behavior. The latter hypothesis is somewhat unlikely in view of experimental research suggesting that patients
can differentiate between technical and emotional aspects of physician behavior [17].
Open comments were in agreement with satisfaction scores, which provides further evidence of construct validity. In addition, open comments revealed specific areas deserving improvement in the ECO, such as the lack of trained pediatricians on the staff, which would have been missed by a closed-format questionnaire. The proportion of participants who wrote in comments (71%) was greater than is usually seen in satisfaction
TABLE 5. Multirariate predictors of patient satisfaction among 389 patients who requested an emergency house call from SOS-Mededns, Geneva, Switzerland, 1995
Age: 8-16 yeanJ 17-29 yean 30-49 yean 50-69 yean 70-97 yean Effect or treatment: very effective rather effective don't know rather ineffective totally ineffective no treatment
Mixed physical and mental problem Delay > 1 hour A* 4.0 -32 7.4 6.8 -- 8 . 8 - 1 3 . 0 - 2 3 . 8 - 4 6 . 8 - 1 0 . 0 Summary score 95% a t - 0.3 to 8 2 reference - 0 . 6 to 6.9 3.3 to 11.6 2.8 to 10.8 reference - 1 1 . 6 to - 6 . 1 - 1 8 . 4 to - 7 . 6 - 3 0 . 2 t o - 1 7 . 5 - 5 5 . 6 t o - 3 8 . 1 - 1 3 . 5 to - 6 . 4 P .002 •c.OOl A' 4.6 -4.1 8.5 5.7 -- 1 0 . 3 - 1 7 . 7 - 2 6 . 1 - 5 4 . 2 — 12.0 - 6 . 2 Visit score 95% O f - 0 . 7 to 9.8 reference - 0 . 5 to 8.7 3.5 to 13.6 0.9 to 10.5 reference - 1 3 . 6 t o - 6 . 9 - 2 4 . 2 t o - 1 1 . 2 - 3 3 . 8 t o - 1 8 . 4 - 6 4 . 8 t o - 4 3 . 5 - 1 6 . 3 to - 7 . 6 -\22xo -0.2 P .02 <.001 .044 A* 2.4 -2.8 5.5 10.0 --7.9 - 5 . 2 -19.5 -28.6 -52 -4.1 AcceuKore 95% a t - 2 . 8 to 7.6 reference - 1 . 8 to 7.4 0.4 to 10.6 52 to 14.8 reTerence - 1 1 . 3 to - 4 . 6 -11.8to \2 -27.2 to -11.8 -39.2 to -18.0 -9.5 to - 0 . 9 -7.4 to - 0 . 8 P •c.OOl <.001 0.006
General attitude score
A' - 2 . 7 -- 1 . 5 3.8 2.6 _ - 4 . 2 - 8 . 0 - 1 8 . 7 - 4 3 . 1 - 9 . 1 - 3 . 5 95% a t P - 7 . 5 to 2.1 0.013 reference - 5 . 6 to 2.6 - 0 . 8 to 8.4 - 1 . 7 to 7.1 reference <.001 - 7.3 to - 1 . 2 - 1 4 . 0 to - 2 . 0 - 2 6 . 0 t o - 1 1 . 4 - 5 3 . 7 t o - 3 2 . 7 - 1 3 . 1 to - 5 . 1 - 6 . 6 to - 0 . 4 .026 * Difference in scores t Confidence interval $ Response given by parents
374 T. V. Pemeger et al.
surveys, indicating that respondents took completion of the questionnaire seriously.
Predictors of patient satisfaction
Even though no norms exist for the instrument we used, patient satisfaction appeared high in this emer-gency care setting: typically, about half of the respon-dents selected the best response option to any given item, which is similar to results obtained in surveys of ambulatory patients [18] and higher than in some previous surveys of out-of-hours care [4]. The general mean we observed (80 on a scale 0-100) is close to the mean (76) derived from a systematic review of 221 satisfaction studies [19]. Thus the emergency setting needs not preclude an appropriate response to patients' needs. Whether these apparently good results would apply to other house call providers is uncertain. For instance, the ECO we studied never refuses a house call, which is likely to satisfy patients, whereas in other health care systems, a variable proportion of patients are given telephone advice only, or are sent to an emergency room [2,4,20]. Patient satisfaction may be a useful criterion for choosing among alternative ways of organizing out-of-hours health care, a matter of current debate [21,22].
Perceived effectiveness of treatment was strongly related to satisfaction. This finding has several possible explanations. The first is causality: successful treatments satisfy patients. "Curing", not "caring", may be the main reason why a patient seeks emergency care and fulfilling patient expectations is a strong determinant of patient satisfaction [23]. Expectations may be different in chronic care encounters, in which the quality of the patient-provider relationship may have a greater influence on satisfaction. But reverse causality is another possibility: patients who were satisfied with the consultation may perceive their treatment to be more effective than dissatisfied patients. A plausible intervening variable in this scenario could be higher compliance with treatment in satisfied patients [24,25]. Last, this association may be due to confounding by a nonspecific tendency of the patient to give favorable answers. Such a tendency has been noted in some [26,27], but not all [28], studies of patient satisfaction.
Several other results confirm previous research. Older age was associated with higher satisfaction, in a progres-sive fashion. This has been reported previously [29,30]. It is unclear whether older people are easier to satisfy, less likely to express dissatisfaction, or whether the ECO services were better adapted to the needs of older patients. The modest (and nonsignificant) differences between men and women also concur with a previous meta-analysis [29]. The impact of waiting time [4,5] and the importance of interpersonal relationships [25,31-33] for patient satisfaction was also confirmed, either by the analysis of satisfaction scores, or by open comments. Our finding of a moderate (but nonsignificant) association between the duration of the visit and patient satisfaction
concurs with a previous meta-analysis [32] which suggested that the amount of patient-doctor communica-tion increases patient satisfaccommunica-tion.
A more intriguing finding was that patients who suffered from mixed somatic and mental health problems were less satisfied with the house call than other patients. Perhaps complex health problems could not be fully solved during an isolated emergency house call, which resulted in patient dissatisfaction. Another possibility is that some physicians may have medicalized the cause of a poor patient-doctor relationship (itself a cause of patient dissatisfaction) by assigning a psychiatric diagnostic label to the patient. Each hypothesis would call for a different quality improvement approach within the ECO.
In conclusion, measurement of patient satisfaction with emergency house calls proved both feasible and potentially beneficial for quality improvement interven-tions in the emergency care setting.
REFERENCES
1. Cleary, P. D. and McNeil, B. J., Patient satisfaction as an indicator of quality care. Inquiry 1988; 25: 25-36.
2. Sawyer, L. and Arber, S., Changes in home visiting and night and weekend cover: the patient's view.
BMJ1982; 284: 1531-1534.
3. Prudhoe, R. H., Deputising services. BMJ 1984; 288: 718.
4. Bollam, M. J., McCarthy, M. and Modell, M., Patients' assessment of out of hours care in general practice. BMJ 1988; 296: 829-832.
5. Dixon, R. A. and Williams, B. T., Patient satisfac-tion with general practisatisfac-tioner deputising services.
BMJ 1988; 297: 1519-1522.
6. McKinley, R. K., Cragg, D. K., Hastings, A. M., French, D. P., Manku-Scott, T. K., Campbell, S. M., Van, F., Roland, M. O. and Roberts, C , Compar-ison of out of hours care provided by patients' own general practitioners and commercial deputising ser-vices: a randomised controlled trial II: The outcome of care. BMJ 1997; 314: 190-193.
7. Ware, J. E. and Davies, A. R., GHAA's consumer
satisfaction survey and user's manual. Washington,
DC: Group Health Association of America, Inc, 1991.
8. Carey, R. G. and Siebert, J. H., A patient survey system to measure quality improvement: question-naire reliability and validity. Med Care 1993; 31: 834-845.
9. Bowman, M. A., Herndon, A., Sharp, P. C. and Dignan, M. B., Assessment of the Patient-Doctor Interaction Scale for measuring patient satisfaction.
Pat Educ Counsel 1992; 19: 75-80.
10. Ware, J. E. and Hays, R. D., Methods for measuring patient satisfaction with specific medical encounters.
Med Care 1988; 26: 393-^02.
11. Nunnally, J. C. and Bernstein, I. H.t Psychometric
theory, 3rd edition. New York: McGraw-Hill, Inc.,
1994.
medical research, 2nd edition. Oxford: Blackwell
Scientific Publications 1987.
13. SPSS Inc. SPSS for Windows, version 6.1. Chicago, DL: SPSS Inc., 1992.
14. Etter, J. F. and Perneger, T. V., Does sponsorship matter in patient satisfaction surveys? A randomized trial. MedCare 1996; 34: 327-335.
15. Marshall, G. N., Hays, R. D., Sherbourne, C. D. and Wells, K. B., The structure of patient satisfaction with outpatient medical care. Psychol Assessment
1993; 5: 477-483.
16. Hulka, B. S. and Zyzanski, S. J., Validation of a patient satisfaction scale. Med Care 1982; 20: 649-653.
17. Roter, D. L., Hall, J. A. and Katz, N. R., Relations between physicians' behaviors and analogue patients' satisfaction, recall and impressions. Med
Care 1987; 25: 437-451.
18. Rubin, H. R., Gandek, B., Rogers, W. H., Kosinski, M., McHorney, C. A. and Ware, J. E., Patients' ratings of outpatient visits in different practice set-tings: Results from the Medical Outcomes Study.
JAMA 1993; 270: 835-840.
19. Hall, J. A. and Dornan, M. C , Meta-analysis of satisication with medical care: Description of research domain and analysis of overall satisfaction levels. Soc Sci Med 1988; 27: 637-644.
20. Olesen, F. and Jolleys, J. V., Out of hours service: the Danish solution examined. BMJ 1994; 309: 1624-1626.
21. Hallam, L. and Cragg, D., Organisation of primary care services outside normal working hours. BMJ 1994; 309: 1621-1623.
22. Hurwitz, B., Out of hours. BMJ 1994; 309: 1593— 1594.
23. Like, R. and Zyzanski, S. J., Patient satisfaction with
the clinical encounter: social psychological determi-nants. Soc Sci Med 1987; 24: 351-357.
24. Linn, M. W., Linn, B. S. and Stein, S. R., Satisfac-tion with ambulatory care and compliance in older patients. Med Care 1982; 20: 606-614.
25. Francis, V., Korsch, B. M. and Morris, M. J., Gaps in doctor-patient communication. Patients' response to medical advice. N Engl J Med 1969; 280: 535-540. 26. Roberts, R. E., Pascoe, G. C. and Attkisson, C. C , Relationship of service satisfaction to life satisfac-tion and perceived well-being. Eval Program Plan
1983; 6: 373-383.
27. Carmel, S., Satisfaction with hospitalization: a com-parative analysis of three types of services. Soc Sci
Med 1985; 21: 1243-1249.
28. Etter, J. F. and Perneger, T. V., Validating a satisfac-tion quessatisfac-tionnaire using multiple approaches: a case study. Soc Sci Med 1997 (in press)
29. Hall, J. A. and Dornan, M. C , Patient sociodemo-graphic characteristics as predictors of satisfaction with medical care: a meta-analysis. Soc Sci Med
1990; 30: 811-818.
30. Weiss, G., Patient satisfaction with primary medical care. Evaluation of sociodemographic and predispo-sitional factors. MedCare 1988; 26: 383-392. 31. Williams, S. J. and Calnan, M., Key determinants of
consumer satisfaction with general practice. Family
Practice 1991; 8: 237-242.
32. Smith, C. H. and Armstrong, D., Comparison of criteria derived by government and patients for evaluating general practitioner services. BMJ 1989;
299: 494-496.
33. Hall, J. A., Roter, D. L. and Katz, N. R., Meta-analysis of correlates of provider behavior in medical. encounters. Med Care 1988; 26: 657-675.